Menlo Park, CA Map & Demographics
Menlo Park Map
Menlo Park Overview
$113,716
PER CAPITA INCOME
$250,001
AVG FAMILY INCOME
$198,273
AVG HOUSEHOLD INCOME
40.0%
WAGE / INCOME GAP [ % ]
60.0¢/ $1
WAGE / INCOME GAP [ $ ]
0.52
INEQUALITY / GINI INDEX
33,324
TOTAL POPULATION
16,336
MALE POPULATION
16,988
FEMALE POPULATION
96.16
MALES / 100 FEMALES
103.99
FEMALES / 100 MALES
38.5
MEDIAN AGE
3.3
AVG FAMILY SIZE
2.8
AVG HOUSEHOLD SIZE
17,301
LABOR FORCE [ PEOPLE ]
65.6%
PERCENT IN LABOR FORCE
4.3%
UNEMPLOYMENT RATE
Menlo Park Zip Codes
Menlo Park Area Codes
Income in Menlo Park
Income Overview in Menlo Park
Per Capita Income in Menlo Park is $113,716, while median incomes of families and households are $250,001 and $198,273 respectively.
| Characteristic | Number | Measure |
| Per Capita Income | 33,324 | $113,716 |
| Median Family Income | 7,802 | $250,001 |
| Mean Family Income | 7,802 | $382,569 |
| Median Household Income | 11,661 | $198,273 |
| Mean Household Income | 11,661 | $316,584 |
| Income Deficit | 7,802 | $0 |
| Wage / Income Gap (%) | 33,324 | 40.02% |
| Wage / Income Gap ($) | 33,324 | 59.98¢ per $1 |
| Gini / Inequality Index | 33,324 | 0.52 |
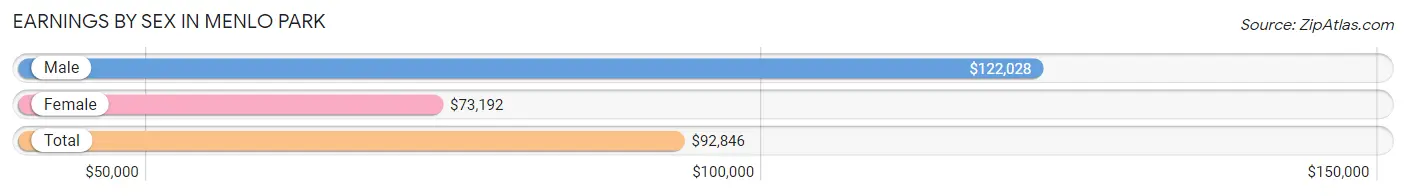
Earnings by Sex in Menlo Park
Average Earnings in Menlo Park are $92,846, $122,028 for men and $73,192 for women, a difference of 40.0%.
| Sex | Number | Average Earnings |
| Male | 10,023 (55.1%) | $122,028 |
| Female | 8,176 (44.9%) | $73,192 |
| Total | 18,199 (100.0%) | $92,846 |
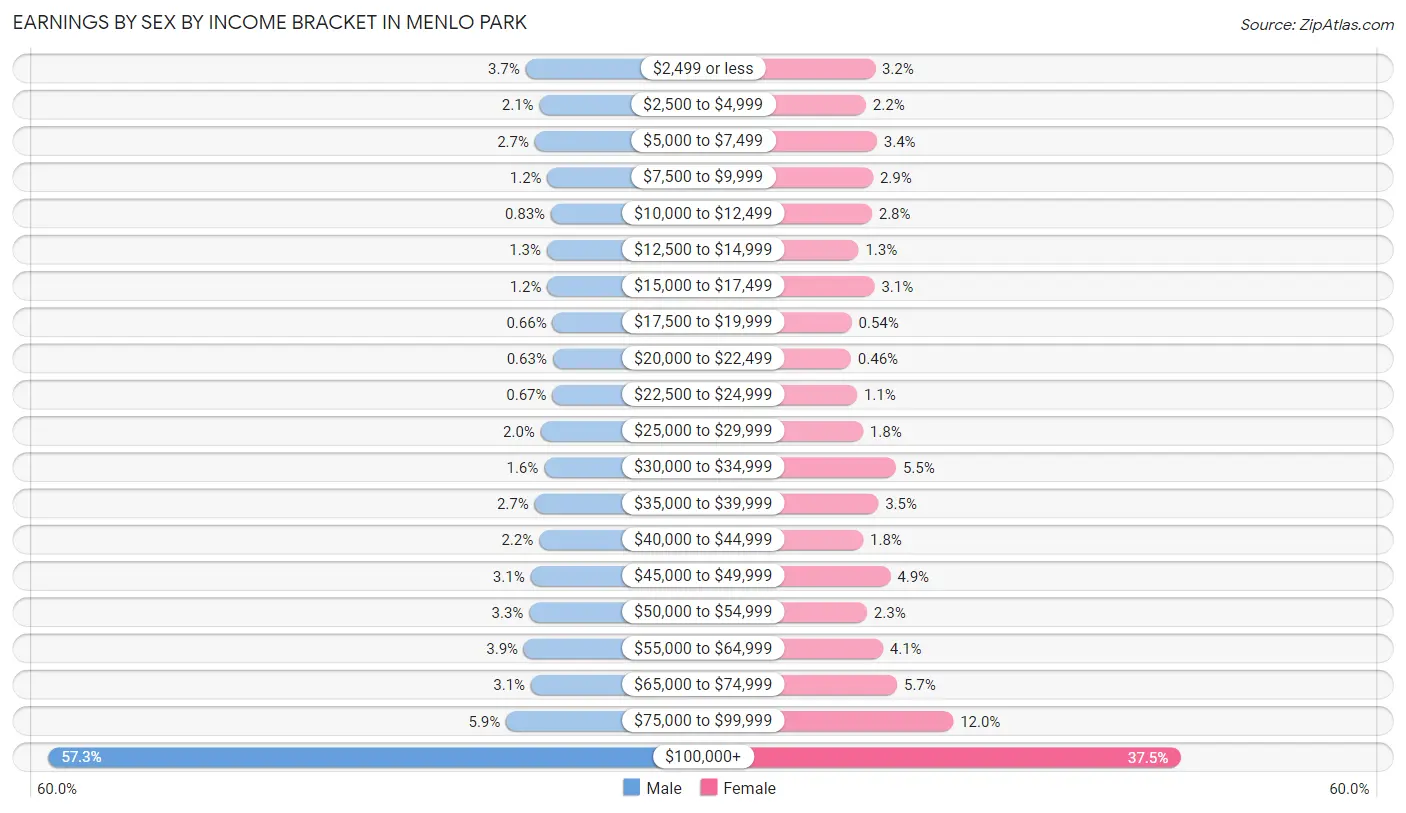
Earnings by Sex by Income Bracket in Menlo Park
The most common earnings brackets in Menlo Park are $100,000+ for men (5,746 | 57.3%) and $100,000+ for women (3,063 | 37.5%).
| Income | Male | Female |
| $2,499 or less | 369 (3.7%) | 259 (3.2%) |
| $2,500 to $4,999 | 213 (2.1%) | 176 (2.1%) |
| $5,000 to $7,499 | 266 (2.6%) | 276 (3.4%) |
| $7,500 to $9,999 | 123 (1.2%) | 240 (2.9%) |
| $10,000 to $12,499 | 83 (0.8%) | 230 (2.8%) |
| $12,500 to $14,999 | 129 (1.3%) | 107 (1.3%) |
| $15,000 to $17,499 | 124 (1.2%) | 254 (3.1%) |
| $17,500 to $19,999 | 66 (0.7%) | 44 (0.5%) |
| $20,000 to $22,499 | 63 (0.6%) | 38 (0.5%) |
| $22,500 to $24,999 | 67 (0.7%) | 93 (1.1%) |
| $25,000 to $29,999 | 199 (2.0%) | 148 (1.8%) |
| $30,000 to $34,999 | 160 (1.6%) | 452 (5.5%) |
| $35,000 to $39,999 | 269 (2.7%) | 289 (3.5%) |
| $40,000 to $44,999 | 218 (2.2%) | 150 (1.8%) |
| $45,000 to $49,999 | 314 (3.1%) | 401 (4.9%) |
| $50,000 to $54,999 | 329 (3.3%) | 185 (2.3%) |
| $55,000 to $64,999 | 388 (3.9%) | 331 (4.1%) |
| $65,000 to $74,999 | 309 (3.1%) | 462 (5.7%) |
| $75,000 to $99,999 | 588 (5.9%) | 978 (12.0%) |
| $100,000+ | 5,746 (57.3%) | 3,063 (37.5%) |
| Total | 10,023 (100.0%) | 8,176 (100.0%) |
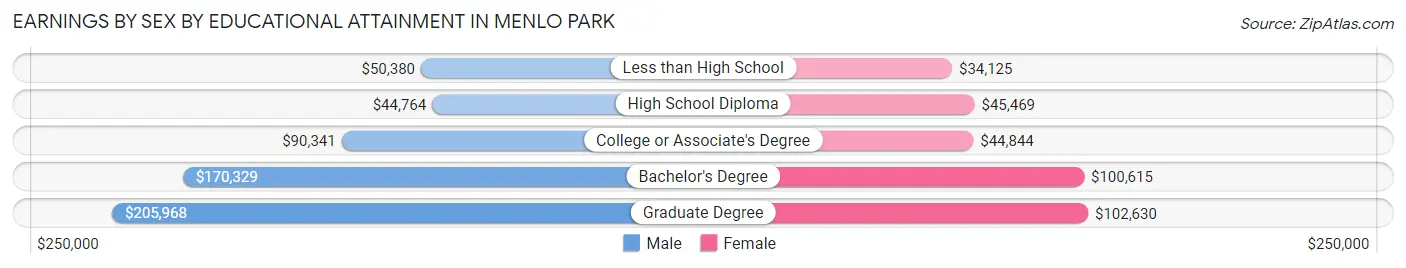
Earnings by Sex by Educational Attainment in Menlo Park
Average earnings in Menlo Park are $143,432 for men and $84,567 for women, a difference of 41.0%. Men with an educational attainment of graduate degree enjoy the highest average annual earnings of $205,968, while those with high school diploma education earn the least with $44,764. Women with an educational attainment of graduate degree earn the most with the average annual earnings of $102,630, while those with less than high school education have the smallest earnings of $34,125.
| Educational Attainment | Male Income | Female Income |
| Less than High School | $50,380 | $34,125 |
| High School Diploma | $44,764 | $45,469 |
| College or Associate's Degree | $90,341 | $44,844 |
| Bachelor's Degree | $170,329 | $100,615 |
| Graduate Degree | $205,968 | $102,630 |
| Total | $143,432 | $84,567 |
Family Income in Menlo Park
Family Income Brackets in Menlo Park
According to the Menlo Park family income data, there are 4,595 families falling into the $200,000+ income range, which is the most common income bracket and makes up 58.9% of all families. Conversely, the less than $10,000 income bracket is the least frequent group with only 55 families (0.7%) belonging to this category.
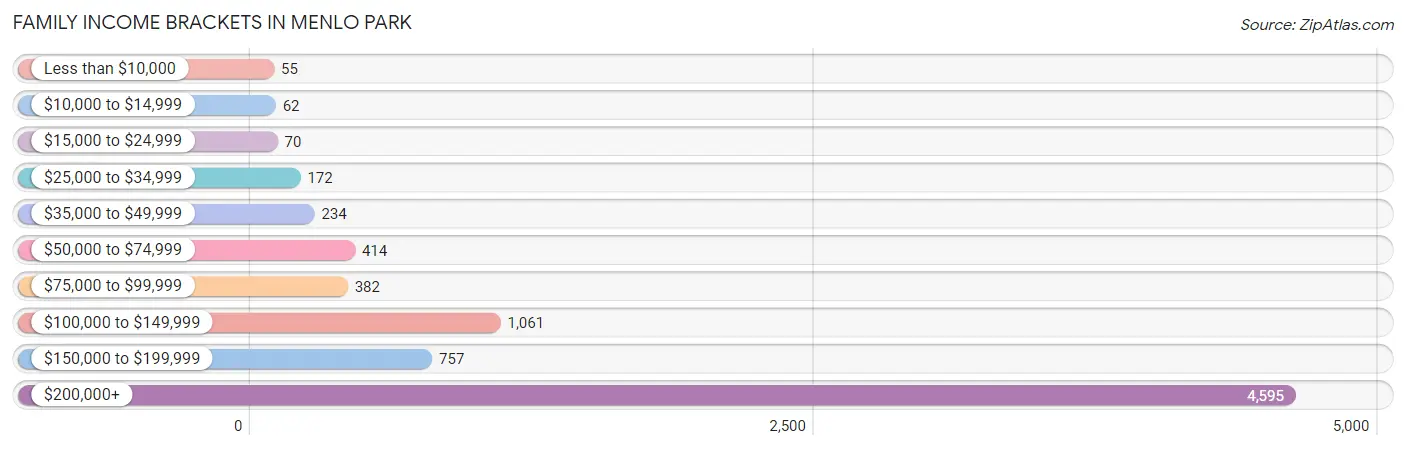
| Income Bracket | # Families | % Families |
| Less than $10,000 | 55 | 0.7% |
| $10,000 to $14,999 | 62 | 0.8% |
| $15,000 to $24,999 | 70 | 0.9% |
| $25,000 to $34,999 | 172 | 2.2% |
| $35,000 to $49,999 | 234 | 3.0% |
| $50,000 to $74,999 | 414 | 5.3% |
| $75,000 to $99,999 | 382 | 4.9% |
| $100,000 to $149,999 | 1,061 | 13.6% |
| $150,000 to $199,999 | 757 | 9.7% |
| $200,000+ | 4,595 | 58.9% |
Family Income by Famaliy Size in Menlo Park
3-person families (1,916 | 24.6%) account for the highest median family income in Menlo Park with $250,001 per family, while 3-person families (1,916 | 24.6%) have the highest median income of $83,334 per family member.

| Income Bracket | # Families | Median Income |
| 2-Person Families | 3,191 (40.9%) | $160,471 |
| 3-Person Families | 1,916 (24.6%) | $250,001 |
| 4-Person Families | 1,743 (22.3%) | $250,001 |
| 5-Person Families | 776 (10.0%) | $250,001 |
| 6-Person Families | 64 (0.8%) | $250,001 |
| 7+ Person Families | 112 (1.4%) | $250,001 |
| Total | 7,802 (100.0%) | $250,001 |
Family Income by Number of Earners in Menlo Park
The median family income in Menlo Park is $250,001, with families comprising 2 earners (3,767) having the highest median family income of $250,001, while families with no earners (661) have the lowest median family income of $117,321, accounting for 48.3% and 8.5% of families, respectively.
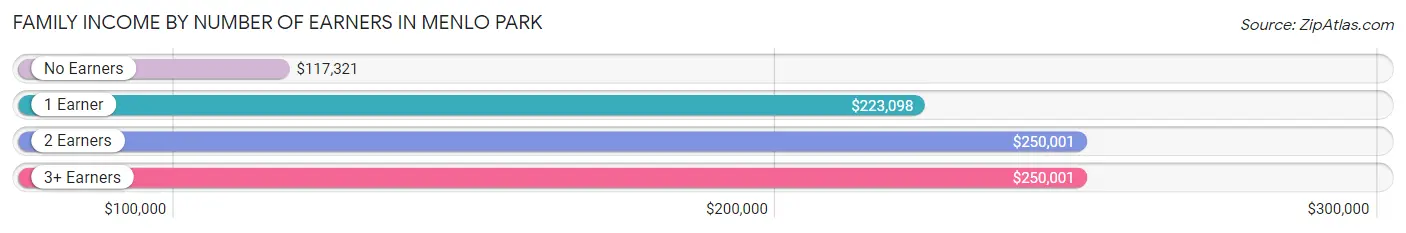
| Number of Earners | # Families | Median Income |
| No Earners | 661 (8.5%) | $117,321 |
| 1 Earner | 2,617 (33.5%) | $223,098 |
| 2 Earners | 3,767 (48.3%) | $250,001 |
| 3+ Earners | 757 (9.7%) | $250,001 |
| Total | 7,802 (100.0%) | $250,001 |
Household Income in Menlo Park
Household Income Brackets in Menlo Park
With 5,737 households falling in the category, the $200,000+ income range is the most frequent in Menlo Park, accounting for 49.2% of all households. In contrast, only 152 households (1.3%) fall into the $10,000 to $14,999 income bracket, making it the least populous group.
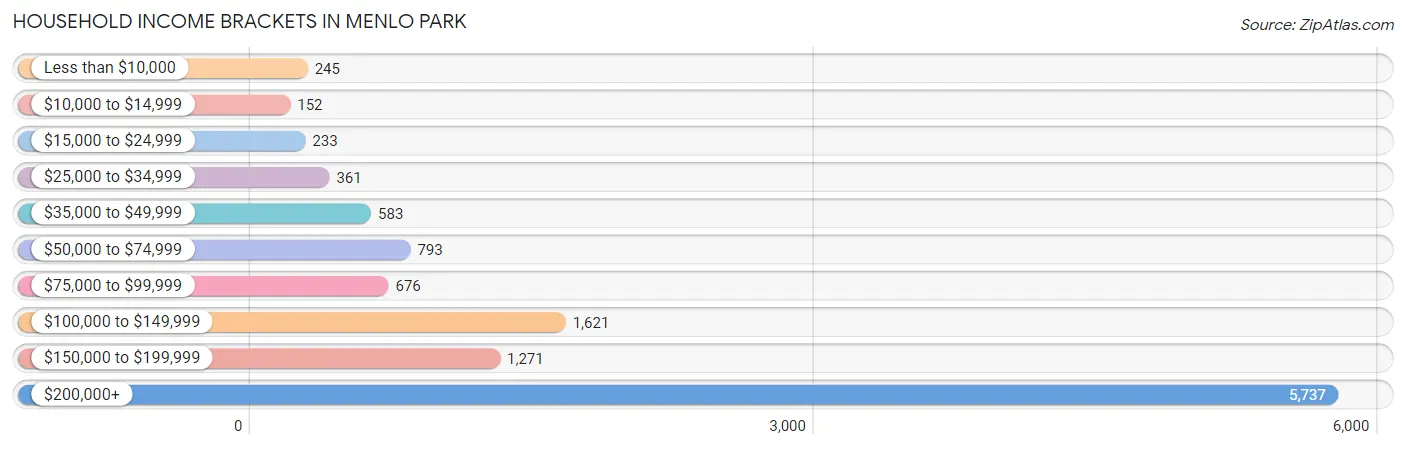
| Income Bracket | # Households | % Households |
| Less than $10,000 | 245 | 2.1% |
| $10,000 to $14,999 | 152 | 1.3% |
| $15,000 to $24,999 | 233 | 2.0% |
| $25,000 to $34,999 | 361 | 3.1% |
| $35,000 to $49,999 | 583 | 5.0% |
| $50,000 to $74,999 | 793 | 6.8% |
| $75,000 to $99,999 | 676 | 5.8% |
| $100,000 to $149,999 | 1,621 | 13.9% |
| $150,000 to $199,999 | 1,271 | 10.9% |
| $200,000+ | 5,737 | 49.2% |
Household Income by Householder Age in Menlo Park
The median household income in Menlo Park is $198,273, with the highest median household income of $250,001 found in the 45 to 64 years age bracket for the primary householder. A total of 4,211 households (36.1%) fall into this category. Meanwhile, the 15 to 24 years age bracket for the primary householder has the lowest median household income of $122,888, with 313 households (2.7%) in this group.
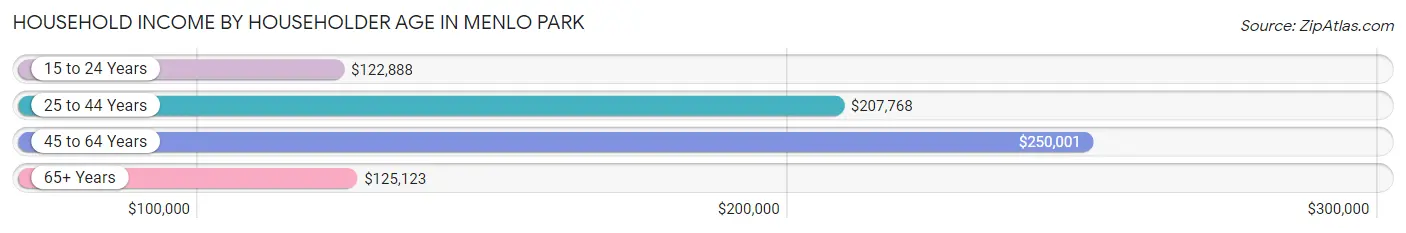
| Income Bracket | # Households | Median Income |
| 15 to 24 Years | 313 (2.7%) | $122,888 |
| 25 to 44 Years | 4,187 (35.9%) | $207,768 |
| 45 to 64 Years | 4,211 (36.1%) | $250,001 |
| 65+ Years | 2,950 (25.3%) | $125,123 |
| Total | 11,661 (100.0%) | $198,273 |
Poverty in Menlo Park
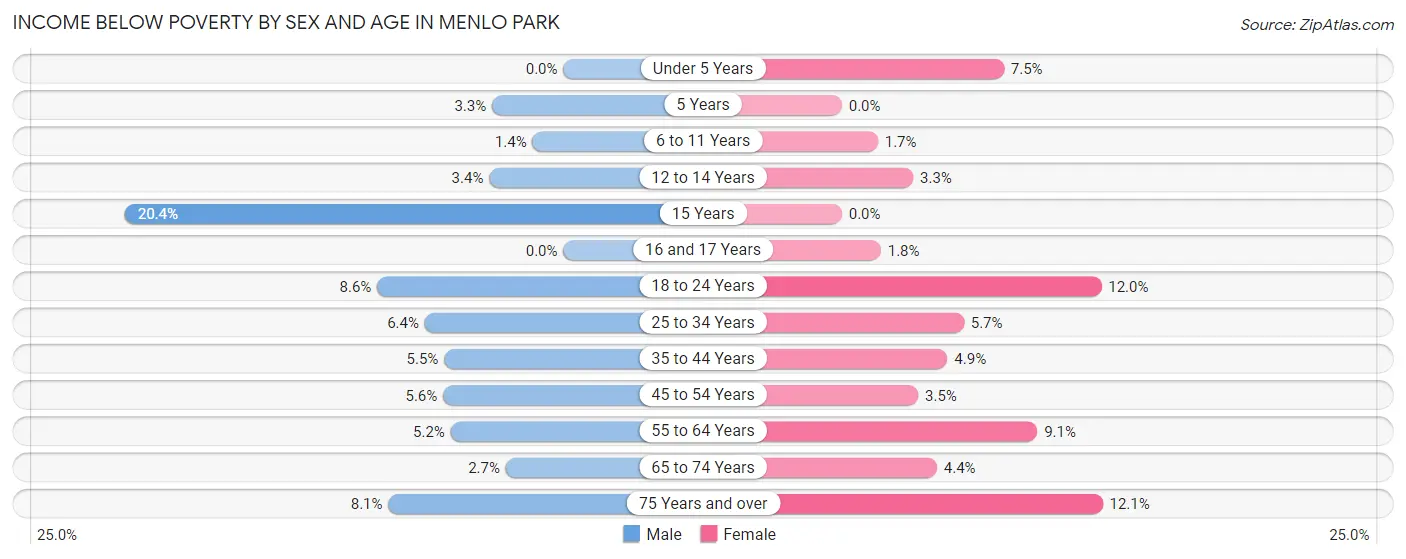
Income Below Poverty by Sex and Age in Menlo Park
With 5.0% poverty level for males and 6.0% for females among the residents of Menlo Park, 15 year old males and 75 year old and over females are the most vulnerable to poverty, with 23 males (20.3%) and 141 females (12.1%) in their respective age groups living below the poverty level.
| Age Bracket | Male | Female |
| Under 5 Years | 0 (0.0%) | 73 (7.5%) |
| 5 Years | 6 (3.3%) | 0 (0.0%) |
| 6 to 11 Years | 20 (1.4%) | 23 (1.7%) |
| 12 to 14 Years | 17 (3.4%) | 18 (3.3%) |
| 15 Years | 23 (20.3%) | 0 (0.0%) |
| 16 and 17 Years | 0 (0.0%) | 7 (1.8%) |
| 18 to 24 Years | 104 (8.6%) | 188 (12.0%) |
| 25 to 34 Years | 145 (6.4%) | 125 (5.7%) |
| 35 to 44 Years | 147 (5.5%) | 124 (4.9%) |
| 45 to 54 Years | 120 (5.6%) | 76 (3.5%) |
| 55 to 64 Years | 107 (5.2%) | 164 (9.1%) |
| 65 to 74 Years | 29 (2.7%) | 71 (4.4%) |
| 75 Years and over | 81 (8.1%) | 141 (12.1%) |
| Total | 799 (5.0%) | 1,010 (6.0%) |
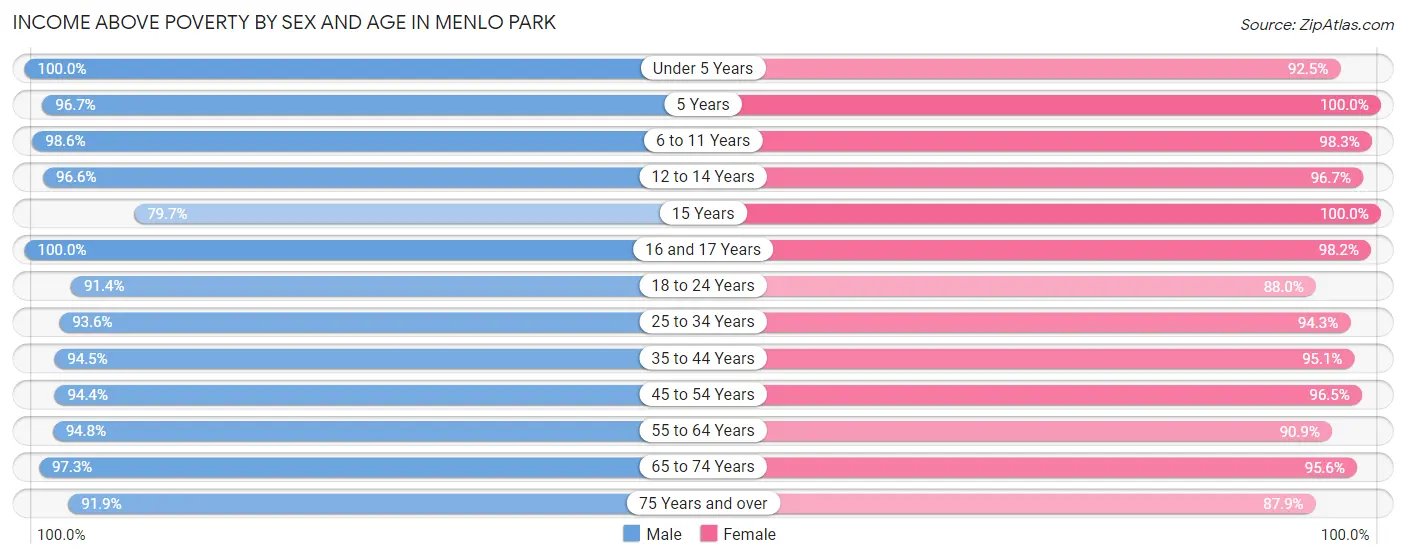
Income Above Poverty by Sex and Age in Menlo Park
According to the poverty statistics in Menlo Park, males aged under 5 years and females aged 5 years are the age groups that are most secure financially, with 100.0% of males and 100.0% of females in these age groups living above the poverty line.
| Age Bracket | Male | Female |
| Under 5 Years | 1,254 (100.0%) | 898 (92.5%) |
| 5 Years | 175 (96.7%) | 396 (100.0%) |
| 6 to 11 Years | 1,382 (98.6%) | 1,352 (98.3%) |
| 12 to 14 Years | 477 (96.6%) | 525 (96.7%) |
| 15 Years | 90 (79.6%) | 173 (100.0%) |
| 16 and 17 Years | 276 (100.0%) | 380 (98.2%) |
| 18 to 24 Years | 1,100 (91.4%) | 1,374 (88.0%) |
| 25 to 34 Years | 2,109 (93.6%) | 2,084 (94.3%) |
| 35 to 44 Years | 2,513 (94.5%) | 2,408 (95.1%) |
| 45 to 54 Years | 2,030 (94.4%) | 2,072 (96.5%) |
| 55 to 64 Years | 1,940 (94.8%) | 1,644 (90.9%) |
| 65 to 74 Years | 1,056 (97.3%) | 1,539 (95.6%) |
| 75 Years and over | 916 (91.9%) | 1,024 (87.9%) |
| Total | 15,318 (95.0%) | 15,869 (94.0%) |
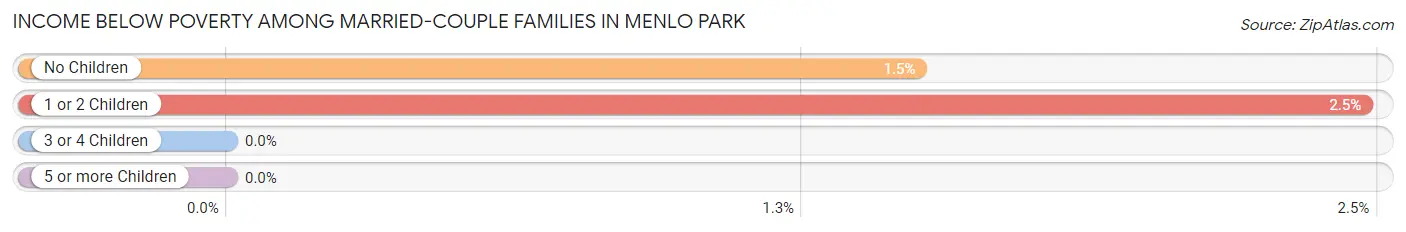
Income Below Poverty Among Married-Couple Families in Menlo Park
The poverty statistics for married-couple families in Menlo Park show that 1.8% or 115 of the total 6,514 families live below the poverty line. Families with 1 or 2 children have the highest poverty rate of 2.5%, comprising of 68 families. On the other hand, families with 3 or 4 children have the lowest poverty rate of 0.0%, which includes 0 families.
| Children | Above Poverty | Below Poverty |
| No Children | 3,076 (98.5%) | 47 (1.5%) |
| 1 or 2 Children | 2,685 (97.5%) | 68 (2.5%) |
| 3 or 4 Children | 625 (100.0%) | 0 (0.0%) |
| 5 or more Children | 13 (100.0%) | 0 (0.0%) |
| Total | 6,399 (98.2%) | 115 (1.8%) |
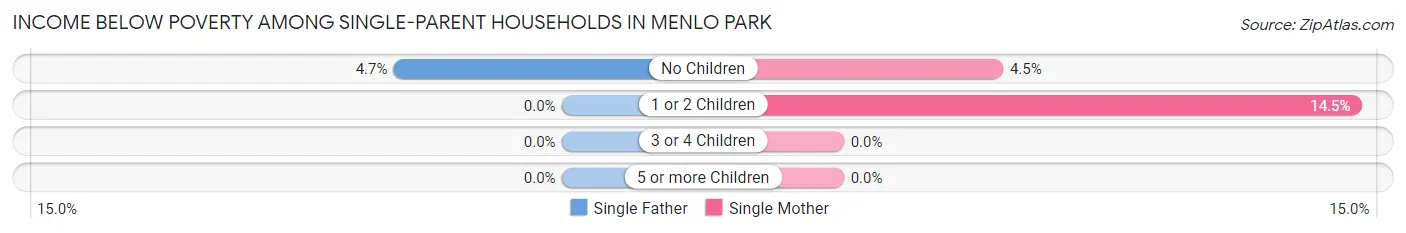
Income Below Poverty Among Single-Parent Households in Menlo Park
According to the poverty data in Menlo Park, 3.4% or 11 single-father households and 9.5% or 92 single-mother households are living below the poverty line. Among single-father households, those with no children have the highest poverty rate, with 11 households (4.7%) experiencing poverty. Likewise, among single-mother households, those with 1 or 2 children have the highest poverty rate, with 72 households (14.5%) falling below the poverty line.
| Children | Single Father | Single Mother |
| No Children | 11 (4.7%) | 20 (4.4%) |
| 1 or 2 Children | 0 (0.0%) | 72 (14.5%) |
| 3 or 4 Children | 0 (0.0%) | 0 (0.0%) |
| 5 or more Children | 0 (0.0%) | 0 (0.0%) |
| Total | 11 (3.4%) | 92 (9.5%) |
Income Below Poverty Among Married-Couple vs Single-Parent Households in Menlo Park
The poverty data for Menlo Park shows that 115 of the married-couple family households (1.8%) and 103 of the single-parent households (8.0%) are living below the poverty level. Within the married-couple family households, those with 1 or 2 children have the highest poverty rate, with 68 households (2.5%) falling below the poverty line. Among the single-parent households, those with 1 or 2 children have the highest poverty rate, with 72 household (12.3%) living below poverty.
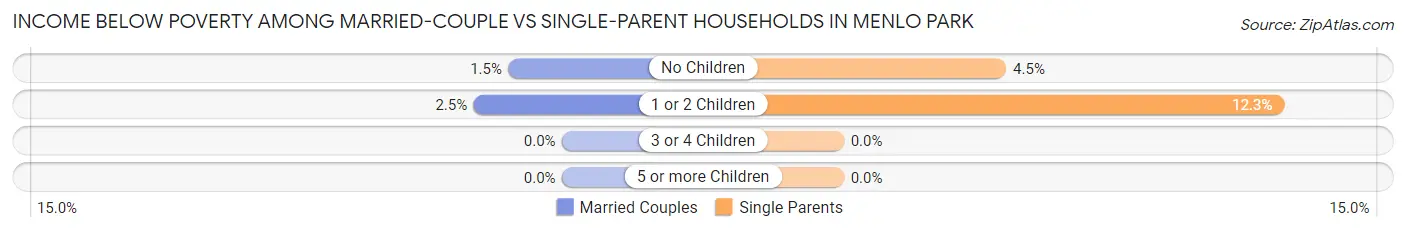
| Children | Married-Couple Families | Single-Parent Households |
| No Children | 47 (1.5%) | 31 (4.5%) |
| 1 or 2 Children | 68 (2.5%) | 72 (12.3%) |
| 3 or 4 Children | 0 (0.0%) | 0 (0.0%) |
| 5 or more Children | 0 (0.0%) | 0 (0.0%) |
| Total | 115 (1.8%) | 103 (8.0%) |
Race in Menlo Park
The most populous races in Menlo Park are White / Caucasian (20,091 | 60.3%), Hispanic or Latino (5,773 | 17.3%), and Asian (5,525 | 16.6%).
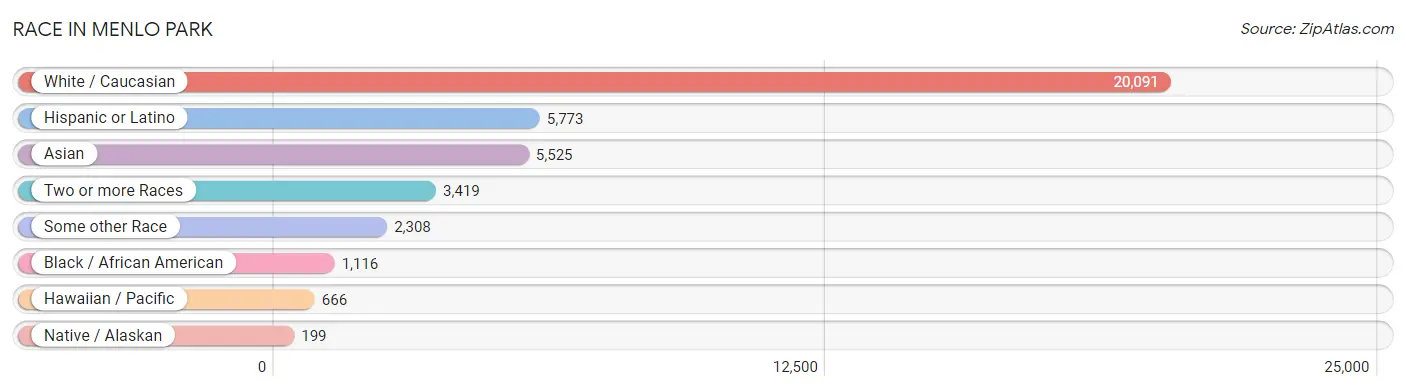
| Race | # Population | % Population |
| Asian | 5,525 | 16.6% |
| Black / African American | 1,116 | 3.4% |
| Hawaiian / Pacific | 666 | 2.0% |
| Hispanic or Latino | 5,773 | 17.3% |
| Native / Alaskan | 199 | 0.6% |
| White / Caucasian | 20,091 | 60.3% |
| Two or more Races | 3,419 | 10.3% |
| Some other Race | 2,308 | 6.9% |
| Total | 33,324 | 100.0% |
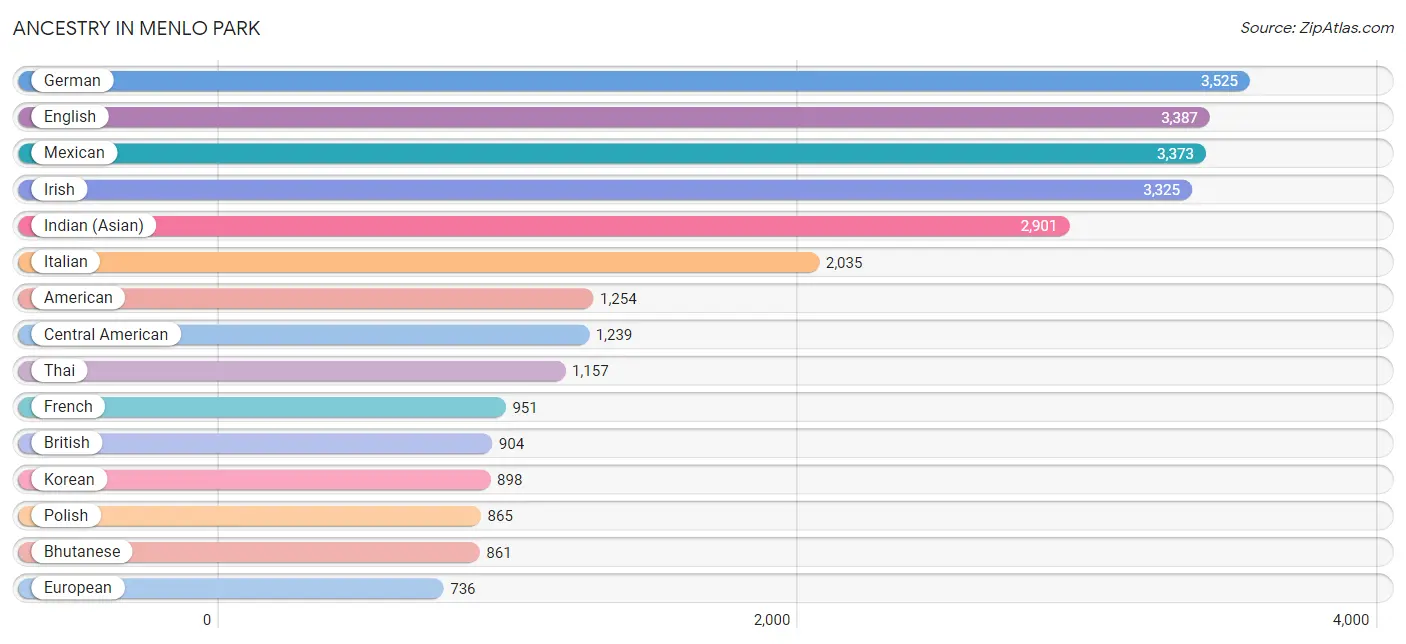
Ancestry in Menlo Park
The most populous ancestries reported in Menlo Park are German (3,525 | 10.6%), English (3,387 | 10.2%), Mexican (3,373 | 10.1%), Irish (3,325 | 10.0%), and Indian (Asian) (2,901 | 8.7%), together accounting for 49.5% of all Menlo Park residents.
| Ancestry | # Population | % Population |
| Afghan | 14 | 0.0% |
| African | 61 | 0.2% |
| Alsatian | 9 | 0.0% |
| American | 1,254 | 3.8% |
| Apache | 4 | 0.0% |
| Arab | 247 | 0.7% |
| Argentinean | 58 | 0.2% |
| Armenian | 29 | 0.1% |
| Austrian | 74 | 0.2% |
| Barbadian | 99 | 0.3% |
| Basque | 54 | 0.2% |
| Belgian | 95 | 0.3% |
| Bhutanese | 861 | 2.6% |
| Bolivian | 35 | 0.1% |
| Brazilian | 79 | 0.2% |
| British | 904 | 2.7% |
| Bulgarian | 91 | 0.3% |
| Burmese | 700 | 2.1% |
| Canadian | 80 | 0.2% |
| Central American | 1,239 | 3.7% |
| Central American Indian | 176 | 0.5% |
| Cherokee | 48 | 0.1% |
| Chilean | 22 | 0.1% |
| Colombian | 215 | 0.6% |
| Costa Rican | 230 | 0.7% |
| Croatian | 137 | 0.4% |
| Cuban | 40 | 0.1% |
| Czech | 136 | 0.4% |
| Czechoslovakian | 7 | 0.0% |
| Danish | 356 | 1.1% |
| Dutch | 536 | 1.6% |
| Eastern European | 150 | 0.4% |
| Ecuadorian | 58 | 0.2% |
| Egyptian | 17 | 0.1% |
| English | 3,387 | 10.2% |
| Estonian | 30 | 0.1% |
| European | 736 | 2.2% |
| Filipino | 70 | 0.2% |
| Finnish | 72 | 0.2% |
| French | 951 | 2.9% |
| French Canadian | 99 | 0.3% |
| German | 3,525 | 10.6% |
| Greek | 259 | 0.8% |
| Guatemalan | 123 | 0.4% |
| Haitian | 4 | 0.0% |
| Honduran | 153 | 0.5% |
| Hungarian | 185 | 0.6% |
| Icelander | 22 | 0.1% |
| Indian (Asian) | 2,901 | 8.7% |
| Indonesian | 29 | 0.1% |
| Iranian | 261 | 0.8% |
| Irish | 3,325 | 10.0% |
| Israeli | 372 | 1.1% |
| Italian | 2,035 | 6.1% |
| Jamaican | 152 | 0.5% |
| Kiowa | 5 | 0.0% |
| Korean | 898 | 2.7% |
| Laotian | 49 | 0.2% |
| Latvian | 13 | 0.0% |
| Lebanese | 99 | 0.3% |
| Lithuanian | 62 | 0.2% |
| Mexican | 3,373 | 10.1% |
| Mexican American Indian | 57 | 0.2% |
| Native Hawaiian | 166 | 0.5% |
| Nepalese | 11 | 0.0% |
| New Zealander | 15 | 0.1% |
| Nicaraguan | 116 | 0.4% |
| Northern European | 295 | 0.9% |
| Norwegian | 352 | 1.1% |
| Ottawa | 13 | 0.0% |
| Pakistani | 94 | 0.3% |
| Panamanian | 18 | 0.1% |
| Peruvian | 200 | 0.6% |
| Polish | 865 | 2.6% |
| Portuguese | 115 | 0.4% |
| Puerto Rican | 30 | 0.1% |
| Romanian | 149 | 0.4% |
| Russian | 606 | 1.8% |
| Salvadoran | 599 | 1.8% |
| Samoan | 426 | 1.3% |
| Scandinavian | 61 | 0.2% |
| Scotch-Irish | 229 | 0.7% |
| Scottish | 530 | 1.6% |
| Serbian | 96 | 0.3% |
| Sioux | 14 | 0.0% |
| Slavic | 29 | 0.1% |
| Slovak | 16 | 0.1% |
| Slovene | 45 | 0.1% |
| South American | 650 | 1.9% |
| South American Indian | 84 | 0.3% |
| Spaniard | 147 | 0.4% |
| Spanish | 217 | 0.6% |
| Sri Lankan | 274 | 0.8% |
| Subsaharan African | 61 | 0.2% |
| Swedish | 480 | 1.4% |
| Swiss | 219 | 0.7% |
| Syrian | 57 | 0.2% |
| Thai | 1,157 | 3.5% |
| Tongan | 528 | 1.6% |
| Turkish | 118 | 0.4% |
| Ukrainian | 208 | 0.6% |
| Venezuelan | 62 | 0.2% |
| Vietnamese | 54 | 0.2% |
| Welsh | 108 | 0.3% |
| Yugoslavian | 12 | 0.0% | View All 105 Rows |
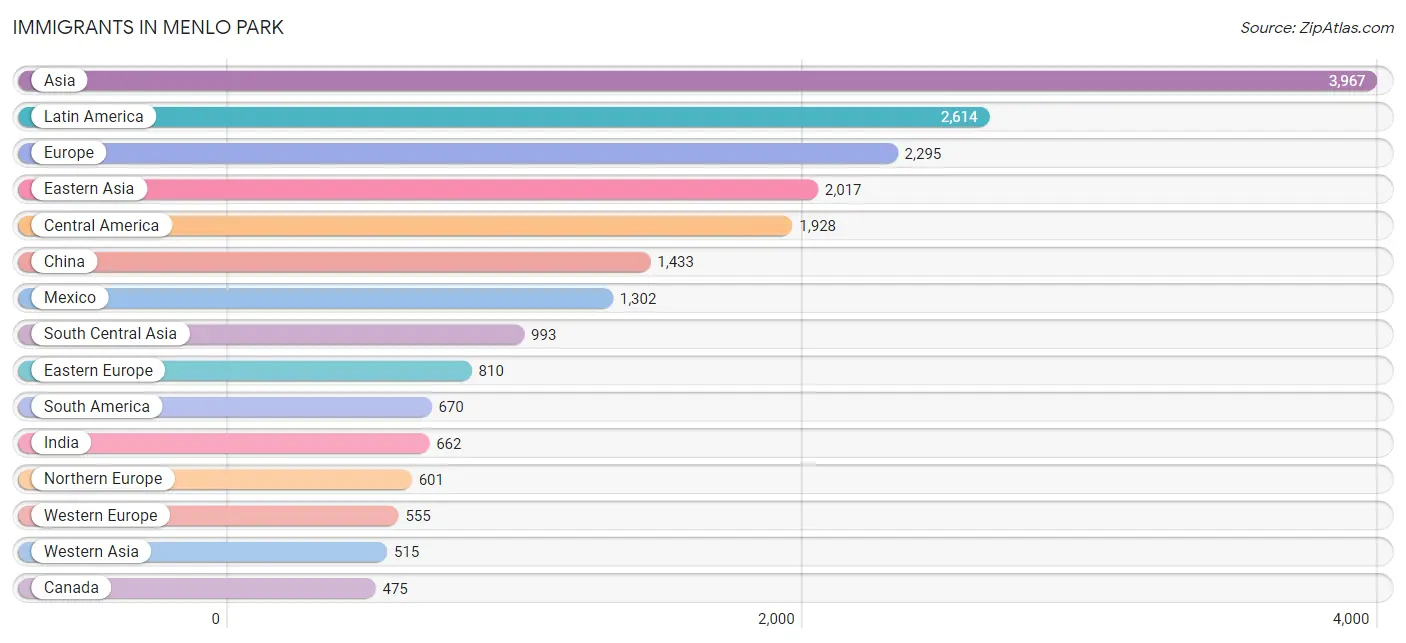
Immigrants in Menlo Park
The most numerous immigrant groups reported in Menlo Park came from Asia (3,967 | 11.9%), Latin America (2,614 | 7.8%), Europe (2,295 | 6.9%), Eastern Asia (2,017 | 6.0%), and Central America (1,928 | 5.8%), together accounting for 38.5% of all Menlo Park residents.
| Immigration Origin | # Population | % Population |
| Afghanistan | 14 | 0.0% |
| Africa | 93 | 0.3% |
| Argentina | 46 | 0.1% |
| Asia | 3,967 | 11.9% |
| Australia | 178 | 0.5% |
| Bangladesh | 54 | 0.2% |
| Belarus | 17 | 0.1% |
| Belgium | 44 | 0.1% |
| Brazil | 302 | 0.9% |
| Bulgaria | 96 | 0.3% |
| Canada | 475 | 1.4% |
| Caribbean | 16 | 0.1% |
| Central America | 1,928 | 5.8% |
| Chile | 20 | 0.1% |
| China | 1,433 | 4.3% |
| Colombia | 80 | 0.2% |
| Costa Rica | 28 | 0.1% |
| Denmark | 20 | 0.1% |
| Dominican Republic | 12 | 0.0% |
| Eastern Africa | 24 | 0.1% |
| Eastern Asia | 2,017 | 6.0% |
| Eastern Europe | 810 | 2.4% |
| Ecuador | 29 | 0.1% |
| Egypt | 10 | 0.0% |
| El Salvador | 359 | 1.1% |
| England | 56 | 0.2% |
| Ethiopia | 15 | 0.1% |
| Europe | 2,295 | 6.9% |
| France | 134 | 0.4% |
| Germany | 259 | 0.8% |
| Ghana | 16 | 0.1% |
| Greece | 72 | 0.2% |
| Guatemala | 33 | 0.1% |
| Haiti | 4 | 0.0% |
| Honduras | 77 | 0.2% |
| Hong Kong | 189 | 0.6% |
| Hungary | 92 | 0.3% |
| India | 662 | 2.0% |
| Indonesia | 16 | 0.1% |
| Iran | 201 | 0.6% |
| Iraq | 33 | 0.1% |
| Ireland | 49 | 0.2% |
| Israel | 339 | 1.0% |
| Italy | 192 | 0.6% |
| Japan | 261 | 0.8% |
| Korea | 323 | 1.0% |
| Latin America | 2,614 | 7.8% |
| Lebanon | 47 | 0.1% |
| Lithuania | 18 | 0.1% |
| Malaysia | 11 | 0.0% |
| Mexico | 1,302 | 3.9% |
| Morocco | 16 | 0.1% |
| Netherlands | 47 | 0.1% |
| Nicaragua | 104 | 0.3% |
| Northern Africa | 35 | 0.1% |
| Northern Europe | 601 | 1.8% |
| Oceania | 433 | 1.3% |
| Pakistan | 46 | 0.1% |
| Panama | 25 | 0.1% |
| Peru | 136 | 0.4% |
| Philippines | 343 | 1.0% |
| Poland | 237 | 0.7% |
| Romania | 30 | 0.1% |
| Russia | 140 | 0.4% |
| Serbia | 36 | 0.1% |
| Singapore | 46 | 0.1% |
| South Africa | 18 | 0.1% |
| South America | 670 | 2.0% |
| South Central Asia | 993 | 3.0% |
| South Eastern Asia | 442 | 1.3% |
| Southern Europe | 329 | 1.0% |
| Spain | 65 | 0.2% |
| Sweden | 128 | 0.4% |
| Switzerland | 71 | 0.2% |
| Taiwan | 198 | 0.6% |
| Thailand | 7 | 0.0% |
| Turkey | 96 | 0.3% |
| Ukraine | 114 | 0.3% |
| Uzbekistan | 16 | 0.1% |
| Venezuela | 57 | 0.2% |
| Vietnam | 14 | 0.0% |
| Western Africa | 16 | 0.1% |
| Western Asia | 515 | 1.5% |
| Western Europe | 555 | 1.7% |
| Zimbabwe | 9 | 0.0% | View All 85 Rows |
Sex and Age in Menlo Park
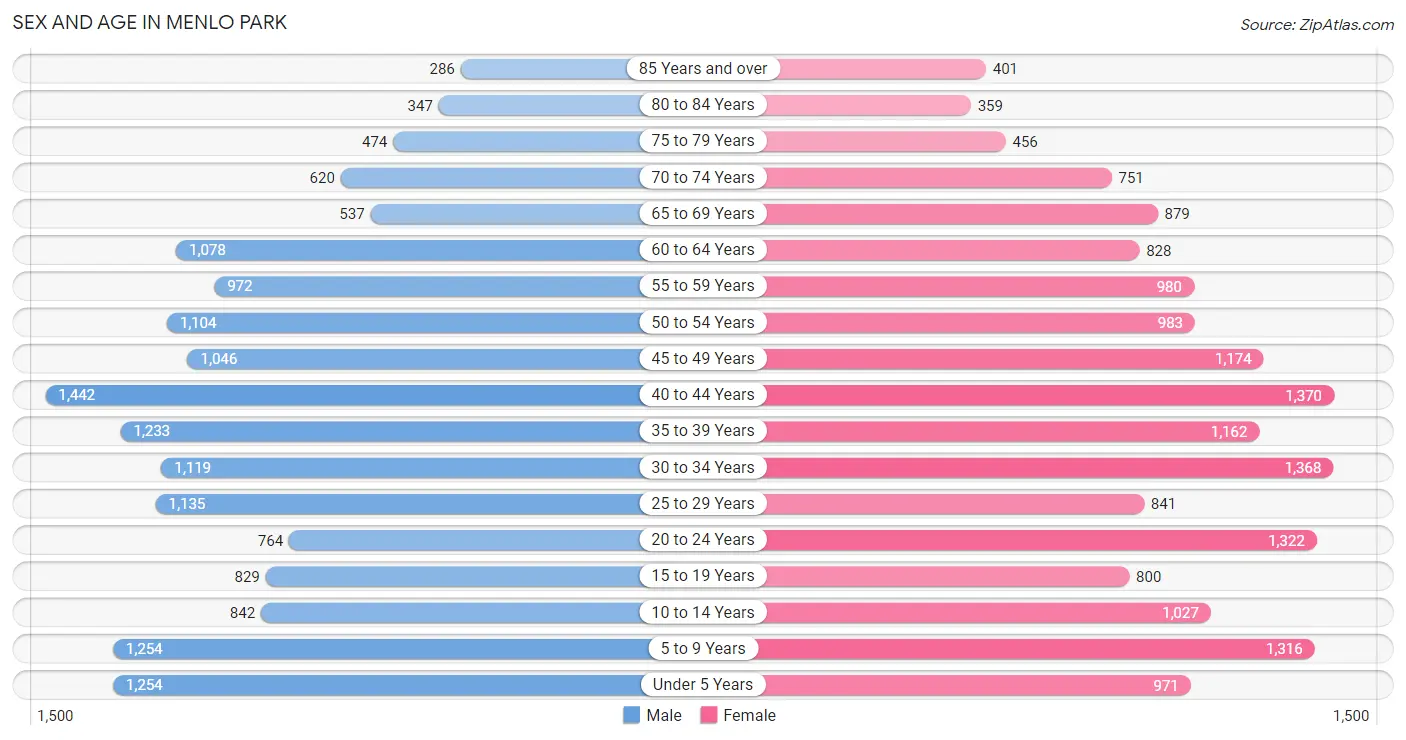
Sex and Age in Menlo Park
The most populous age groups in Menlo Park are 40 to 44 Years (1,442 | 8.8%) for men and 40 to 44 Years (1,370 | 8.1%) for women.
| Age Bracket | Male | Female |
| Under 5 Years | 1,254 (7.7%) | 971 (5.7%) |
| 5 to 9 Years | 1,254 (7.7%) | 1,316 (7.7%) |
| 10 to 14 Years | 842 (5.1%) | 1,027 (6.0%) |
| 15 to 19 Years | 829 (5.1%) | 800 (4.7%) |
| 20 to 24 Years | 764 (4.7%) | 1,322 (7.8%) |
| 25 to 29 Years | 1,135 (7.0%) | 841 (5.0%) |
| 30 to 34 Years | 1,119 (6.9%) | 1,368 (8.1%) |
| 35 to 39 Years | 1,233 (7.5%) | 1,162 (6.8%) |
| 40 to 44 Years | 1,442 (8.8%) | 1,370 (8.1%) |
| 45 to 49 Years | 1,046 (6.4%) | 1,174 (6.9%) |
| 50 to 54 Years | 1,104 (6.8%) | 983 (5.8%) |
| 55 to 59 Years | 972 (5.9%) | 980 (5.8%) |
| 60 to 64 Years | 1,078 (6.6%) | 828 (4.9%) |
| 65 to 69 Years | 537 (3.3%) | 879 (5.2%) |
| 70 to 74 Years | 620 (3.8%) | 751 (4.4%) |
| 75 to 79 Years | 474 (2.9%) | 456 (2.7%) |
| 80 to 84 Years | 347 (2.1%) | 359 (2.1%) |
| 85 Years and over | 286 (1.8%) | 401 (2.4%) |
| Total | 16,336 (100.0%) | 16,988 (100.0%) |
Families and Households in Menlo Park
Median Family Size in Menlo Park
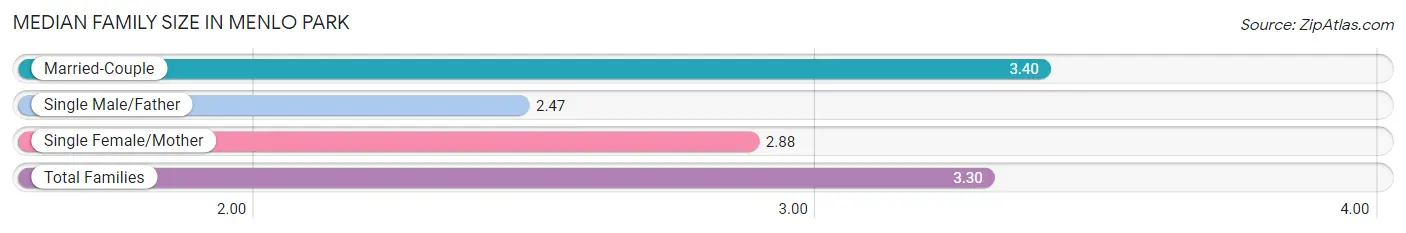
The median family size in Menlo Park is 3.30 persons per family, with married-couple families (6,514 | 83.5%) accounting for the largest median family size of 3.4 persons per family. On the other hand, single male/father families (322 | 4.1%) represent the smallest median family size with 2.47 persons per family.
| Family Type | # Families | Family Size |
| Married-Couple | 6,514 (83.5%) | 3.40 |
| Single Male/Father | 322 (4.1%) | 2.47 |
| Single Female/Mother | 966 (12.4%) | 2.88 |
| Total Families | 7,802 (100.0%) | 3.30 |
Median Household Size in Menlo Park
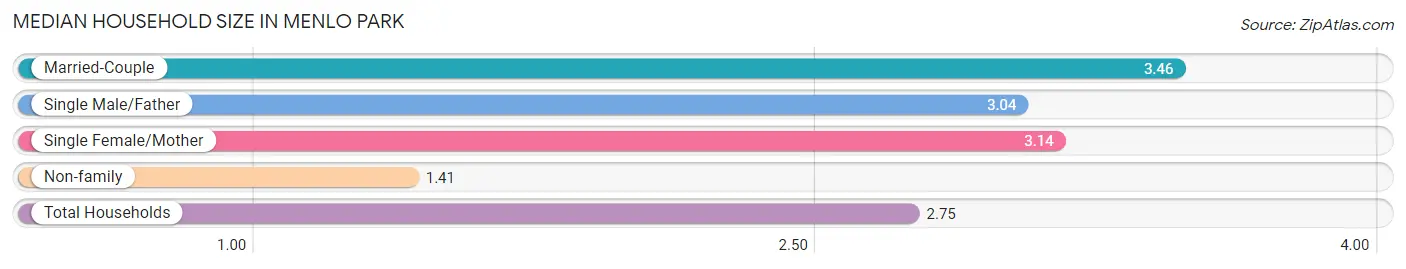
The median household size in Menlo Park is 2.75 persons per household, with married-couple households (6,514 | 55.9%) accounting for the largest median household size of 3.46 persons per household. non-family households (3,859 | 33.1%) represent the smallest median household size with 1.41 persons per household.
| Household Type | # Households | Household Size |
| Married-Couple | 6,514 (55.9%) | 3.46 |
| Single Male/Father | 322 (2.8%) | 3.04 |
| Single Female/Mother | 966 (8.3%) | 3.14 |
| Non-family | 3,859 (33.1%) | 1.41 |
| Total Households | 11,661 (100.0%) | 2.75 |
Household Size by Marriage Status in Menlo Park
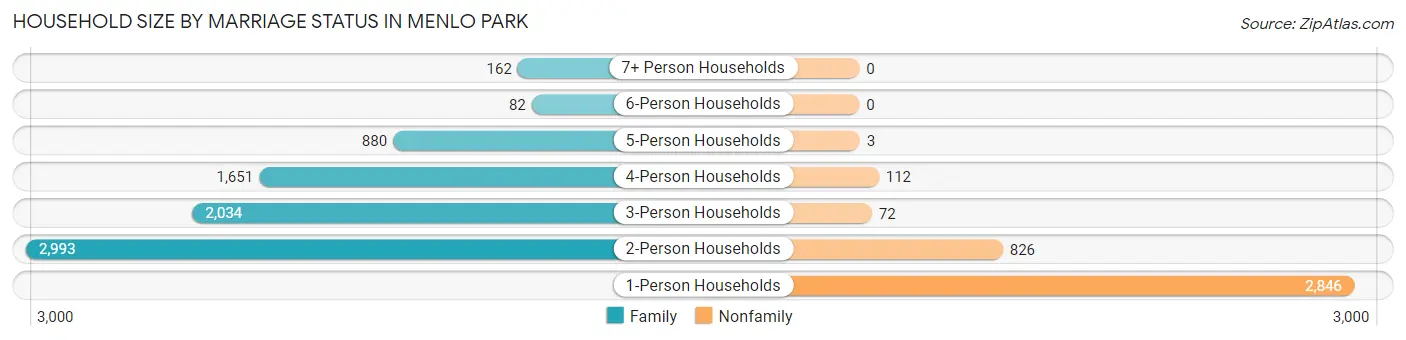
Out of a total of 11,661 households in Menlo Park, 7,802 (66.9%) are family households, while 3,859 (33.1%) are nonfamily households. The most numerous type of family households are 2-person households, comprising 2,993, and the most common type of nonfamily households are 1-person households, comprising 2,846.
| Household Size | Family Households | Nonfamily Households |
| 1-Person Households | - | 2,846 (24.4%) |
| 2-Person Households | 2,993 (25.7%) | 826 (7.1%) |
| 3-Person Households | 2,034 (17.4%) | 72 (0.6%) |
| 4-Person Households | 1,651 (14.2%) | 112 (1.0%) |
| 5-Person Households | 880 (7.5%) | 3 (0.0%) |
| 6-Person Households | 82 (0.7%) | 0 (0.0%) |
| 7+ Person Households | 162 (1.4%) | 0 (0.0%) |
| Total | 7,802 (66.9%) | 3,859 (33.1%) |
Female Fertility in Menlo Park
Fertility by Age in Menlo Park
Average fertility rate in Menlo Park is 56.0 births per 1,000 women. Women in the age bracket of 35 to 50 years have the highest fertility rate with 84.0 births per 1,000 women. Women in the age bracket of 35 to 50 years acount for 71.6% of all women with births.
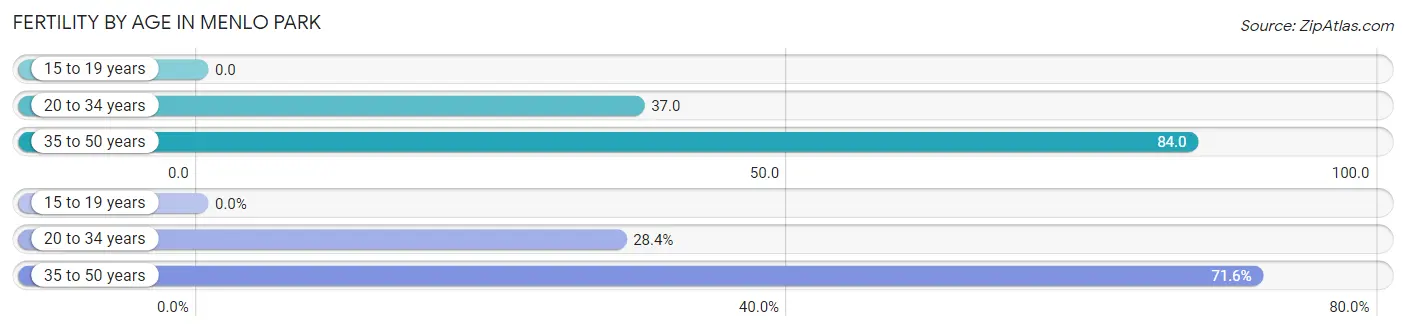
| Age Bracket | Women with Births | Births / 1,000 Women |
| 15 to 19 years | 0 (0.0%) | 0.0 |
| 20 to 34 years | 130 (28.4%) | 37.0 |
| 35 to 50 years | 328 (71.6%) | 84.0 |
| Total | 458 (100.0%) | 56.0 |
Fertility by Age by Marriage Status in Menlo Park
90.4% of women with births (458) in Menlo Park are married. The highest percentage of unmarried women with births falls into 20 to 34 years age bracket with 14.6% of them unmarried at the time of birth, while the lowest percentage of unmarried women with births belong to 35 to 50 years age bracket with 7.6% of them unmarried.
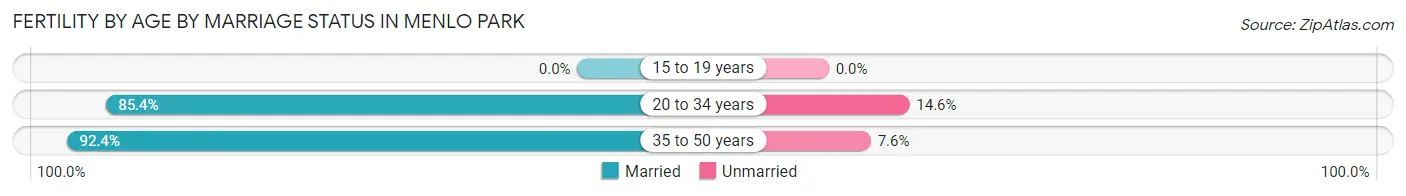
| Age Bracket | Married | Unmarried |
| 15 to 19 years | 0 (0.0%) | 0 (0.0%) |
| 20 to 34 years | 111 (85.4%) | 19 (14.6%) |
| 35 to 50 years | 303 (92.4%) | 25 (7.6%) |
| Total | 414 (90.4%) | 44 (9.6%) |
Fertility by Education in Menlo Park
Average fertility rate in Menlo Park is 56.0 births per 1,000 women. Women with the education attainment of graduate degree have the highest fertility rate of 71.0 births per 1,000 women, while women with the education attainment of less than high school have the lowest fertility at 26.0 births per 1,000 women. Women with the education attainment of graduate degree represent 53.3% of all women with births.
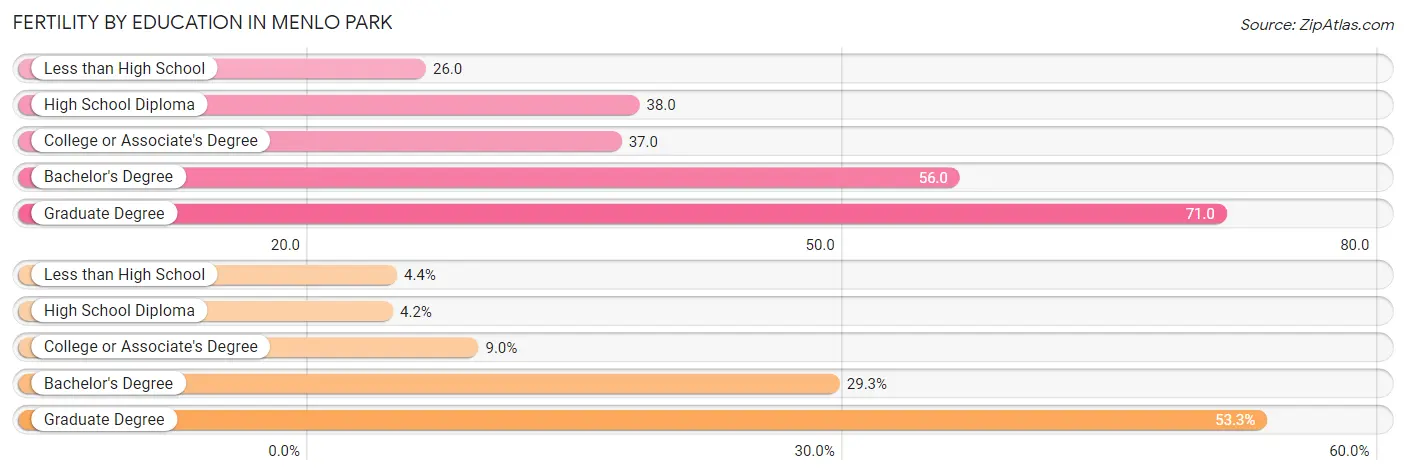
| Educational Attainment | Women with Births | Births / 1,000 Women |
| Less than High School | 20 (4.4%) | 26.0 |
| High School Diploma | 19 (4.2%) | 38.0 |
| College or Associate's Degree | 41 (8.9%) | 37.0 |
| Bachelor's Degree | 134 (29.3%) | 56.0 |
| Graduate Degree | 244 (53.3%) | 71.0 |
| Total | 458 (100.0%) | 56.0 |
Fertility by Education by Marriage Status in Menlo Park
9.6% of women with births in Menlo Park are unmarried. Women with the educational attainment of high school diploma are most likely to be married with 100.0% of them married at childbirth, while women with the educational attainment of less than high school are least likely to be married with 100.0% of them unmarried at childbirth.
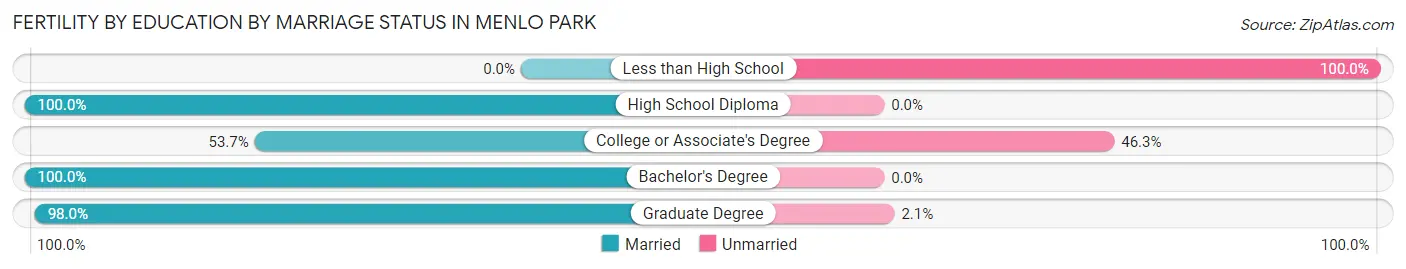
| Educational Attainment | Married | Unmarried |
| Less than High School | 0 (0.0%) | 20 (100.0%) |
| High School Diploma | 19 (100.0%) | 0 (0.0%) |
| College or Associate's Degree | 22 (53.7%) | 19 (46.3%) |
| Bachelor's Degree | 134 (100.0%) | 0 (0.0%) |
| Graduate Degree | 239 (98.0%) | 5 (2.1%) |
| Total | 414 (90.4%) | 44 (9.6%) |
Employment Characteristics in Menlo Park
Employment by Class of Employer in Menlo Park
Among the 16,231 employed individuals in Menlo Park, private company employees (11,018 | 67.9%), not-for-profit organizations (2,348 | 14.5%), and self-employed (not incorporated) (982 | 6.0%) make up the most common classes of employment.
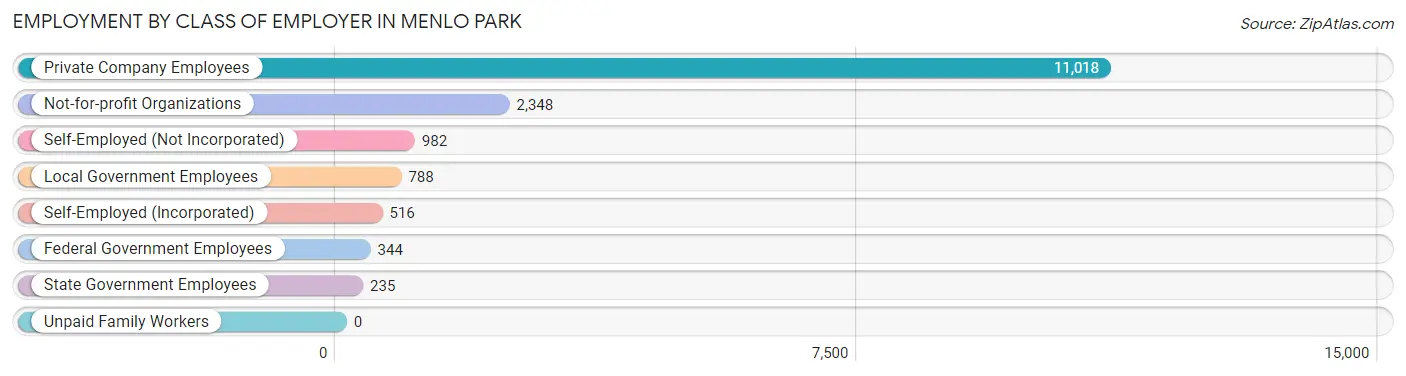
| Employer Class | # Employees | % Employees |
| Private Company Employees | 11,018 | 67.9% |
| Self-Employed (Incorporated) | 516 | 3.2% |
| Self-Employed (Not Incorporated) | 982 | 6.0% |
| Not-for-profit Organizations | 2,348 | 14.5% |
| Local Government Employees | 788 | 4.9% |
| State Government Employees | 235 | 1.5% |
| Federal Government Employees | 344 | 2.1% |
| Unpaid Family Workers | 0 | 0.0% |
| Total | 16,231 | 100.0% |
Employment Status by Age in Menlo Park
According to the labor force statistics for Menlo Park, out of the total population over 16 years of age (26,374), 65.6% or 17,301 individuals are in the labor force, with 4.3% or 744 of them unemployed. The age group with the highest labor force participation rate is 30 to 34 years, with 91.0% or 2,263 individuals in the labor force. Within the labor force, the 20 to 24 years age range has the highest percentage of unemployed individuals, with 7.9% or 125 of them being unemployed.
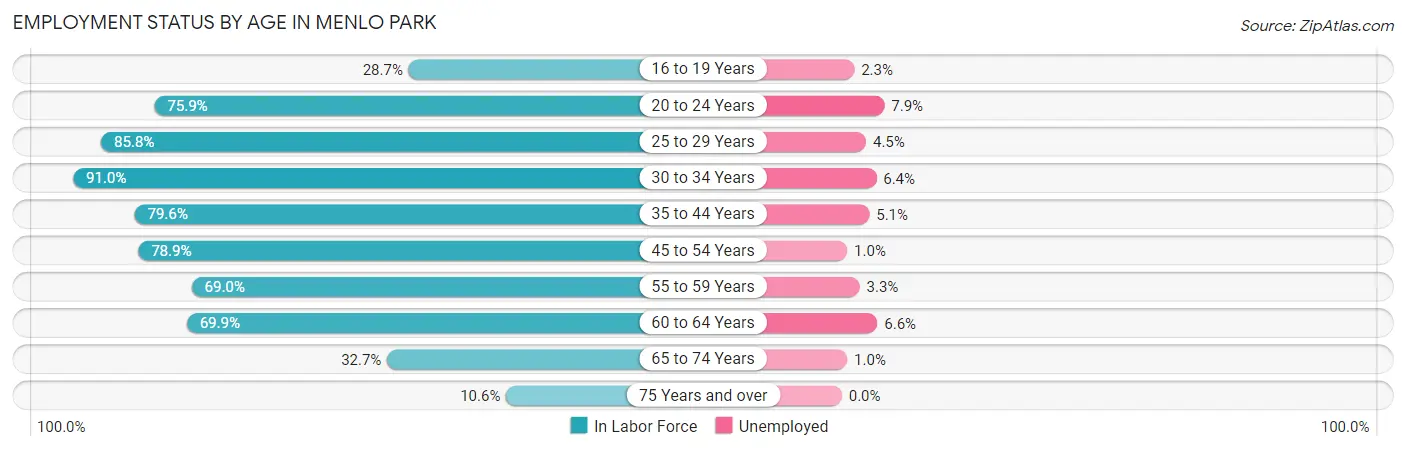
| Age Bracket | In Labor Force | Unemployed |
| 16 to 19 Years | 385 (28.7%) | 9 (2.3%) |
| 20 to 24 Years | 1,583 (75.9%) | 125 (7.9%) |
| 25 to 29 Years | 1,695 (85.8%) | 76 (4.5%) |
| 30 to 34 Years | 2,263 (91.0%) | 145 (6.4%) |
| 35 to 44 Years | 4,145 (79.6%) | 211 (5.1%) |
| 45 to 54 Years | 3,398 (78.9%) | 34 (1.0%) |
| 55 to 59 Years | 1,347 (69.0%) | 44 (3.3%) |
| 60 to 64 Years | 1,332 (69.9%) | 88 (6.6%) |
| 65 to 74 Years | 911 (32.7%) | 9 (1.0%) |
| 75 Years and over | 246 (10.6%) | 0 (0.0%) |
| Total | 17,301 (65.6%) | 744 (4.3%) |
Employment Status by Educational Attainment in Menlo Park
According to labor force statistics for Menlo Park, 79.5% of individuals (14,179) out of the total population between 25 and 64 years of age (17,835) are in the labor force, with 4.2% or 596 of them being unemployed. The group with the highest labor force participation rate are those with the educational attainment of bachelor's degree or higher, with 83.2% or 10,913 individuals in the labor force. Within the labor force, individuals with high school diploma education have the highest percentage of unemployment, with 13.7% or 135 of them being unemployed.
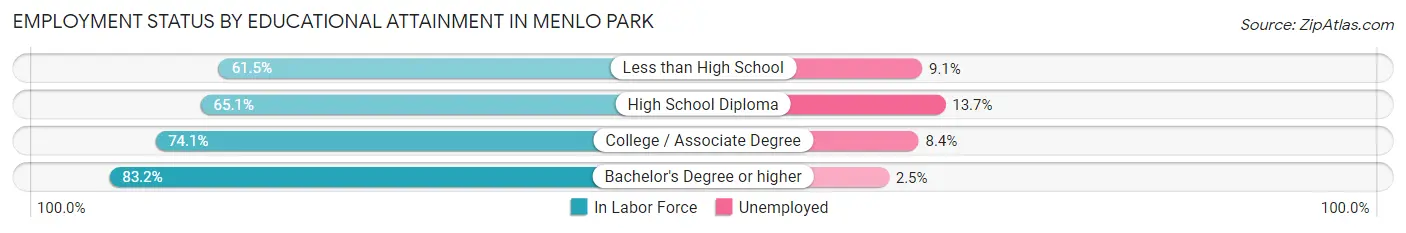
| Educational Attainment | In Labor Force | Unemployed |
| Less than High School | 463 (61.5%) | 69 (9.1%) |
| High School Diploma | 985 (65.1%) | 207 (13.7%) |
| College / Associate Degree | 1,818 (74.1%) | 206 (8.4%) |
| Bachelor's Degree or higher | 10,913 (83.2%) | 328 (2.5%) |
| Total | 14,179 (79.5%) | 749 (4.2%) |
Employment Occupations by Sex in Menlo Park
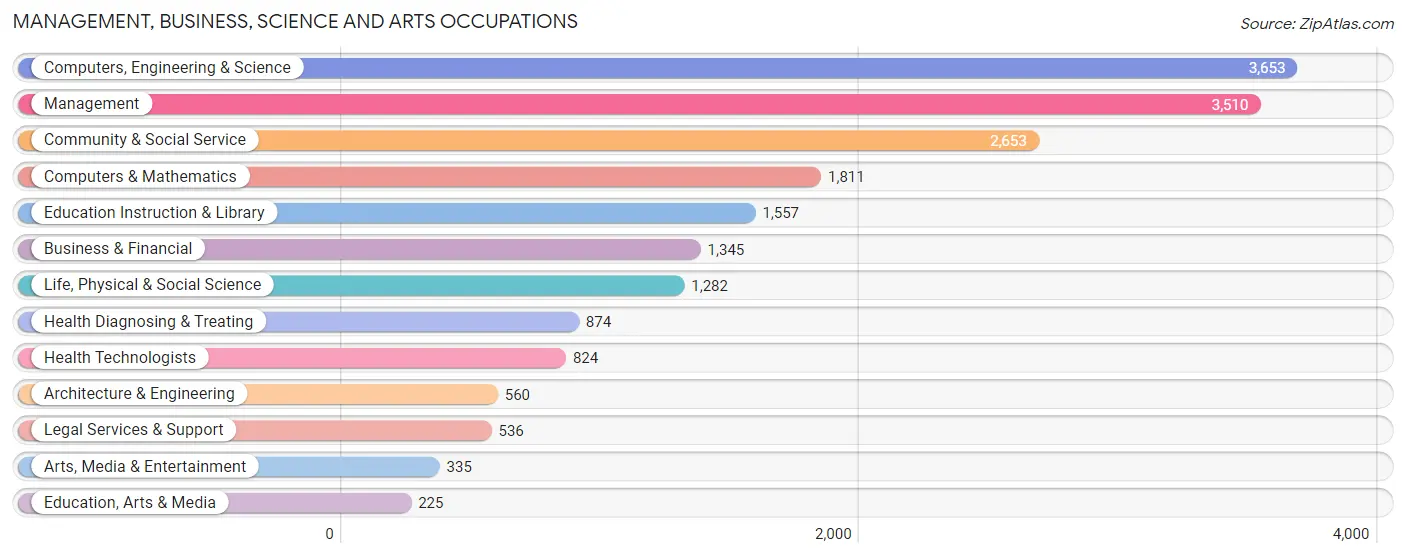
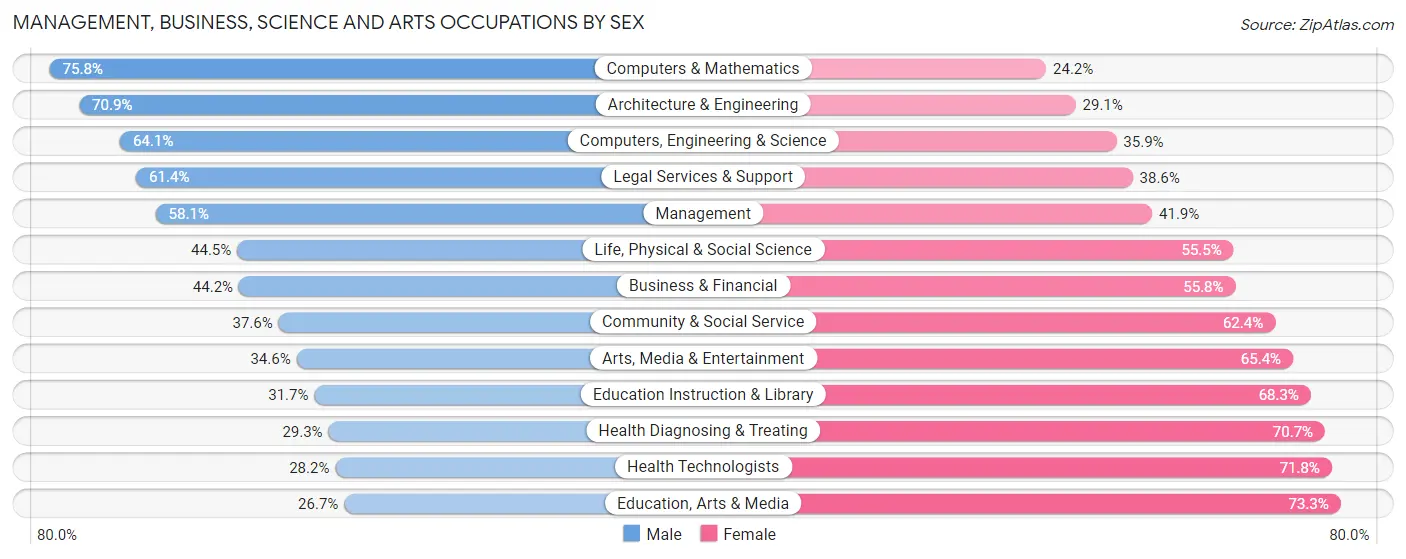
Management, Business, Science and Arts Occupations
The most common Management, Business, Science and Arts occupations in Menlo Park are Computers, Engineering & Science (3,653 | 22.1%), Management (3,510 | 21.2%), Community & Social Service (2,653 | 16.0%), Computers & Mathematics (1,811 | 10.9%), and Education Instruction & Library (1,557 | 9.4%).
Management, Business, Science and Arts Occupations by Sex
Within the Management, Business, Science and Arts occupations in Menlo Park, the most male-oriented occupations are Computers & Mathematics (75.8%), Architecture & Engineering (70.9%), and Computers, Engineering & Science (64.1%), while the most female-oriented occupations are Education, Arts & Media (73.3%), Health Technologists (71.8%), and Health Diagnosing & Treating (70.7%).
| Occupation | Male | Female |
| Management | 2,040 (58.1%) | 1,470 (41.9%) |
| Business & Financial | 595 (44.2%) | 750 (55.8%) |
| Computers, Engineering & Science | 2,341 (64.1%) | 1,312 (35.9%) |
| Computers & Mathematics | 1,373 (75.8%) | 438 (24.2%) |
| Architecture & Engineering | 397 (70.9%) | 163 (29.1%) |
| Life, Physical & Social Science | 571 (44.5%) | 711 (55.5%) |
| Community & Social Service | 998 (37.6%) | 1,655 (62.4%) |
| Education, Arts & Media | 60 (26.7%) | 165 (73.3%) |
| Legal Services & Support | 329 (61.4%) | 207 (38.6%) |
| Education Instruction & Library | 493 (31.7%) | 1,064 (68.3%) |
| Arts, Media & Entertainment | 116 (34.6%) | 219 (65.4%) |
| Health Diagnosing & Treating | 256 (29.3%) | 618 (70.7%) |
| Health Technologists | 232 (28.2%) | 592 (71.8%) |
| Total (Category) | 6,230 (51.8%) | 5,805 (48.2%) |
| Total (Overall) | 9,037 (54.5%) | 7,533 (45.5%) |
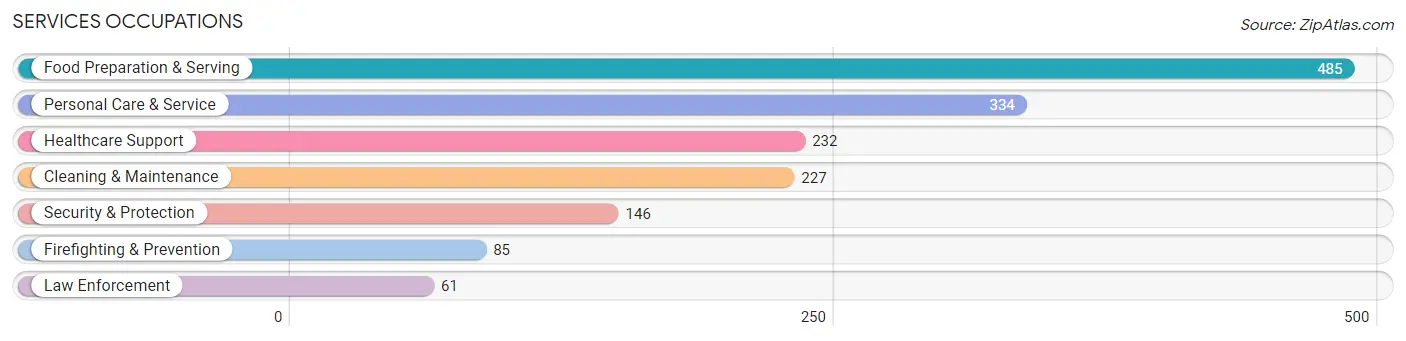
Services Occupations
The most common Services occupations in Menlo Park are Food Preparation & Serving (485 | 2.9%), Personal Care & Service (334 | 2.0%), Healthcare Support (232 | 1.4%), Cleaning & Maintenance (227 | 1.4%), and Security & Protection (146 | 0.9%).
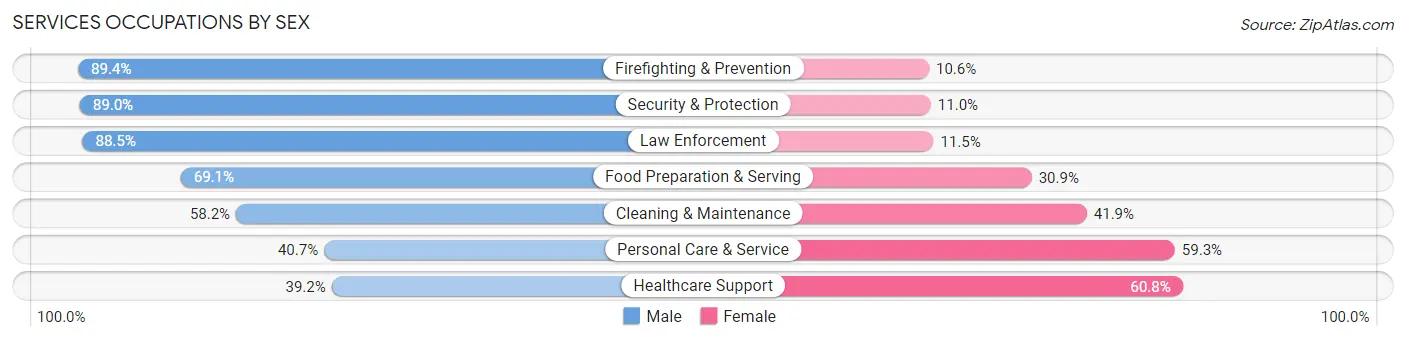
Services Occupations by Sex
Within the Services occupations in Menlo Park, the most male-oriented occupations are Firefighting & Prevention (89.4%), Security & Protection (89.0%), and Law Enforcement (88.5%), while the most female-oriented occupations are Healthcare Support (60.8%), Personal Care & Service (59.3%), and Cleaning & Maintenance (41.8%).
| Occupation | Male | Female |
| Healthcare Support | 91 (39.2%) | 141 (60.8%) |
| Security & Protection | 130 (89.0%) | 16 (11.0%) |
| Firefighting & Prevention | 76 (89.4%) | 9 (10.6%) |
| Law Enforcement | 54 (88.5%) | 7 (11.5%) |
| Food Preparation & Serving | 335 (69.1%) | 150 (30.9%) |
| Cleaning & Maintenance | 132 (58.2%) | 95 (41.8%) |
| Personal Care & Service | 136 (40.7%) | 198 (59.3%) |
| Total (Category) | 824 (57.9%) | 600 (42.1%) |
| Total (Overall) | 9,037 (54.5%) | 7,533 (45.5%) |
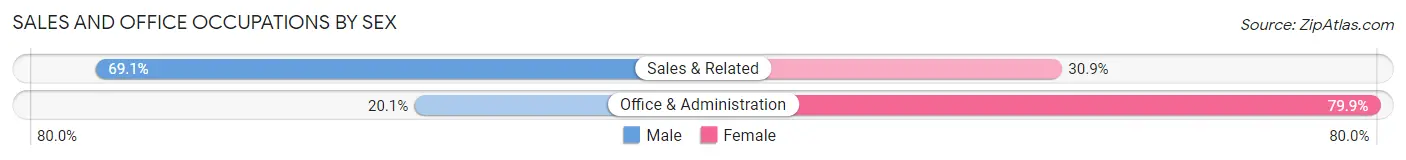
Sales and Office Occupations
The most common Sales and Office occupations in Menlo Park are Sales & Related (1,372 | 8.3%), and Office & Administration (772 | 4.7%).

Sales and Office Occupations by Sex
| Occupation | Male | Female |
| Sales & Related | 948 (69.1%) | 424 (30.9%) |
| Office & Administration | 155 (20.1%) | 617 (79.9%) |
| Total (Category) | 1,103 (51.4%) | 1,041 (48.5%) |
| Total (Overall) | 9,037 (54.5%) | 7,533 (45.5%) |
Natural Resources, Construction and Maintenance Occupations
The most common Natural Resources, Construction and Maintenance occupations in Menlo Park are Construction & Extraction (339 | 2.1%), Installation, Maintenance & Repair (153 | 0.9%), and Farming, Fishing & Forestry (26 | 0.2%).
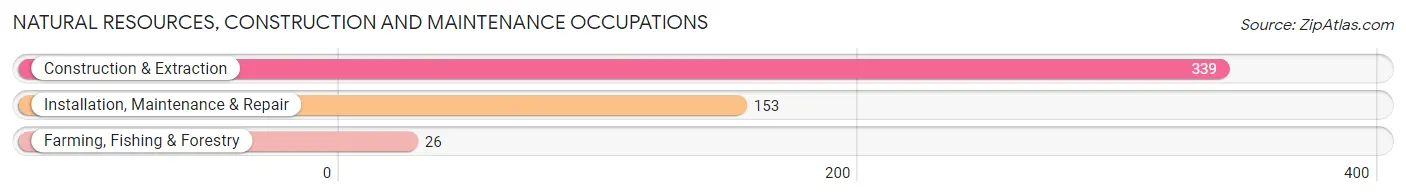
Natural Resources, Construction and Maintenance Occupations by Sex
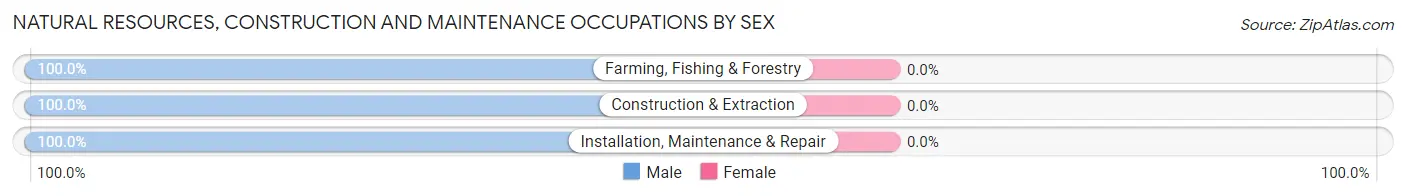
| Occupation | Male | Female |
| Farming, Fishing & Forestry | 26 (100.0%) | 0 (0.0%) |
| Construction & Extraction | 339 (100.0%) | 0 (0.0%) |
| Installation, Maintenance & Repair | 153 (100.0%) | 0 (0.0%) |
| Total (Category) | 518 (100.0%) | 0 (0.0%) |
| Total (Overall) | 9,037 (54.5%) | 7,533 (45.5%) |
Production, Transportation and Moving Occupations
The most common Production, Transportation and Moving occupations in Menlo Park are Transportation (209 | 1.3%), Production (154 | 0.9%), and Material Moving (86 | 0.5%).
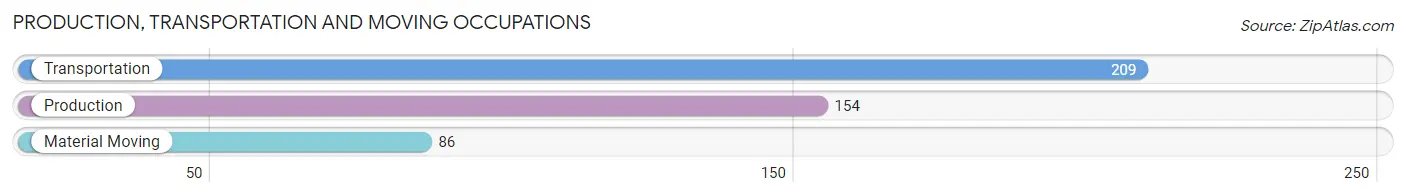
Production, Transportation and Moving Occupations by Sex
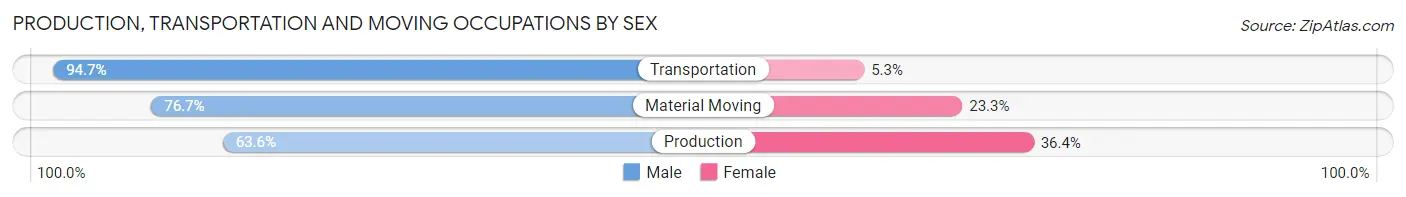
| Occupation | Male | Female |
| Production | 98 (63.6%) | 56 (36.4%) |
| Transportation | 198 (94.7%) | 11 (5.3%) |
| Material Moving | 66 (76.7%) | 20 (23.3%) |
| Total (Category) | 362 (80.6%) | 87 (19.4%) |
| Total (Overall) | 9,037 (54.5%) | 7,533 (45.5%) |
Employment Industries by Sex in Menlo Park
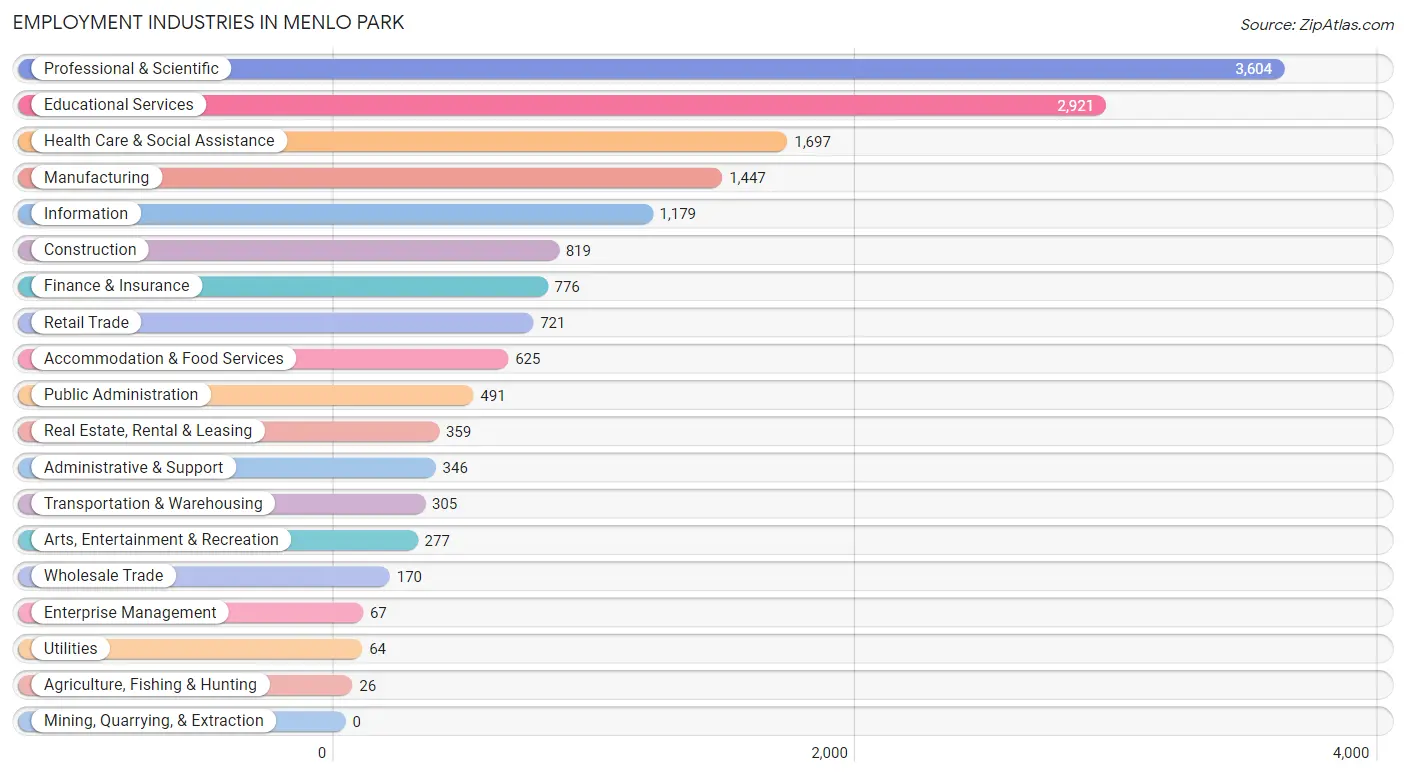
Employment Industries in Menlo Park
The major employment industries in Menlo Park include Professional & Scientific (3,604 | 21.7%), Educational Services (2,921 | 17.6%), Health Care & Social Assistance (1,697 | 10.2%), Manufacturing (1,447 | 8.7%), and Information (1,179 | 7.1%).
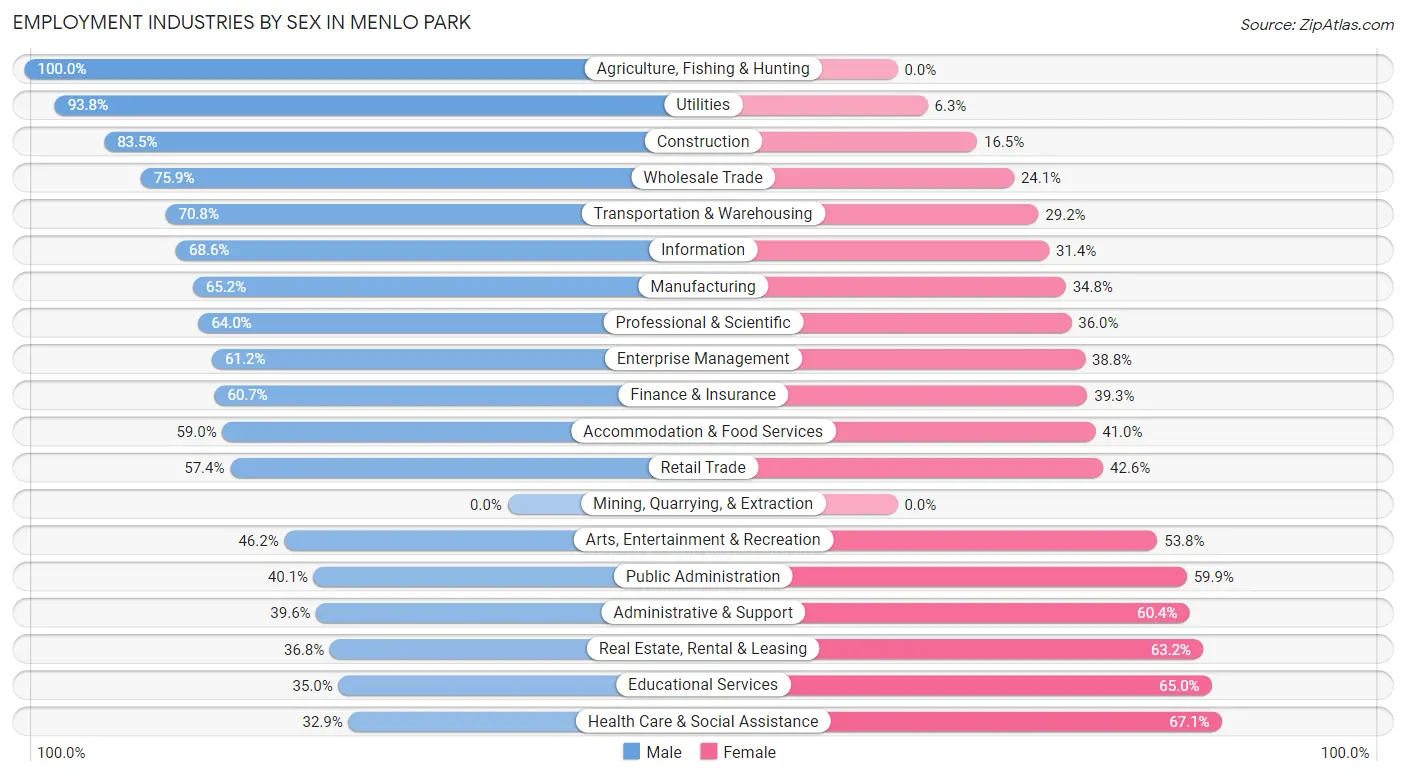
Employment Industries by Sex in Menlo Park
The Menlo Park industries that see more men than women are Agriculture, Fishing & Hunting (100.0%), Utilities (93.8%), and Construction (83.5%), whereas the industries that tend to have a higher number of women are Health Care & Social Assistance (67.1%), Educational Services (65.0%), and Real Estate, Rental & Leasing (63.2%).
| Industry | Male | Female |
| Agriculture, Fishing & Hunting | 26 (100.0%) | 0 (0.0%) |
| Mining, Quarrying, & Extraction | 0 (0.0%) | 0 (0.0%) |
| Construction | 684 (83.5%) | 135 (16.5%) |
| Manufacturing | 943 (65.2%) | 504 (34.8%) |
| Wholesale Trade | 129 (75.9%) | 41 (24.1%) |
| Retail Trade | 414 (57.4%) | 307 (42.6%) |
| Transportation & Warehousing | 216 (70.8%) | 89 (29.2%) |
| Utilities | 60 (93.8%) | 4 (6.2%) |
| Information | 809 (68.6%) | 370 (31.4%) |
| Finance & Insurance | 471 (60.7%) | 305 (39.3%) |
| Real Estate, Rental & Leasing | 132 (36.8%) | 227 (63.2%) |
| Professional & Scientific | 2,307 (64.0%) | 1,297 (36.0%) |
| Enterprise Management | 41 (61.2%) | 26 (38.8%) |
| Administrative & Support | 137 (39.6%) | 209 (60.4%) |
| Educational Services | 1,023 (35.0%) | 1,898 (65.0%) |
| Health Care & Social Assistance | 559 (32.9%) | 1,138 (67.1%) |
| Arts, Entertainment & Recreation | 128 (46.2%) | 149 (53.8%) |
| Accommodation & Food Services | 369 (59.0%) | 256 (41.0%) |
| Public Administration | 197 (40.1%) | 294 (59.9%) |
| Total | 9,037 (54.5%) | 7,533 (45.5%) |
Education in Menlo Park
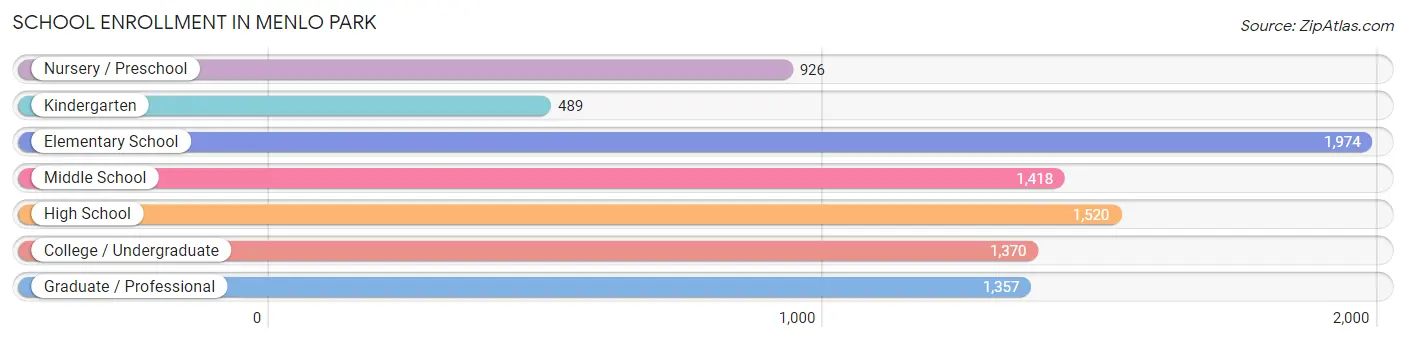
School Enrollment in Menlo Park
The most common levels of schooling among the 9,054 students in Menlo Park are elementary school (1,974 | 21.8%), high school (1,520 | 16.8%), and middle school (1,418 | 15.7%).
| School Level | # Students | % Students |
| Nursery / Preschool | 926 | 10.2% |
| Kindergarten | 489 | 5.4% |
| Elementary School | 1,974 | 21.8% |
| Middle School | 1,418 | 15.7% |
| High School | 1,520 | 16.8% |
| College / Undergraduate | 1,370 | 15.1% |
| Graduate / Professional | 1,357 | 15.0% |
| Total | 9,054 | 100.0% |
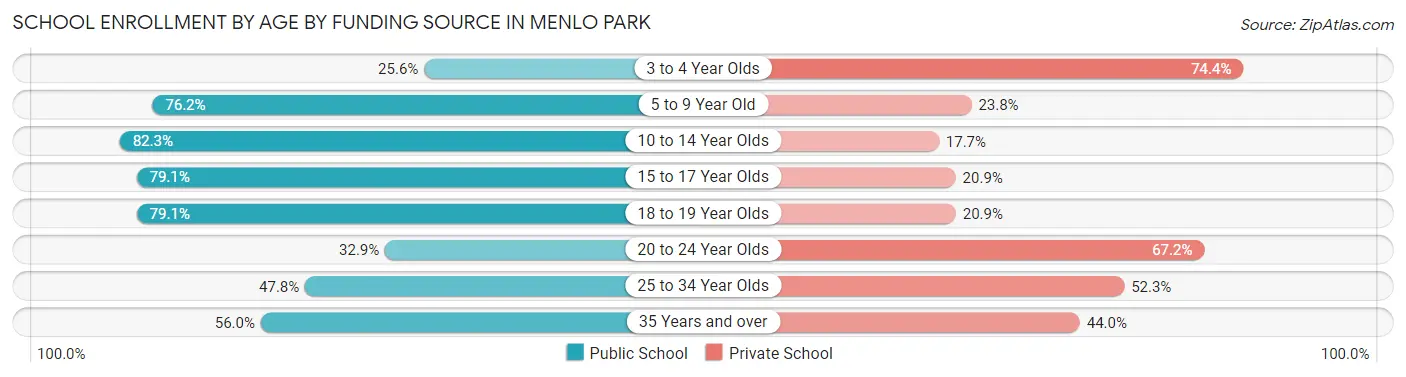
School Enrollment by Age by Funding Source in Menlo Park
Out of a total of 9,054 students who are enrolled in schools in Menlo Park, 3,178 (35.1%) attend a private institution, while the remaining 5,876 (64.9%) are enrolled in public schools. The age group of 3 to 4 year olds has the highest likelihood of being enrolled in private schools, with 509 (74.4% in the age bracket) enrolled. Conversely, the age group of 10 to 14 year olds has the lowest likelihood of being enrolled in a private school, with 1,508 (82.3% in the age bracket) attending a public institution.
| Age Bracket | Public School | Private School |
| 3 to 4 Year Olds | 175 (25.6%) | 509 (74.4%) |
| 5 to 9 Year Old | 1,934 (76.2%) | 604 (23.8%) |
| 10 to 14 Year Olds | 1,508 (82.3%) | 325 (17.7%) |
| 15 to 17 Year Olds | 751 (79.1%) | 198 (20.9%) |
| 18 to 19 Year Olds | 470 (79.1%) | 124 (20.9%) |
| 20 to 24 Year Olds | 409 (32.9%) | 836 (67.1%) |
| 25 to 34 Year Olds | 308 (47.7%) | 337 (52.2%) |
| 35 Years and over | 317 (56.0%) | 249 (44.0%) |
| Total | 5,876 (64.9%) | 3,178 (35.1%) |
Educational Attainment by Field of Study in Menlo Park
Engineering (2,715 | 15.0%), social sciences (2,273 | 12.6%), business (2,022 | 11.2%), bio, nature & agricultural (1,915 | 10.6%), and computers & mathematics (1,800 | 10.0%) are the most common fields of study among 18,096 individuals in Menlo Park who have obtained a bachelor's degree or higher.
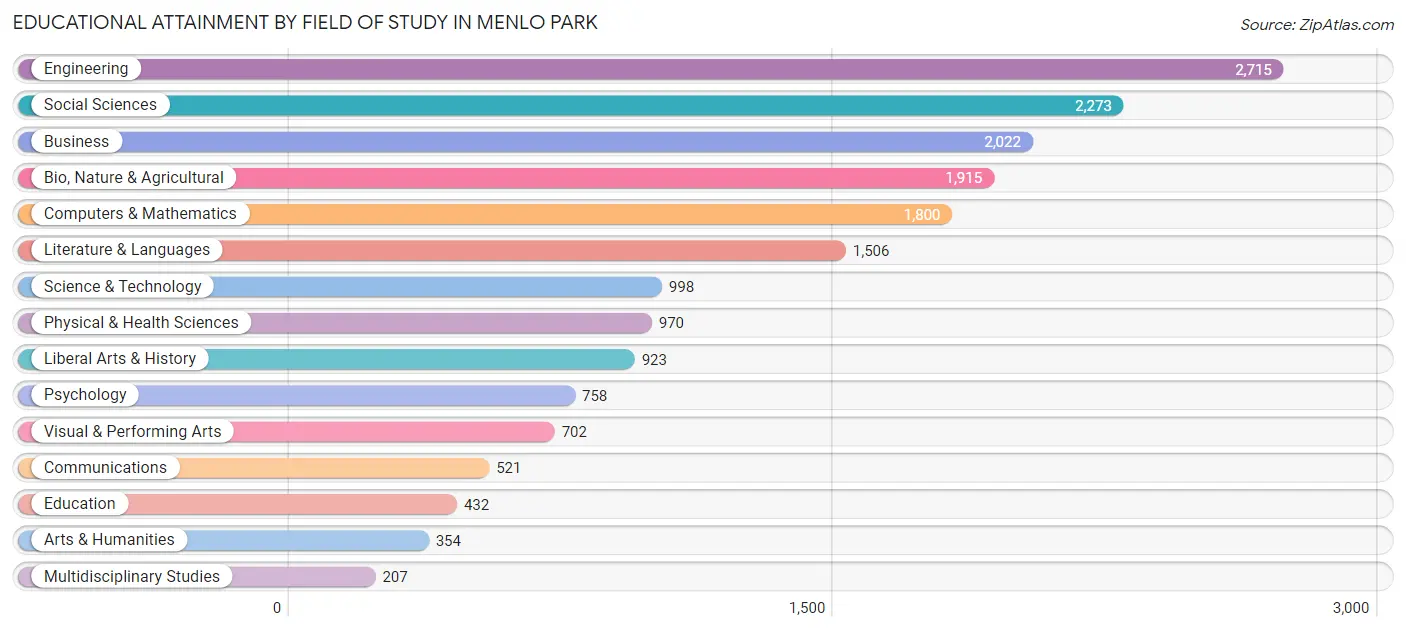
| Field of Study | # Graduates | % Graduates |
| Computers & Mathematics | 1,800 | 10.0% |
| Bio, Nature & Agricultural | 1,915 | 10.6% |
| Physical & Health Sciences | 970 | 5.4% |
| Psychology | 758 | 4.2% |
| Social Sciences | 2,273 | 12.6% |
| Engineering | 2,715 | 15.0% |
| Multidisciplinary Studies | 207 | 1.1% |
| Science & Technology | 998 | 5.5% |
| Business | 2,022 | 11.2% |
| Education | 432 | 2.4% |
| Literature & Languages | 1,506 | 8.3% |
| Liberal Arts & History | 923 | 5.1% |
| Visual & Performing Arts | 702 | 3.9% |
| Communications | 521 | 2.9% |
| Arts & Humanities | 354 | 2.0% |
| Total | 18,096 | 100.0% |
Transportation & Commute in Menlo Park
Vehicle Availability by Sex in Menlo Park
The most prevalent vehicle ownership categories in Menlo Park are males with 2 vehicles (3,513, accounting for 40.3%) and females with 2 vehicles (2,516, making up 48.8%).
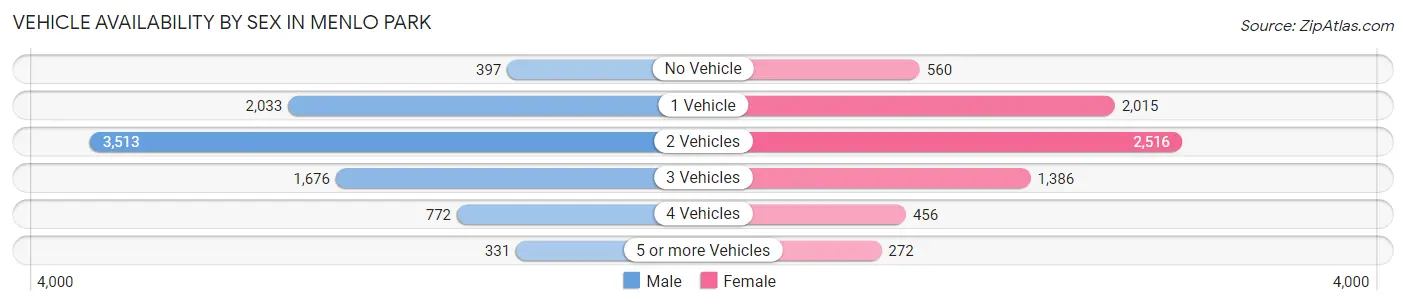
| Vehicles Available | Male | Female |
| No Vehicle | 397 (4.5%) | 560 (7.8%) |
| 1 Vehicle | 2,033 (23.3%) | 2,015 (28.0%) |
| 2 Vehicles | 3,513 (40.3%) | 2,516 (34.9%) |
| 3 Vehicles | 1,676 (19.2%) | 1,386 (19.2%) |
| 4 Vehicles | 772 (8.8%) | 456 (6.3%) |
| 5 or more Vehicles | 331 (3.8%) | 272 (3.8%) |
| Total | 8,722 (100.0%) | 7,205 (100.0%) |
Commute Time in Menlo Park
The most frequently occuring commute durations in Menlo Park are 15 to 19 minutes (2,287 commuters, 19.4%), 20 to 24 minutes (2,065 commuters, 17.5%), and 10 to 14 minutes (1,580 commuters, 13.4%).
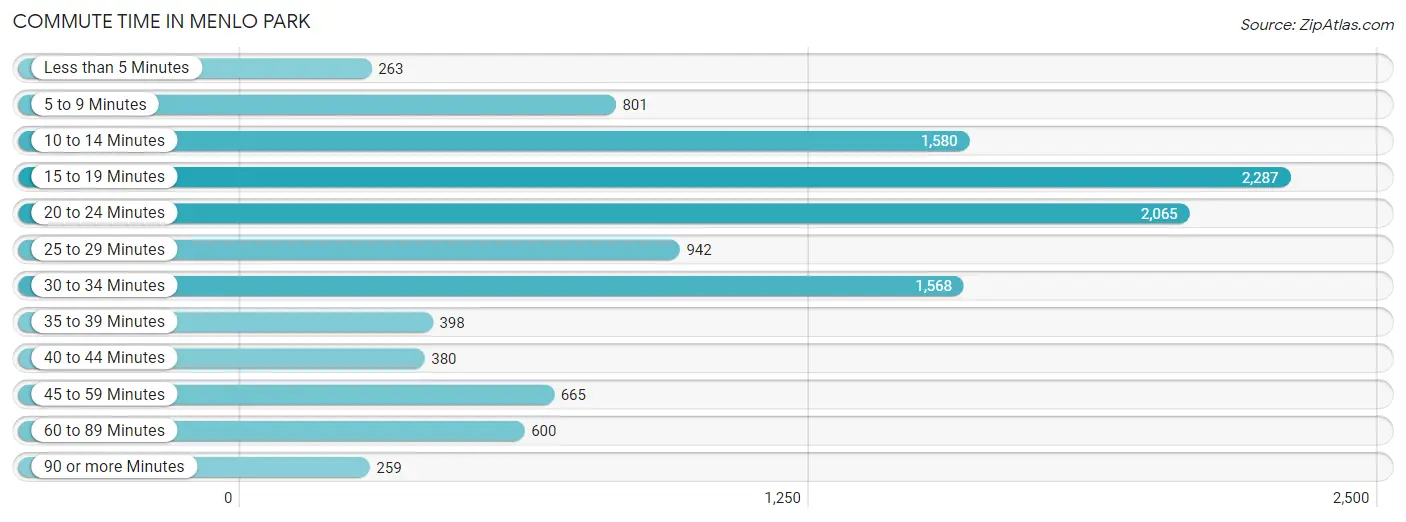
| Commute Time | # Commuters | % Commuters |
| Less than 5 Minutes | 263 | 2.2% |
| 5 to 9 Minutes | 801 | 6.8% |
| 10 to 14 Minutes | 1,580 | 13.4% |
| 15 to 19 Minutes | 2,287 | 19.4% |
| 20 to 24 Minutes | 2,065 | 17.5% |
| 25 to 29 Minutes | 942 | 8.0% |
| 30 to 34 Minutes | 1,568 | 13.3% |
| 35 to 39 Minutes | 398 | 3.4% |
| 40 to 44 Minutes | 380 | 3.2% |
| 45 to 59 Minutes | 665 | 5.6% |
| 60 to 89 Minutes | 600 | 5.1% |
| 90 or more Minutes | 259 | 2.2% |
Commute Time by Sex in Menlo Park
The most common commute times in Menlo Park are 20 to 24 minutes (1,243 commuters, 18.5%) for males and 15 to 19 minutes (1,220 commuters, 23.9%) for females.
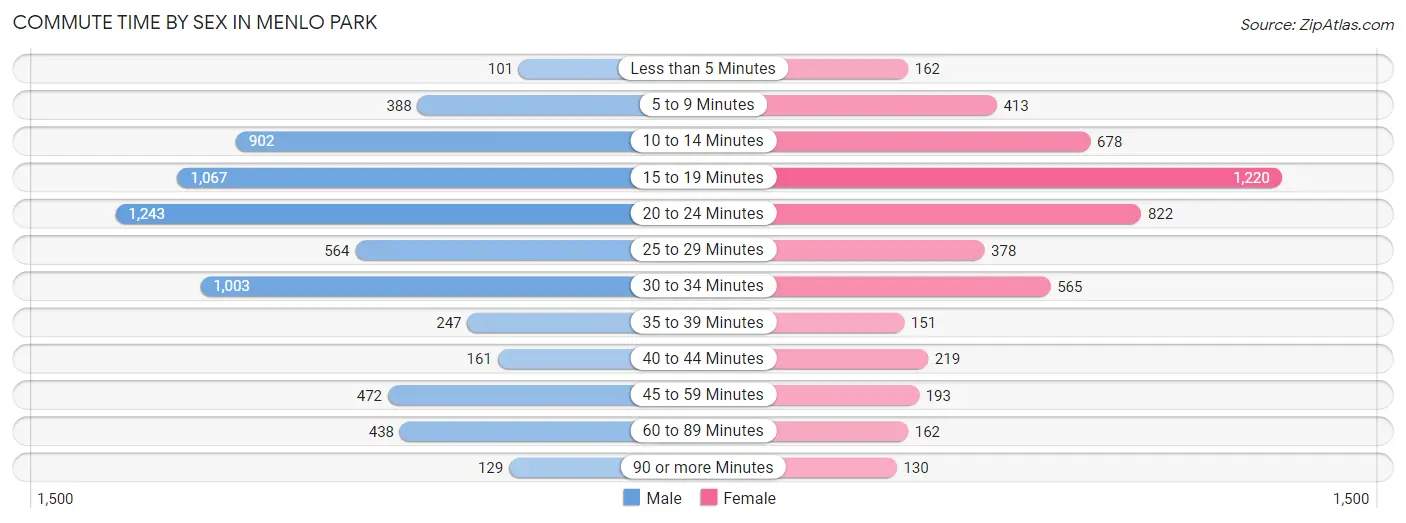
| Commute Time | Male | Female |
| Less than 5 Minutes | 101 (1.5%) | 162 (3.2%) |
| 5 to 9 Minutes | 388 (5.8%) | 413 (8.1%) |
| 10 to 14 Minutes | 902 (13.4%) | 678 (13.3%) |
| 15 to 19 Minutes | 1,067 (15.9%) | 1,220 (23.9%) |
| 20 to 24 Minutes | 1,243 (18.5%) | 822 (16.1%) |
| 25 to 29 Minutes | 564 (8.4%) | 378 (7.4%) |
| 30 to 34 Minutes | 1,003 (14.9%) | 565 (11.1%) |
| 35 to 39 Minutes | 247 (3.7%) | 151 (3.0%) |
| 40 to 44 Minutes | 161 (2.4%) | 219 (4.3%) |
| 45 to 59 Minutes | 472 (7.0%) | 193 (3.8%) |
| 60 to 89 Minutes | 438 (6.5%) | 162 (3.2%) |
| 90 or more Minutes | 129 (1.9%) | 130 (2.5%) |
Time of Departure to Work by Sex in Menlo Park
The most frequent times of departure to work in Menlo Park are 8:00 AM to 8:29 AM (1,300, 19.4%) for males and 8:00 AM to 8:29 AM (973, 19.1%) for females.
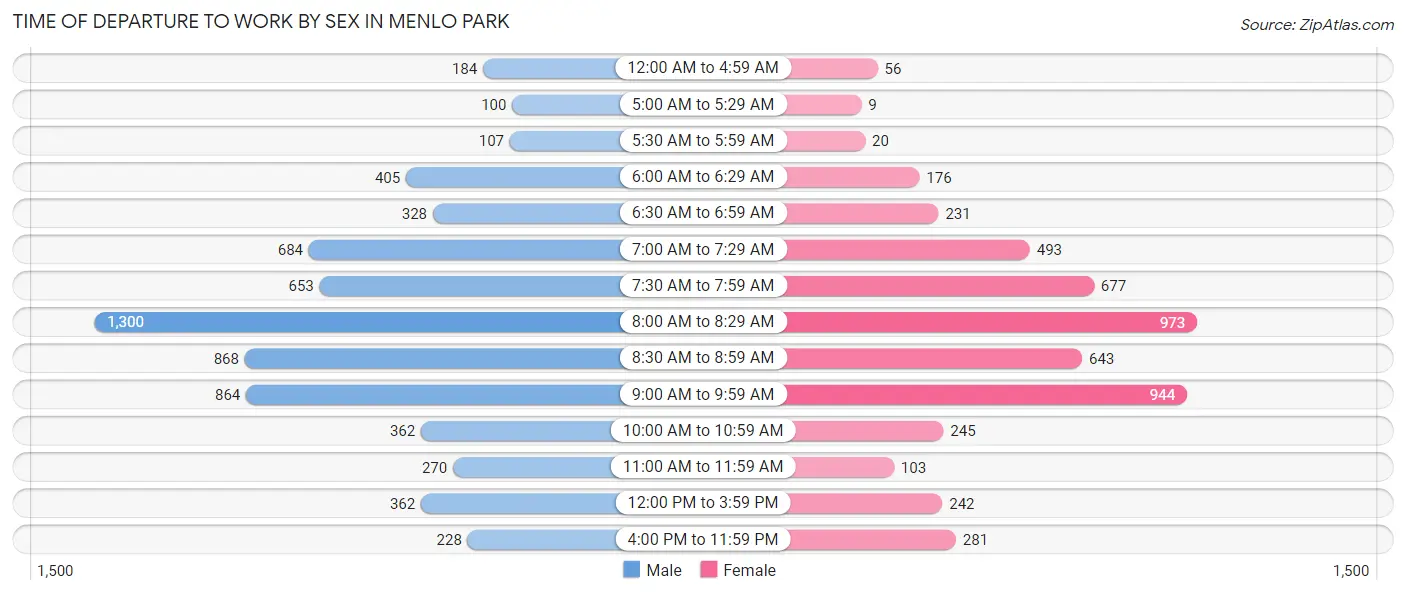
| Time of Departure | Male | Female |
| 12:00 AM to 4:59 AM | 184 (2.7%) | 56 (1.1%) |
| 5:00 AM to 5:29 AM | 100 (1.5%) | 9 (0.2%) |
| 5:30 AM to 5:59 AM | 107 (1.6%) | 20 (0.4%) |
| 6:00 AM to 6:29 AM | 405 (6.0%) | 176 (3.5%) |
| 6:30 AM to 6:59 AM | 328 (4.9%) | 231 (4.5%) |
| 7:00 AM to 7:29 AM | 684 (10.2%) | 493 (9.7%) |
| 7:30 AM to 7:59 AM | 653 (9.7%) | 677 (13.3%) |
| 8:00 AM to 8:29 AM | 1,300 (19.4%) | 973 (19.1%) |
| 8:30 AM to 8:59 AM | 868 (12.9%) | 643 (12.6%) |
| 9:00 AM to 9:59 AM | 864 (12.9%) | 944 (18.5%) |
| 10:00 AM to 10:59 AM | 362 (5.4%) | 245 (4.8%) |
| 11:00 AM to 11:59 AM | 270 (4.0%) | 103 (2.0%) |
| 12:00 PM to 3:59 PM | 362 (5.4%) | 242 (4.8%) |
| 4:00 PM to 11:59 PM | 228 (3.4%) | 281 (5.5%) |
| Total | 6,715 (100.0%) | 5,093 (100.0%) |
Housing Occupancy in Menlo Park
Occupancy by Ownership in Menlo Park
Of the total 11,661 dwellings in Menlo Park, owner-occupied units account for 6,560 (56.3%), while renter-occupied units make up 5,101 (43.7%).
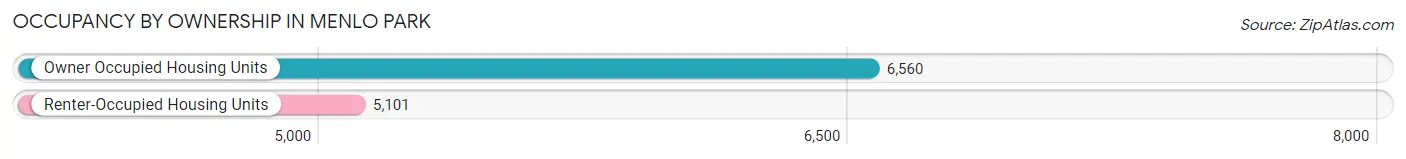
| Occupancy | # Housing Units | % Housing Units |
| Owner Occupied Housing Units | 6,560 | 56.3% |
| Renter-Occupied Housing Units | 5,101 | 43.7% |
| Total Occupied Housing Units | 11,661 | 100.0% |
Occupancy by Household Size in Menlo Park
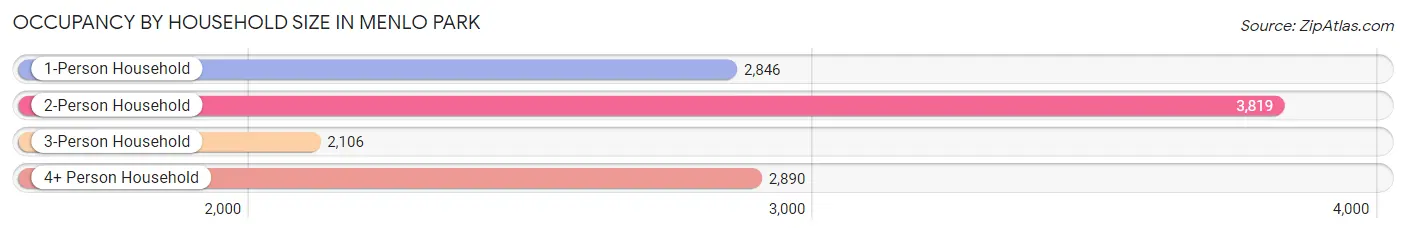
| Household Size | # Housing Units | % Housing Units |
| 1-Person Household | 2,846 | 24.4% |
| 2-Person Household | 3,819 | 32.8% |
| 3-Person Household | 2,106 | 18.1% |
| 4+ Person Household | 2,890 | 24.8% |
| Total Housing Units | 11,661 | 100.0% |
Occupancy by Ownership by Household Size in Menlo Park
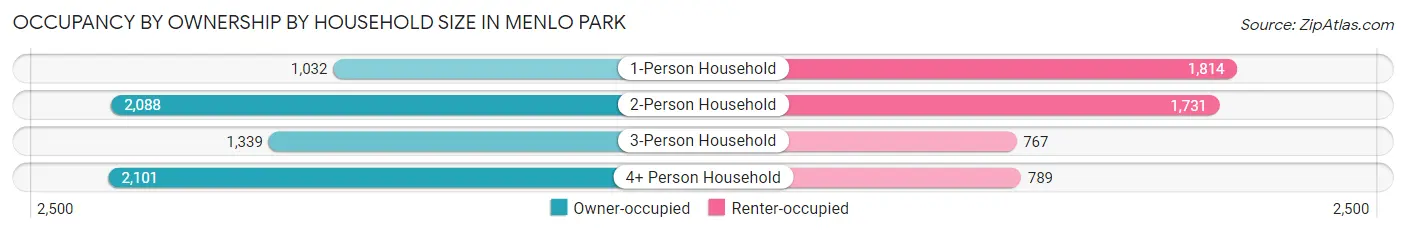
| Household Size | Owner-occupied | Renter-occupied |
| 1-Person Household | 1,032 (36.3%) | 1,814 (63.7%) |
| 2-Person Household | 2,088 (54.7%) | 1,731 (45.3%) |
| 3-Person Household | 1,339 (63.6%) | 767 (36.4%) |
| 4+ Person Household | 2,101 (72.7%) | 789 (27.3%) |
| Total Housing Units | 6,560 (56.3%) | 5,101 (43.7%) |
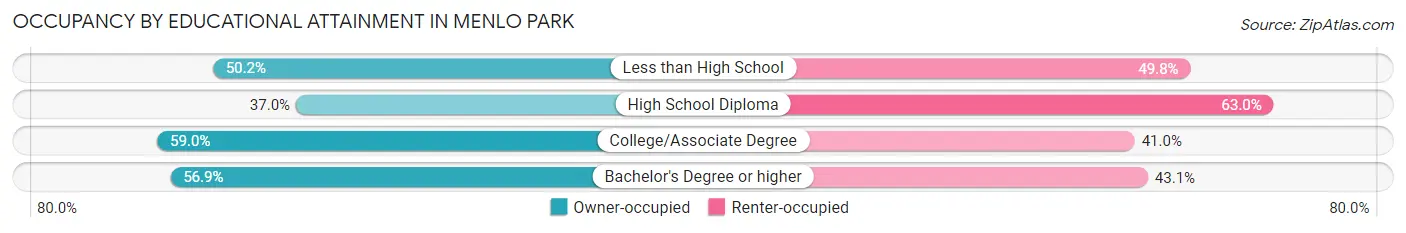
Occupancy by Educational Attainment in Menlo Park
| Household Size | Owner-occupied | Renter-occupied |
| Less than High School | 161 (50.2%) | 160 (49.8%) |
| High School Diploma | 156 (37.0%) | 266 (63.0%) |
| College/Associate Degree | 876 (59.0%) | 609 (41.0%) |
| Bachelor's Degree or higher | 5,367 (56.9%) | 4,066 (43.1%) |
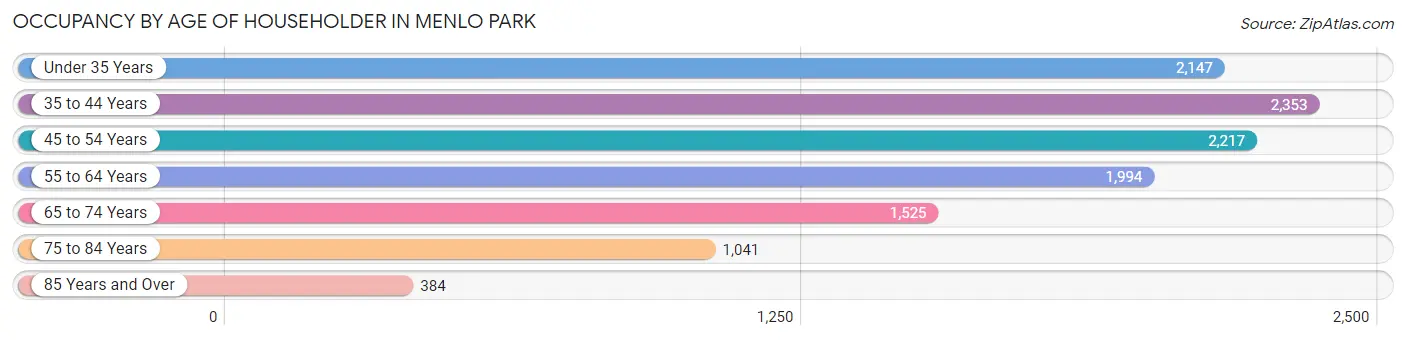
Occupancy by Age of Householder in Menlo Park
| Age Bracket | # Households | % Households |
| Under 35 Years | 2,147 | 18.4% |
| 35 to 44 Years | 2,353 | 20.2% |
| 45 to 54 Years | 2,217 | 19.0% |
| 55 to 64 Years | 1,994 | 17.1% |
| 65 to 74 Years | 1,525 | 13.1% |
| 75 to 84 Years | 1,041 | 8.9% |
| 85 Years and Over | 384 | 3.3% |
| Total | 11,661 | 100.0% |
Housing Finances in Menlo Park
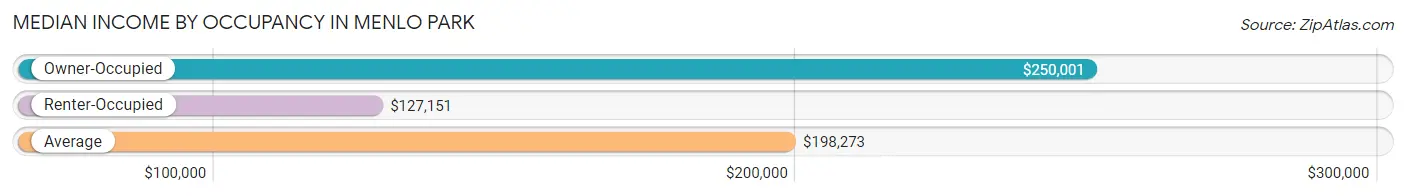
Median Income by Occupancy in Menlo Park
| Occupancy Type | # Households | Median Income |
| Owner-Occupied | 6,560 (56.3%) | $250,001 |
| Renter-Occupied | 5,101 (43.7%) | $127,151 |
| Average | 11,661 (100.0%) | $198,273 |
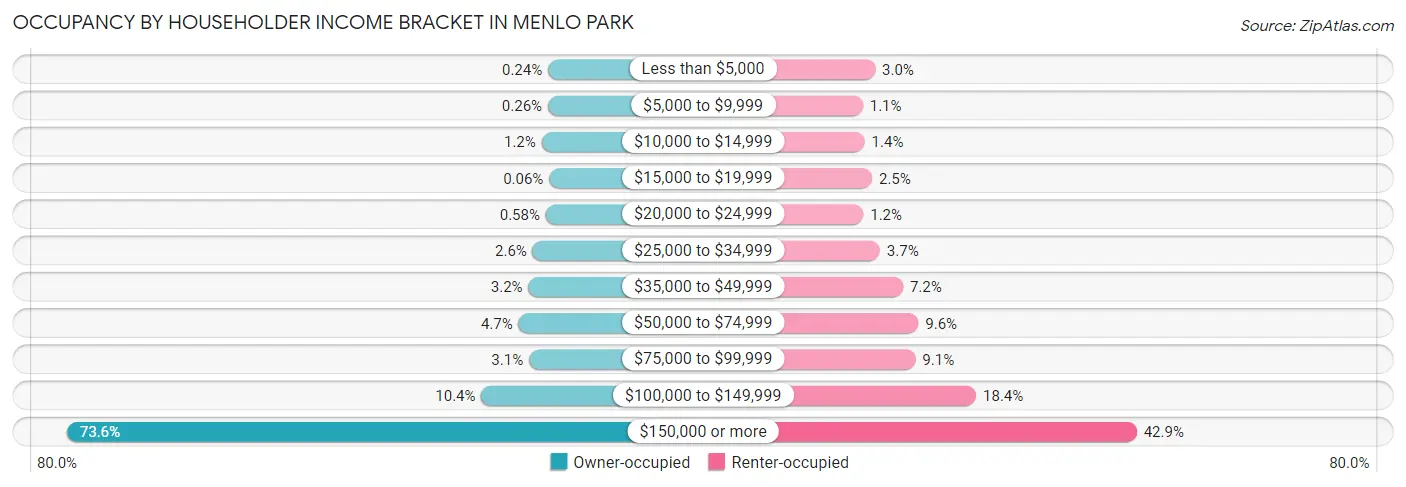
Occupancy by Householder Income Bracket in Menlo Park
| Income Bracket | Owner-occupied | Renter-occupied |
| Less than $5,000 | 16 (0.2%) | 152 (3.0%) |
| $5,000 to $9,999 | 17 (0.3%) | 56 (1.1%) |
| $10,000 to $14,999 | 80 (1.2%) | 71 (1.4%) |
| $15,000 to $19,999 | 4 (0.1%) | 128 (2.5%) |
| $20,000 to $24,999 | 38 (0.6%) | 60 (1.2%) |
| $25,000 to $34,999 | 169 (2.6%) | 189 (3.7%) |
| $35,000 to $49,999 | 212 (3.2%) | 369 (7.2%) |
| $50,000 to $74,999 | 310 (4.7%) | 488 (9.6%) |
| $75,000 to $99,999 | 206 (3.1%) | 465 (9.1%) |
| $100,000 to $149,999 | 682 (10.4%) | 937 (18.4%) |
| $150,000 or more | 4,826 (73.6%) | 2,186 (42.8%) |
| Total | 6,560 (100.0%) | 5,101 (100.0%) |
Monthly Housing Cost Tiers in Menlo Park
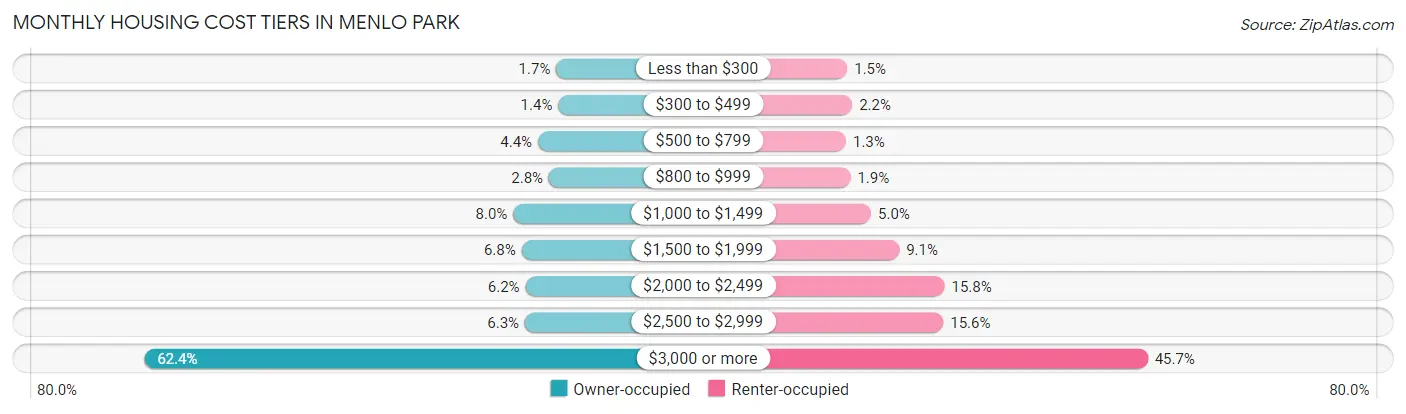
| Monthly Cost | Owner-occupied | Renter-occupied |
| Less than $300 | 111 (1.7%) | 74 (1.5%) |
| $300 to $499 | 92 (1.4%) | 111 (2.2%) |
| $500 to $799 | 288 (4.4%) | 65 (1.3%) |
| $800 to $999 | 182 (2.8%) | 98 (1.9%) |
| $1,000 to $1,499 | 527 (8.0%) | 253 (5.0%) |
| $1,500 to $1,999 | 446 (6.8%) | 464 (9.1%) |
| $2,000 to $2,499 | 409 (6.2%) | 805 (15.8%) |
| $2,500 to $2,999 | 413 (6.3%) | 796 (15.6%) |
| $3,000 or more | 4,092 (62.4%) | 2,331 (45.7%) |
| Total | 6,560 (100.0%) | 5,101 (100.0%) |
Physical Housing Characteristics in Menlo Park
Housing Structures in Menlo Park
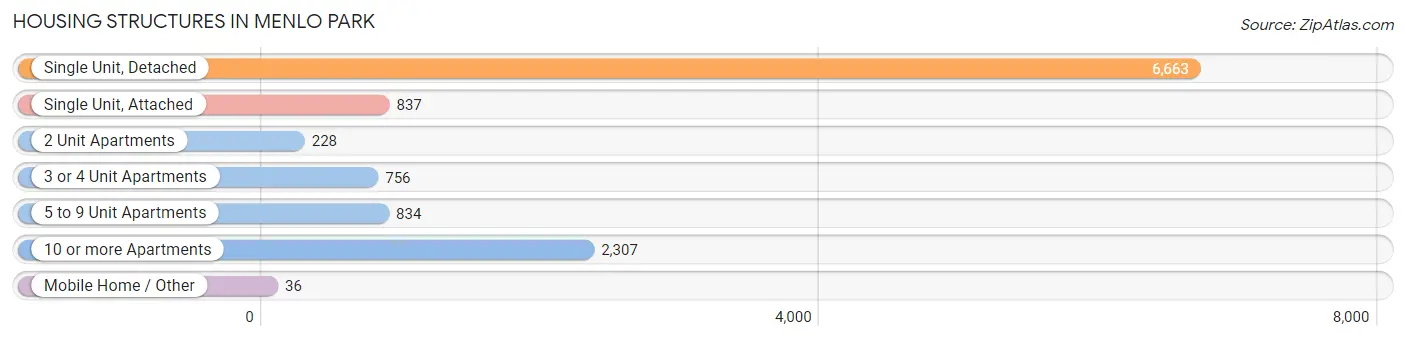
| Structure Type | # Housing Units | % Housing Units |
| Single Unit, Detached | 6,663 | 57.1% |
| Single Unit, Attached | 837 | 7.2% |
| 2 Unit Apartments | 228 | 2.0% |
| 3 or 4 Unit Apartments | 756 | 6.5% |
| 5 to 9 Unit Apartments | 834 | 7.1% |
| 10 or more Apartments | 2,307 | 19.8% |
| Mobile Home / Other | 36 | 0.3% |
| Total | 11,661 | 100.0% |
Housing Structures by Occupancy in Menlo Park
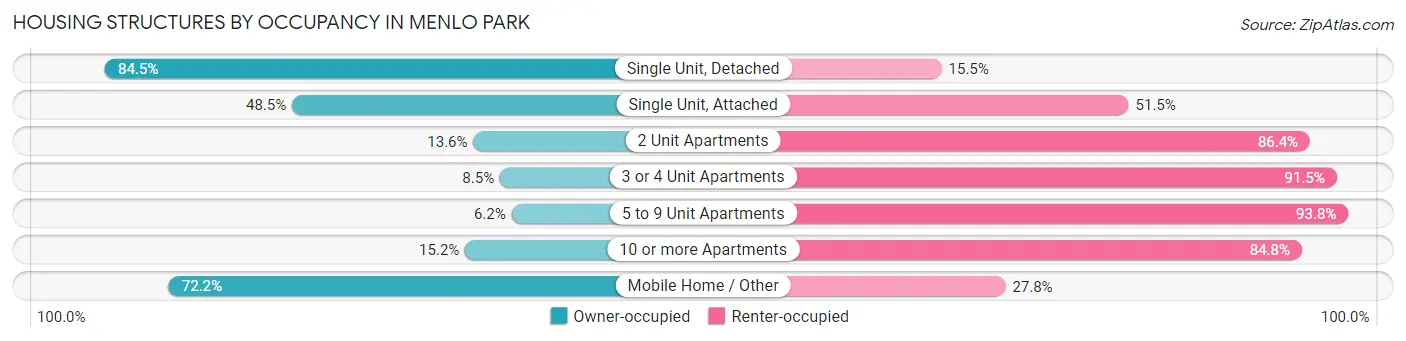
| Structure Type | Owner-occupied | Renter-occupied |
| Single Unit, Detached | 5,631 (84.5%) | 1,032 (15.5%) |
| Single Unit, Attached | 406 (48.5%) | 431 (51.5%) |
| 2 Unit Apartments | 31 (13.6%) | 197 (86.4%) |
| 3 or 4 Unit Apartments | 64 (8.5%) | 692 (91.5%) |
| 5 to 9 Unit Apartments | 52 (6.2%) | 782 (93.8%) |
| 10 or more Apartments | 350 (15.2%) | 1,957 (84.8%) |
| Mobile Home / Other | 26 (72.2%) | 10 (27.8%) |
| Total | 6,560 (56.3%) | 5,101 (43.7%) |
Housing Structures by Number of Rooms in Menlo Park
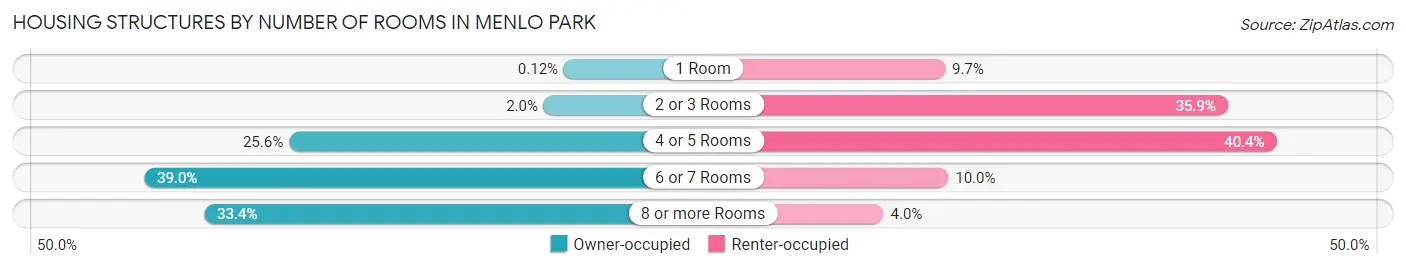
| Number of Rooms | Owner-occupied | Renter-occupied |
| 1 Room | 8 (0.1%) | 496 (9.7%) |
| 2 or 3 Rooms | 130 (2.0%) | 1,829 (35.9%) |
| 4 or 5 Rooms | 1,676 (25.6%) | 2,059 (40.4%) |
| 6 or 7 Rooms | 2,555 (39.0%) | 511 (10.0%) |
| 8 or more Rooms | 2,191 (33.4%) | 206 (4.0%) |
| Total | 6,560 (100.0%) | 5,101 (100.0%) |
Housing Structure by Heating Type in Menlo Park
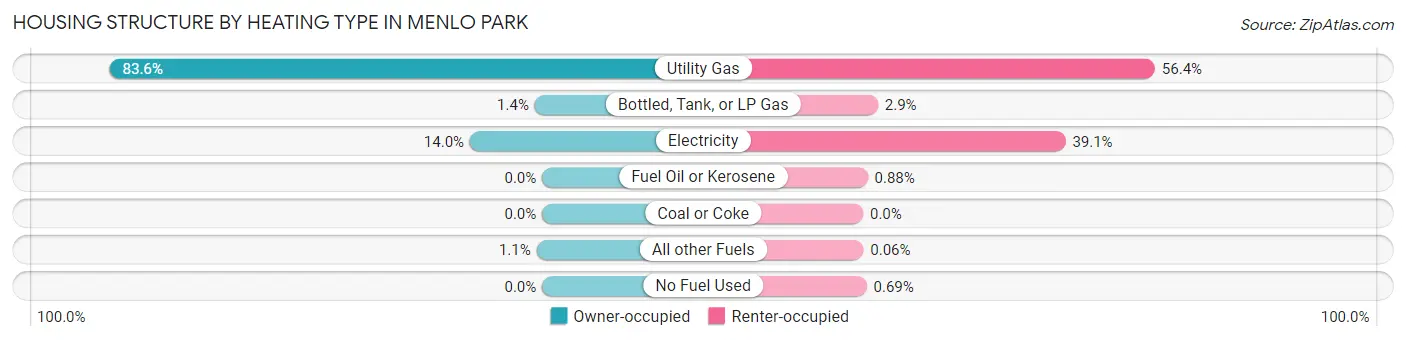
| Heating Type | Owner-occupied | Renter-occupied |
| Utility Gas | 5,482 (83.6%) | 2,877 (56.4%) |
| Bottled, Tank, or LP Gas | 93 (1.4%) | 146 (2.9%) |
| Electricity | 915 (14.0%) | 1,995 (39.1%) |
| Fuel Oil or Kerosene | 0 (0.0%) | 45 (0.9%) |
| Coal or Coke | 0 (0.0%) | 0 (0.0%) |
| All other Fuels | 70 (1.1%) | 3 (0.1%) |
| No Fuel Used | 0 (0.0%) | 35 (0.7%) |
| Total | 6,560 (100.0%) | 5,101 (100.0%) |
Household Vehicle Usage in Menlo Park
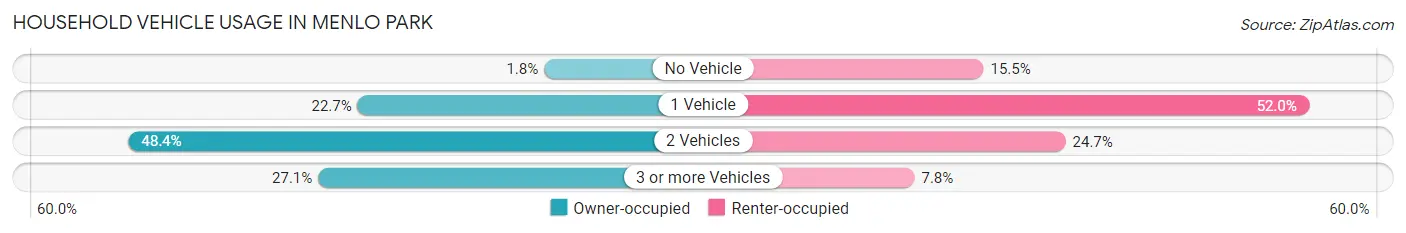
| Vehicles per Household | Owner-occupied | Renter-occupied |
| No Vehicle | 119 (1.8%) | 792 (15.5%) |
| 1 Vehicle | 1,489 (22.7%) | 2,650 (51.9%) |
| 2 Vehicles | 3,173 (48.4%) | 1,261 (24.7%) |
| 3 or more Vehicles | 1,779 (27.1%) | 398 (7.8%) |
| Total | 6,560 (100.0%) | 5,101 (100.0%) |
Real Estate & Mortgages in Menlo Park
Real Estate and Mortgage Overview in Menlo Park
| Characteristic | Without Mortgage | With Mortgage |
| Housing Units | 2,250 | 4,310 |
| Median Property Value | $2,000,001 | $2,000,001 |
| Median Household Income | $198,958 | $3,449 |
| Monthly Housing Costs | $1,501 | $3,774 |
| Real Estate Taxes | $9,747 | $22 |
Property Value by Mortgage Status in Menlo Park
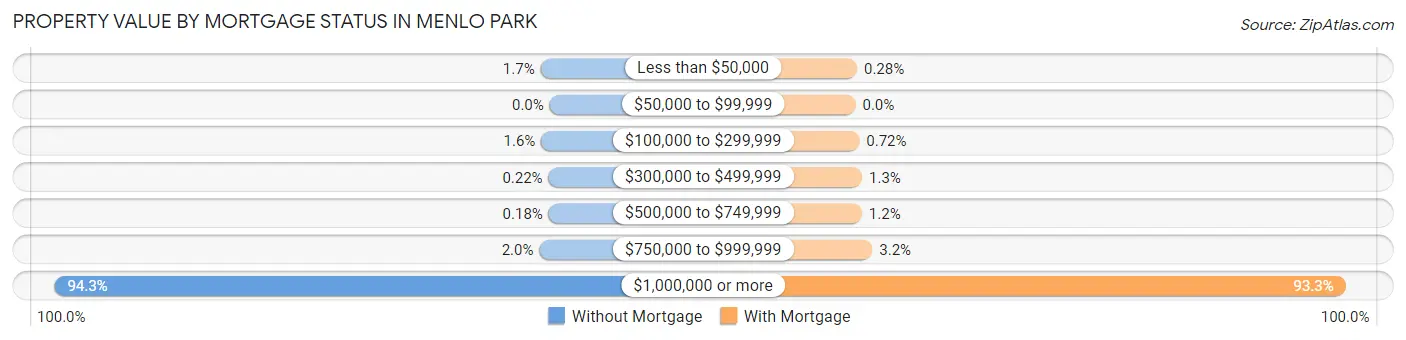
| Property Value | Without Mortgage | With Mortgage |
| Less than $50,000 | 39 (1.7%) | 12 (0.3%) |
| $50,000 to $99,999 | 0 (0.0%) | 0 (0.0%) |
| $100,000 to $299,999 | 36 (1.6%) | 31 (0.7%) |
| $300,000 to $499,999 | 5 (0.2%) | 54 (1.3%) |
| $500,000 to $749,999 | 4 (0.2%) | 52 (1.2%) |
| $750,000 to $999,999 | 44 (2.0%) | 138 (3.2%) |
| $1,000,000 or more | 2,122 (94.3%) | 4,023 (93.3%) |
| Total | 2,250 (100.0%) | 4,310 (100.0%) |
Household Income by Mortgage Status in Menlo Park
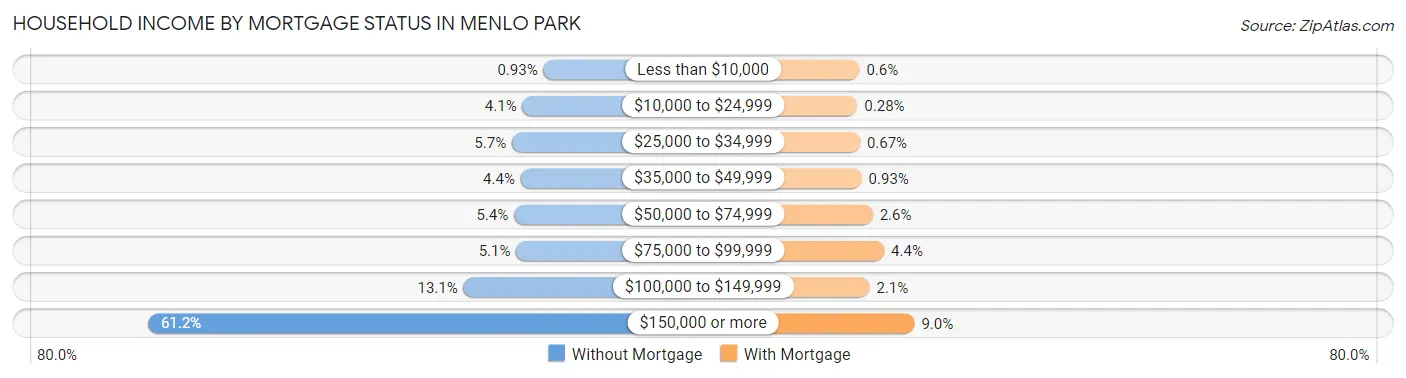
| Household Income | Without Mortgage | With Mortgage |
| Less than $10,000 | 21 (0.9%) | 26 (0.6%) |
| $10,000 to $24,999 | 93 (4.1%) | 12 (0.3%) |
| $25,000 to $34,999 | 129 (5.7%) | 29 (0.7%) |
| $35,000 to $49,999 | 99 (4.4%) | 40 (0.9%) |
| $50,000 to $74,999 | 122 (5.4%) | 113 (2.6%) |
| $75,000 to $99,999 | 114 (5.1%) | 188 (4.4%) |
| $100,000 to $149,999 | 295 (13.1%) | 92 (2.1%) |
| $150,000 or more | 1,377 (61.2%) | 387 (9.0%) |
| Total | 2,250 (100.0%) | 4,310 (100.0%) |
Property Value to Household Income Ratio in Menlo Park
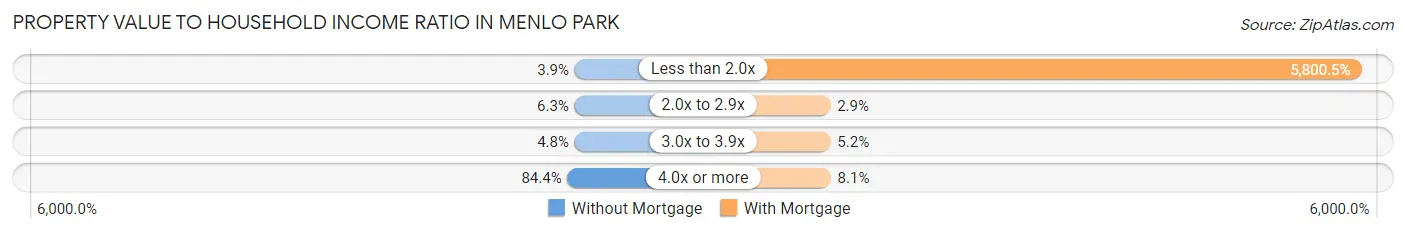
| Value-to-Income Ratio | Without Mortgage | With Mortgage |
| Less than 2.0x | 88 (3.9%) | 250,001 (5,800.5%) |
| 2.0x to 2.9x | 142 (6.3%) | 126 (2.9%) |
| 3.0x to 3.9x | 108 (4.8%) | 224 (5.2%) |
| 4.0x or more | 1,900 (84.4%) | 349 (8.1%) |
| Total | 2,250 (100.0%) | 4,310 (100.0%) |
Real Estate Taxes by Mortgage Status in Menlo Park
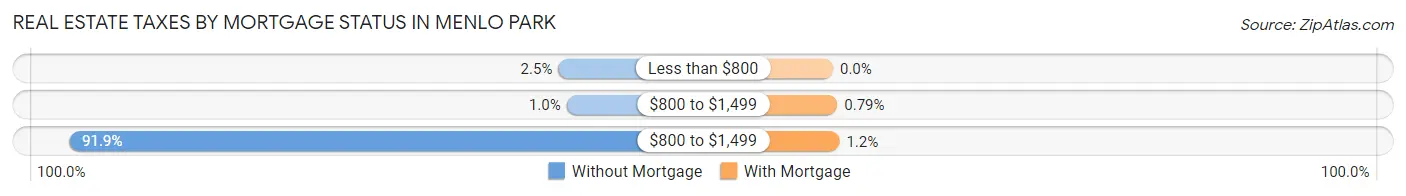
| Property Taxes | Without Mortgage | With Mortgage |
| Less than $800 | 57 (2.5%) | 0 (0.0%) |
| $800 to $1,499 | 23 (1.0%) | 34 (0.8%) |
| $800 to $1,499 | 2,067 (91.9%) | 51 (1.2%) |
| Total | 2,250 (100.0%) | 4,310 (100.0%) |
Health & Disability in Menlo Park
Health Insurance Coverage by Age in Menlo Park
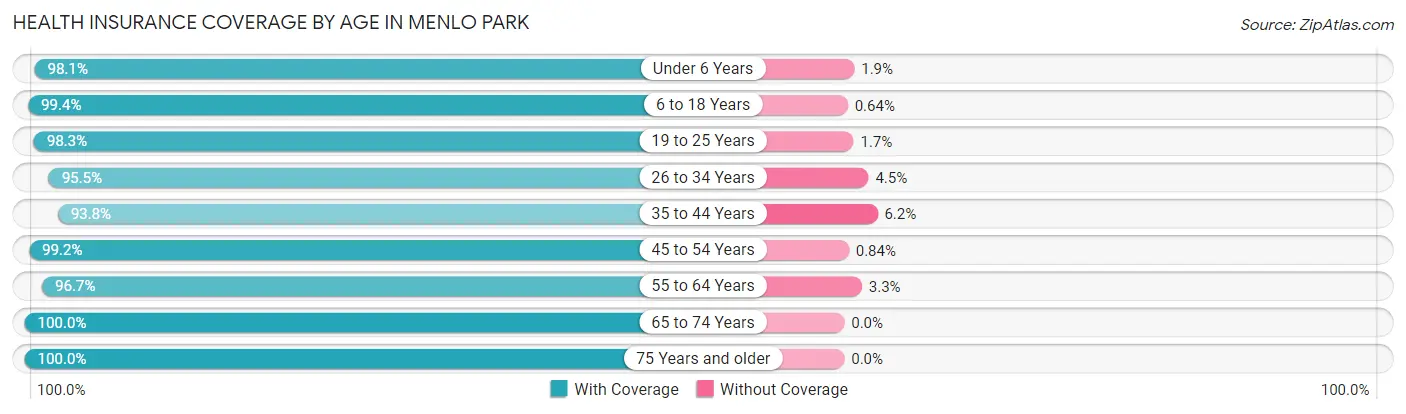
| Age Bracket | With Coverage | Without Coverage |
| Under 6 Years | 2,750 (98.1%) | 52 (1.9%) |
| 6 to 18 Years | 5,161 (99.4%) | 33 (0.6%) |
| 19 to 25 Years | 2,627 (98.3%) | 46 (1.7%) |
| 26 to 34 Years | 3,985 (95.5%) | 188 (4.5%) |
| 35 to 44 Years | 4,871 (93.8%) | 321 (6.2%) |
| 45 to 54 Years | 4,262 (99.2%) | 36 (0.8%) |
| 55 to 64 Years | 3,729 (96.7%) | 126 (3.3%) |
| 65 to 74 Years | 2,695 (100.0%) | 0 (0.0%) |
| 75 Years and older | 2,162 (100.0%) | 0 (0.0%) |
| Total | 32,242 (97.6%) | 802 (2.4%) |
Health Insurance Coverage by Citizenship Status in Menlo Park
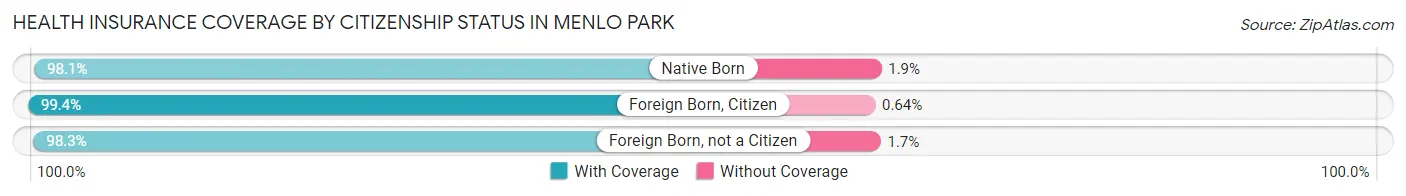
| Citizenship Status | With Coverage | Without Coverage |
| Native Born | 2,750 (98.1%) | 52 (1.9%) |
| Foreign Born, Citizen | 5,161 (99.4%) | 33 (0.6%) |
| Foreign Born, not a Citizen | 2,627 (98.3%) | 46 (1.7%) |
Health Insurance Coverage by Household Income in Menlo Park
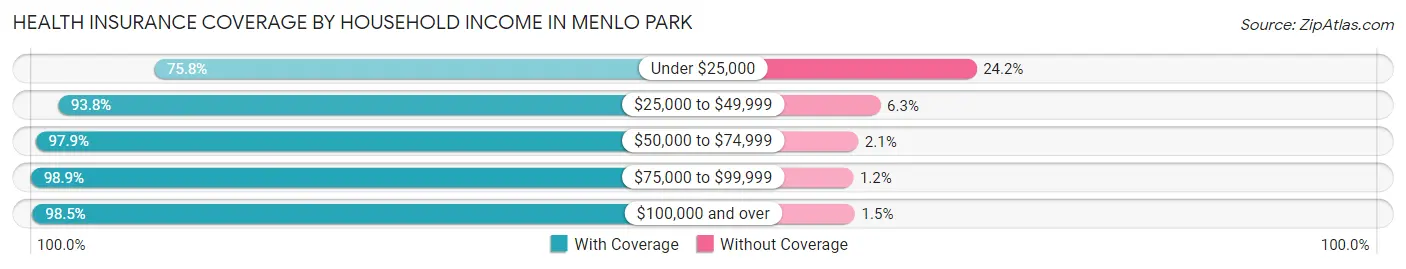
| Household Income | With Coverage | Without Coverage |
| Under $25,000 | 694 (75.8%) | 222 (24.2%) |
| $25,000 to $49,999 | 1,409 (93.8%) | 94 (6.2%) |
| $50,000 to $74,999 | 1,503 (97.9%) | 32 (2.1%) |
| $75,000 to $99,999 | 1,455 (98.9%) | 17 (1.1%) |
| $100,000 and over | 26,196 (98.5%) | 391 (1.5%) |
Public vs Private Health Insurance Coverage by Age in Menlo Park
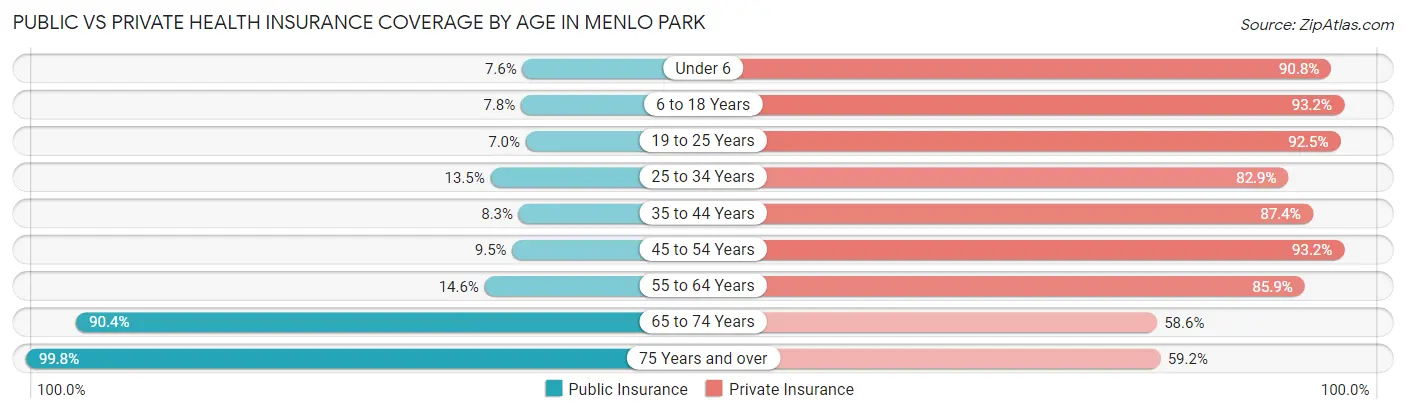
| Age Bracket | Public Insurance | Private Insurance |
| Under 6 | 212 (7.6%) | 2,545 (90.8%) |
| 6 to 18 Years | 407 (7.8%) | 4,839 (93.2%) |
| 19 to 25 Years | 186 (7.0%) | 2,473 (92.5%) |
| 25 to 34 Years | 564 (13.5%) | 3,458 (82.9%) |
| 35 to 44 Years | 429 (8.3%) | 4,536 (87.4%) |
| 45 to 54 Years | 406 (9.5%) | 4,007 (93.2%) |
| 55 to 64 Years | 563 (14.6%) | 3,312 (85.9%) |
| 65 to 74 Years | 2,437 (90.4%) | 1,578 (58.6%) |
| 75 Years and over | 2,157 (99.8%) | 1,280 (59.2%) |
| Total | 7,361 (22.3%) | 28,028 (84.8%) |
Disability Status by Sex by Age in Menlo Park
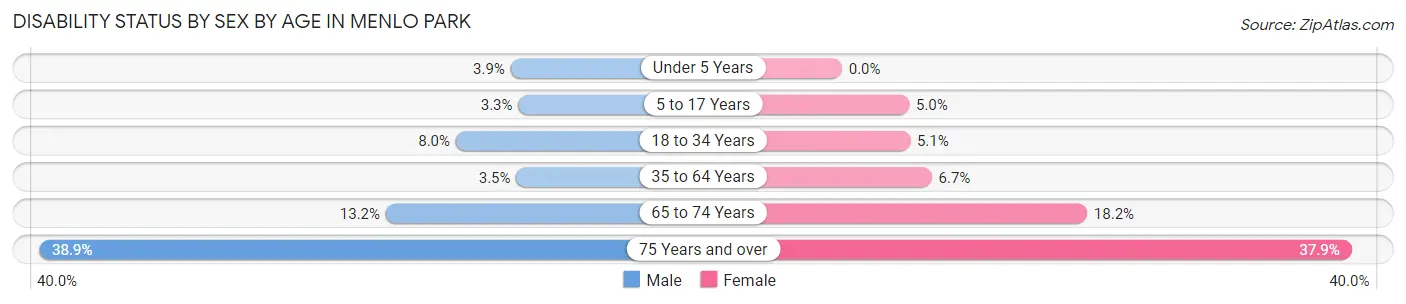
| Age Bracket | Male | Female |
| Under 5 Years | 49 (3.9%) | 0 (0.0%) |
| 5 to 17 Years | 83 (3.3%) | 145 (5.0%) |
| 18 to 34 Years | 276 (8.0%) | 191 (5.1%) |
| 35 to 64 Years | 239 (3.5%) | 433 (6.7%) |
| 65 to 74 Years | 143 (13.2%) | 293 (18.2%) |
| 75 Years and over | 388 (38.9%) | 441 (37.9%) |
Disability Class by Sex by Age in Menlo Park
Disability Class: Hearing Difficulty
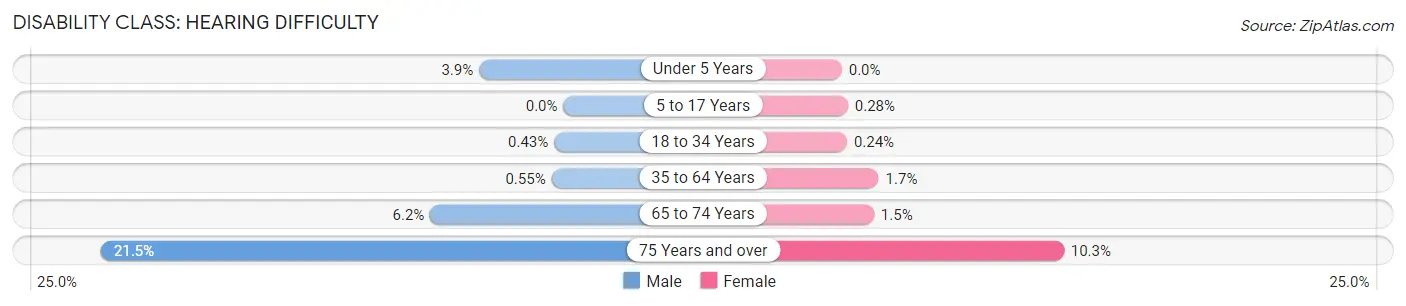
| Age Bracket | Male | Female |
| Under 5 Years | 49 (3.9%) | 0 (0.0%) |
| 5 to 17 Years | 0 (0.0%) | 8 (0.3%) |
| 18 to 34 Years | 15 (0.4%) | 9 (0.2%) |
| 35 to 64 Years | 38 (0.5%) | 111 (1.7%) |
| 65 to 74 Years | 67 (6.2%) | 24 (1.5%) |
| 75 Years and over | 214 (21.5%) | 120 (10.3%) |
Disability Class: Vision Difficulty
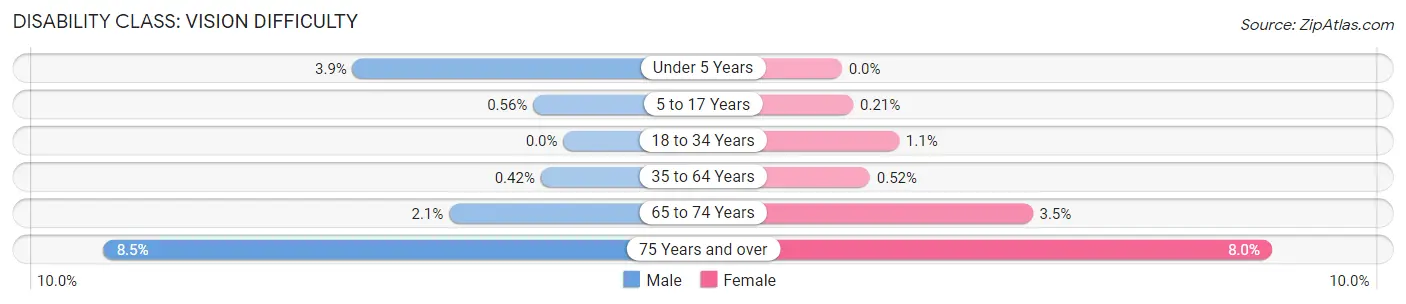
| Age Bracket | Male | Female |
| Under 5 Years | 49 (3.9%) | 0 (0.0%) |
| 5 to 17 Years | 14 (0.6%) | 6 (0.2%) |
| 18 to 34 Years | 0 (0.0%) | 40 (1.1%) |
| 35 to 64 Years | 29 (0.4%) | 34 (0.5%) |
| 65 to 74 Years | 23 (2.1%) | 57 (3.5%) |
| 75 Years and over | 85 (8.5%) | 93 (8.0%) |
Disability Class: Cognitive Difficulty
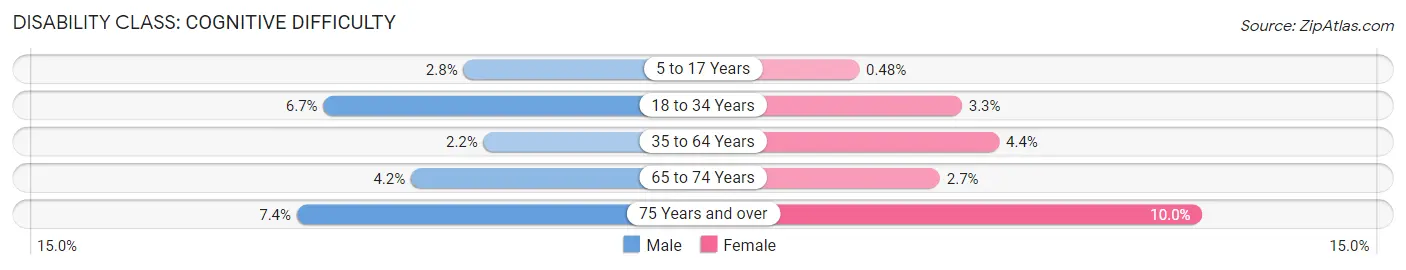
| Age Bracket | Male | Female |
| 5 to 17 Years | 69 (2.8%) | 14 (0.5%) |
| 18 to 34 Years | 231 (6.7%) | 126 (3.3%) |
| 35 to 64 Years | 152 (2.2%) | 284 (4.4%) |
| 65 to 74 Years | 46 (4.2%) | 44 (2.7%) |
| 75 Years and over | 74 (7.4%) | 117 (10.0%) |
Disability Class: Ambulatory Difficulty
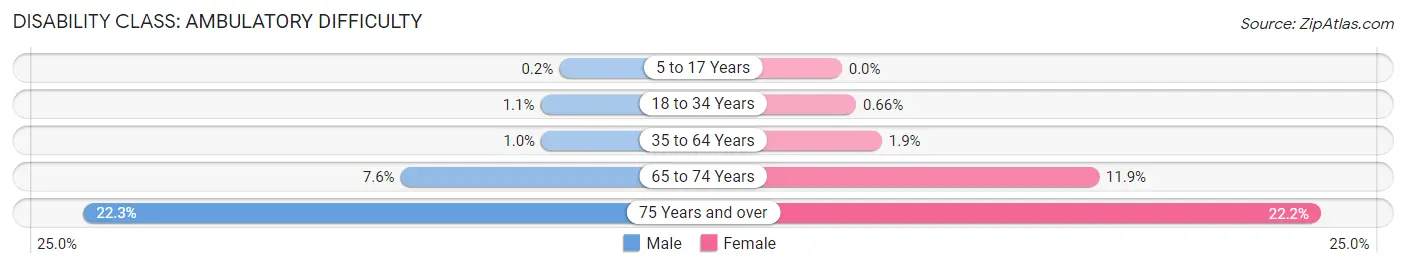
| Age Bracket | Male | Female |
| 5 to 17 Years | 5 (0.2%) | 0 (0.0%) |
| 18 to 34 Years | 37 (1.1%) | 25 (0.7%) |
| 35 to 64 Years | 71 (1.0%) | 121 (1.9%) |
| 65 to 74 Years | 82 (7.6%) | 192 (11.9%) |
| 75 Years and over | 222 (22.3%) | 259 (22.2%) |
Disability Class: Self-Care Difficulty
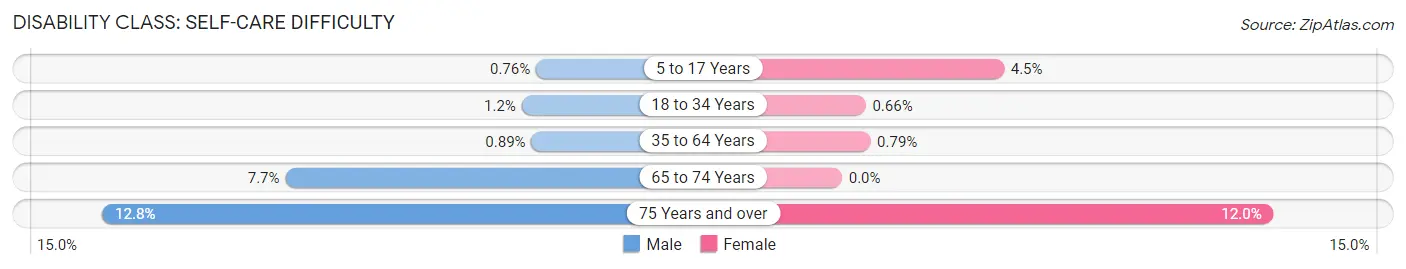
| Age Bracket | Male | Female |
| 5 to 17 Years | 19 (0.8%) | 131 (4.5%) |
| 18 to 34 Years | 40 (1.2%) | 25 (0.7%) |
| 35 to 64 Years | 61 (0.9%) | 51 (0.8%) |
| 65 to 74 Years | 84 (7.7%) | 0 (0.0%) |
| 75 Years and over | 128 (12.8%) | 140 (12.0%) |
Technology Access in Menlo Park
Computing Device Access in Menlo Park
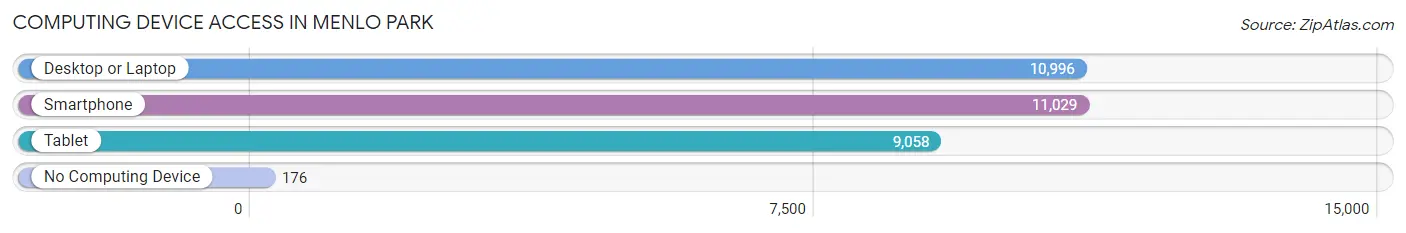
| Device Type | # Households | % Households |
| Desktop or Laptop | 10,996 | 94.3% |
| Smartphone | 11,029 | 94.6% |
| Tablet | 9,058 | 77.7% |
| No Computing Device | 176 | 1.5% |
| Total | 11,661 | 100.0% |
Internet Access in Menlo Park
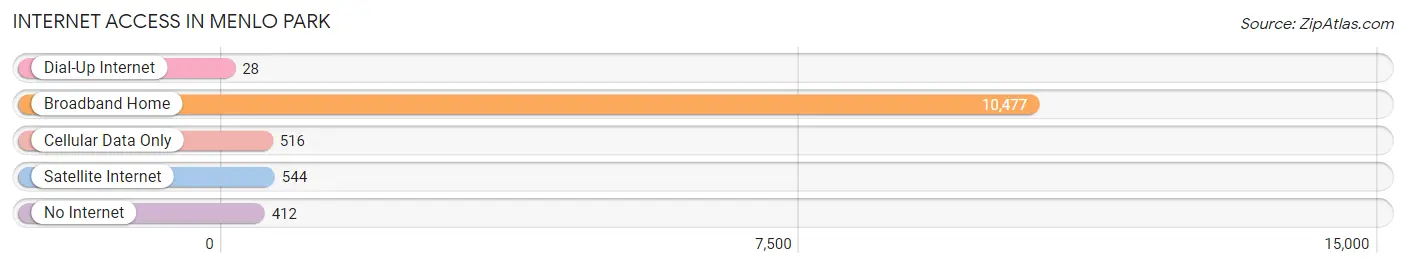
| Internet Type | # Households | % Households |
| Dial-Up Internet | 28 | 0.2% |
| Broadband Home | 10,477 | 89.8% |
| Cellular Data Only | 516 | 4.4% |
| Satellite Internet | 544 | 4.7% |
| No Internet | 412 | 3.5% |
| Total | 11,661 | 100.0% |
Menlo Park Summary
Menlo Park, California is a city located in San Mateo County, California, in the San Francisco Bay Area. It is situated between the cities of Palo Alto and Redwood City, and is bordered by the San Francisco Bay to the east and the Santa Cruz Mountains to the west. The city is home to a population of approximately 32,000 people, and is known for its high quality of life, excellent schools, and vibrant economy.
Geography
Menlo Park is located in the San Francisco Bay Area, in the heart of Silicon Valley. It is situated between the cities of Palo Alto and Redwood City, and is bordered by the San Francisco Bay to the east and the Santa Cruz Mountains to the west. The city covers an area of approximately 13 square miles, and is located at an elevation of about 30 feet above sea level. The climate in Menlo Park is mild and temperate, with average temperatures ranging from the mid-50s in the winter to the mid-70s in the summer.
History
Menlo Park was founded in 1854 by two Irish immigrants, Dennis J. Oliver and his brother-in-law, D.C. McGlynn. The two men purchased a 640-acre parcel of land from the Mexican government, and named the area after their hometown of Menlo in County Galway, Ireland. The city was incorporated in 1874, and quickly became a popular destination for wealthy San Franciscans looking to escape the hustle and bustle of the city. In the early 1900s, the city was home to a number of prominent businesses, including the Bank of Italy (now Bank of America), the Menlo Park Hotel, and the Menlo Park Inn.
Economy
Menlo Park is home to a vibrant and diverse economy. The city is home to a number of large corporations, including Facebook, Oracle, and Tesla Motors. The city is also home to a number of smaller businesses, including tech startups, restaurants, and retail stores. The city’s economy is largely driven by the technology sector, and the city is home to a number of venture capital firms and tech incubators.
Demographics
As of the 2010 census, Menlo Park had a population of 32,026 people. The racial makeup of the city was 57.2% White, 24.3% Asian, 8.2% Hispanic or Latino, 6.2% African American, and 4.1% other. The median household income in Menlo Park was $118,844, and the median home value was $1,541,000. The city is home to a number of highly educated residents, with over 70% of the population having a bachelor’s degree or higher.
Menlo Park is a vibrant and diverse city with a high quality of life and a thriving economy. The city is home to a number of large corporations, tech startups, and venture capital firms, and is a popular destination for those looking to escape the hustle and bustle of the city. The city is also home to a diverse population, with a median household income of over $118,000 and a median home value of over $1.5 million. Menlo Park is an excellent place to live, work, and play.
Common Questions
What is Per Capita Income in Menlo Park?
Per Capita income in Menlo Park is $113,716.
What is the Median Family Income in Menlo Park?
Median Family Income in Menlo Park is $250,001.
What is the Median Household income in Menlo Park?
Median Household Income in Menlo Park is $198,273.
What is Income or Wage Gap in Menlo Park?
Income or Wage Gap in Menlo Park is 40.0%.
Women in Menlo Park earn 60.0 cents for every dollar earned by a man.
What is Inequality or Gini Index in Menlo Park?
Inequality or Gini Index in Menlo Park is 0.52.
What is the Total Population of Menlo Park?
Total Population of Menlo Park is 33,324.
What is the Total Male Population of Menlo Park?
Total Male Population of Menlo Park is 16,336.
What is the Total Female Population of Menlo Park?
Total Female Population of Menlo Park is 16,988.
What is the Ratio of Males per 100 Females in Menlo Park?
There are 96.16 Males per 100 Females in Menlo Park.
What is the Ratio of Females per 100 Males in Menlo Park?
There are 103.99 Females per 100 Males in Menlo Park.
What is the Median Population Age in Menlo Park?
Median Population Age in Menlo Park is 38.5 Years.
What is the Average Family Size in Menlo Park
Average Family Size in Menlo Park is 3.3 People.
What is the Average Household Size in Menlo Park
Average Household Size in Menlo Park is 2.8 People.
How Large is the Labor Force in Menlo Park?
There are 17,301 People in the Labor Forcein in Menlo Park.
What is the Percentage of People in the Labor Force in Menlo Park?
65.6% of People are in the Labor Force in Menlo Park.
What is the Unemployment Rate in Menlo Park?
Unemployment Rate in Menlo Park is 4.3%.