Volta, CA Map & Demographics
Volta Map
Volta Overview
$53,206
PER CAPITA INCOME
0.58
INEQUALITY / GINI INDEX
292
TOTAL POPULATION
178
MALE POPULATION
114
FEMALE POPULATION
156.14
MALES / 100 FEMALES
64.04
FEMALES / 100 MALES
47.1
MEDIAN AGE
3.6
AVG FAMILY SIZE
2.1
AVG HOUSEHOLD SIZE
199
LABOR FORCE [ PEOPLE ]
78.7%
PERCENT IN LABOR FORCE
25.6%
UNEMPLOYMENT RATE
Income in Volta
Income Overview in Volta
| Characteristic | Number | Measure |
| Per Capita Income | 292 | $53,206 |
| Median Family Income | 56 | $0 |
| Mean Family Income | 56 | $0 |
| Median Household Income | 139 | $0 |
| Mean Household Income | 139 | $111,165 |
| Income Deficit | 56 | $0 |
| Wage / Income Gap (%) | 292 | 0.00% |
| Wage / Income Gap ($) | 292 | 100.00¢ per $1 |
| Gini / Inequality Index | 292 | 0.58 |
Earnings by Sex in Volta
| Sex | Number | Average Earnings |
| Male | 92 (62.2%) | $0 |
| Female | 56 (37.8%) | $0 |
| Total | 148 (100.0%) | $0 |
Earnings by Sex by Income Bracket in Volta
The most common earnings brackets in Volta are $100,000+ for men (48 | 52.2%) and $65,000 to $74,999 for women (49 | 87.5%).
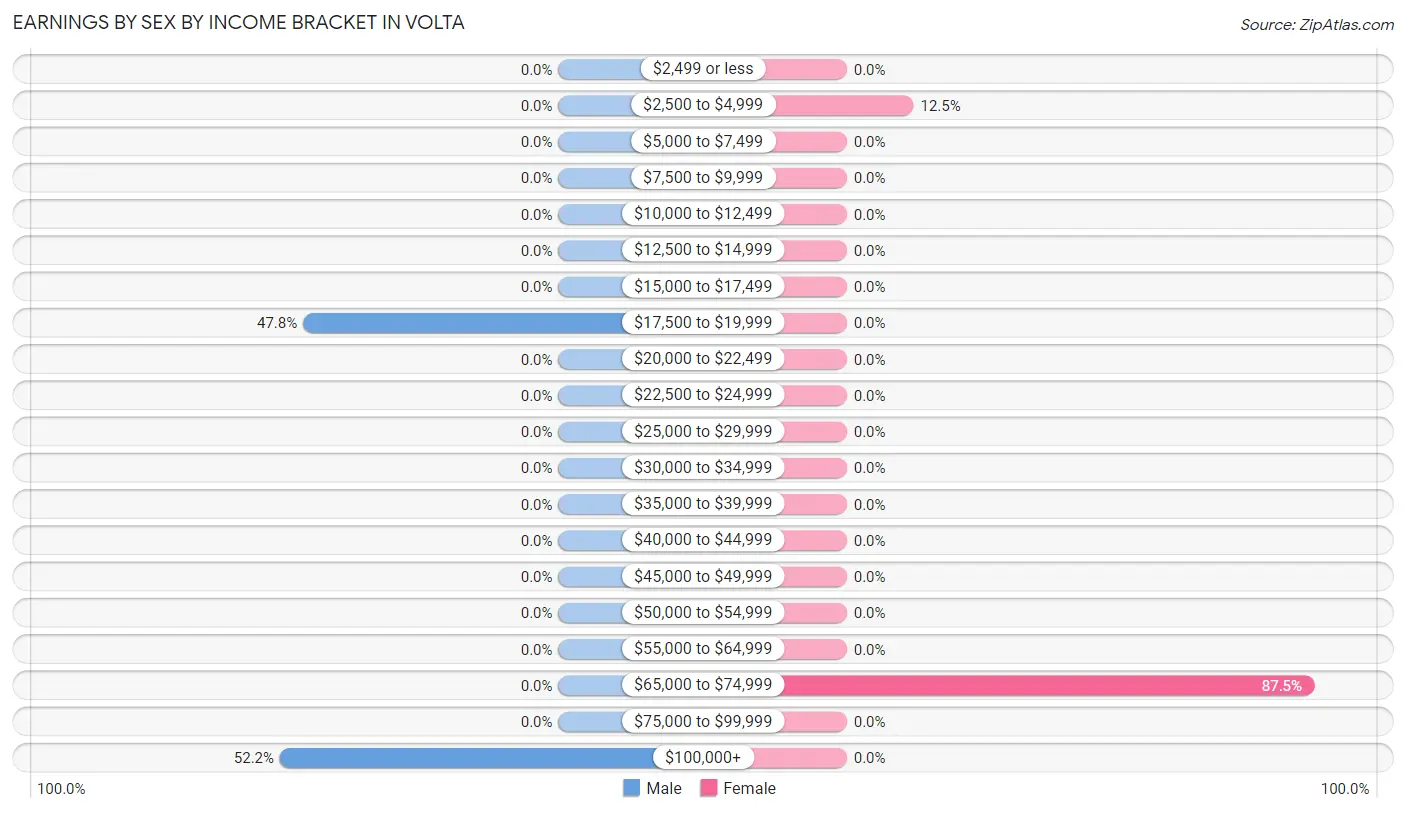
| Income | Male | Female |
| $2,499 or less | 0 (0.0%) | 0 (0.0%) |
| $2,500 to $4,999 | 0 (0.0%) | 7 (12.5%) |
| $5,000 to $7,499 | 0 (0.0%) | 0 (0.0%) |
| $7,500 to $9,999 | 0 (0.0%) | 0 (0.0%) |
| $10,000 to $12,499 | 0 (0.0%) | 0 (0.0%) |
| $12,500 to $14,999 | 0 (0.0%) | 0 (0.0%) |
| $15,000 to $17,499 | 0 (0.0%) | 0 (0.0%) |
| $17,500 to $19,999 | 44 (47.8%) | 0 (0.0%) |
| $20,000 to $22,499 | 0 (0.0%) | 0 (0.0%) |
| $22,500 to $24,999 | 0 (0.0%) | 0 (0.0%) |
| $25,000 to $29,999 | 0 (0.0%) | 0 (0.0%) |
| $30,000 to $34,999 | 0 (0.0%) | 0 (0.0%) |
| $35,000 to $39,999 | 0 (0.0%) | 0 (0.0%) |
| $40,000 to $44,999 | 0 (0.0%) | 0 (0.0%) |
| $45,000 to $49,999 | 0 (0.0%) | 0 (0.0%) |
| $50,000 to $54,999 | 0 (0.0%) | 0 (0.0%) |
| $55,000 to $64,999 | 0 (0.0%) | 0 (0.0%) |
| $65,000 to $74,999 | 0 (0.0%) | 49 (87.5%) |
| $75,000 to $99,999 | 0 (0.0%) | 0 (0.0%) |
| $100,000+ | 48 (52.2%) | 0 (0.0%) |
| Total | 92 (100.0%) | 56 (100.0%) |
Earnings by Sex by Educational Attainment in Volta
| Educational Attainment | Male Income | Female Income |
| Less than High School | - | - |
| High School Diploma | - | - |
| College or Associate's Degree | - | - |
| Bachelor's Degree | - | - |
| Graduate Degree | - | - |
| Total | - | - |
Family Income in Volta
Family Income Brackets in Volta
According to the Volta family income data, there are 48 families falling into the $200,000+ income range, which is the most common income bracket and makes up 85.7% of all families.
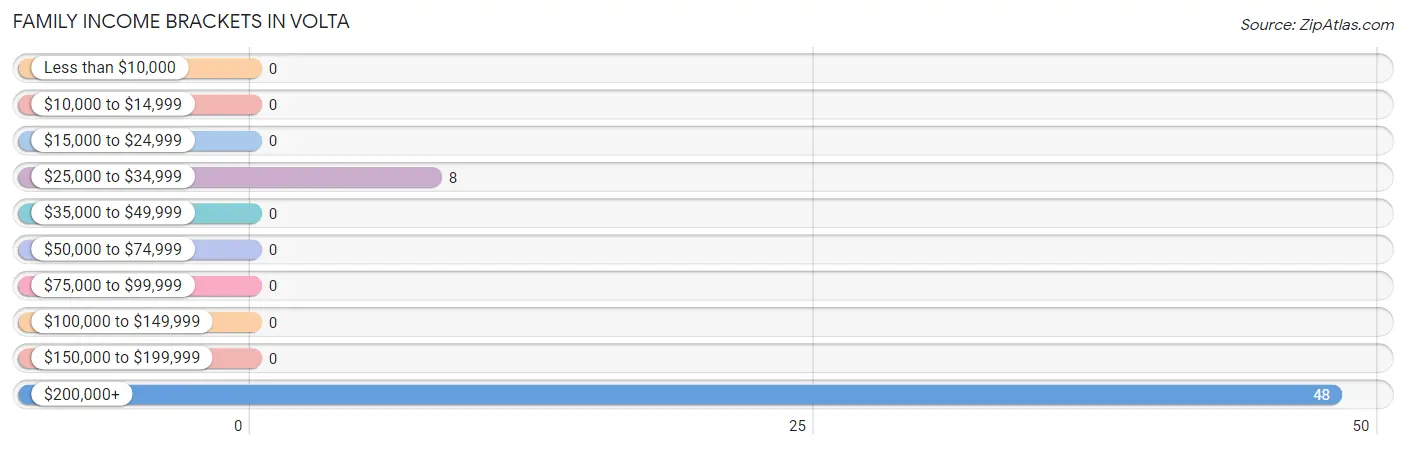
| Income Bracket | # Families | % Families |
| Less than $10,000 | 0 | 0.0% |
| $10,000 to $14,999 | 0 | 0.0% |
| $15,000 to $24,999 | 0 | 0.0% |
| $25,000 to $34,999 | 8 | 14.3% |
| $35,000 to $49,999 | 0 | 0.0% |
| $50,000 to $74,999 | 0 | 0.0% |
| $75,000 to $99,999 | 0 | 0.0% |
| $100,000 to $149,999 | 0 | 0.0% |
| $150,000 to $199,999 | 0 | 0.0% |
| $200,000+ | 48 | 85.7% |
Family Income by Famaliy Size in Volta
| Income Bracket | # Families | Median Income |
| 2-Person Families | 8 (14.3%) | $0 |
| 3-Person Families | 0 (0.0%) | $0 |
| 4-Person Families | 48 (85.7%) | $0 |
| 5-Person Families | 0 (0.0%) | $0 |
| 6-Person Families | 0 (0.0%) | $0 |
| 7+ Person Families | 0 (0.0%) | $0 |
| Total | 56 (100.0%) | $0 |
Family Income by Number of Earners in Volta
| Number of Earners | # Families | Median Income |
| No Earners | 8 (14.3%) | $0 |
| 1 Earner | 0 (0.0%) | $0 |
| 2 Earners | 48 (85.7%) | $0 |
| 3+ Earners | 0 (0.0%) | $0 |
| Total | 56 (100.0%) | $0 |
Household Income in Volta
Household Income Brackets in Volta
With 49 households falling in the category, the $15,000 to $24,999 income range is the most frequent in Volta, accounting for 35.2% of all households.
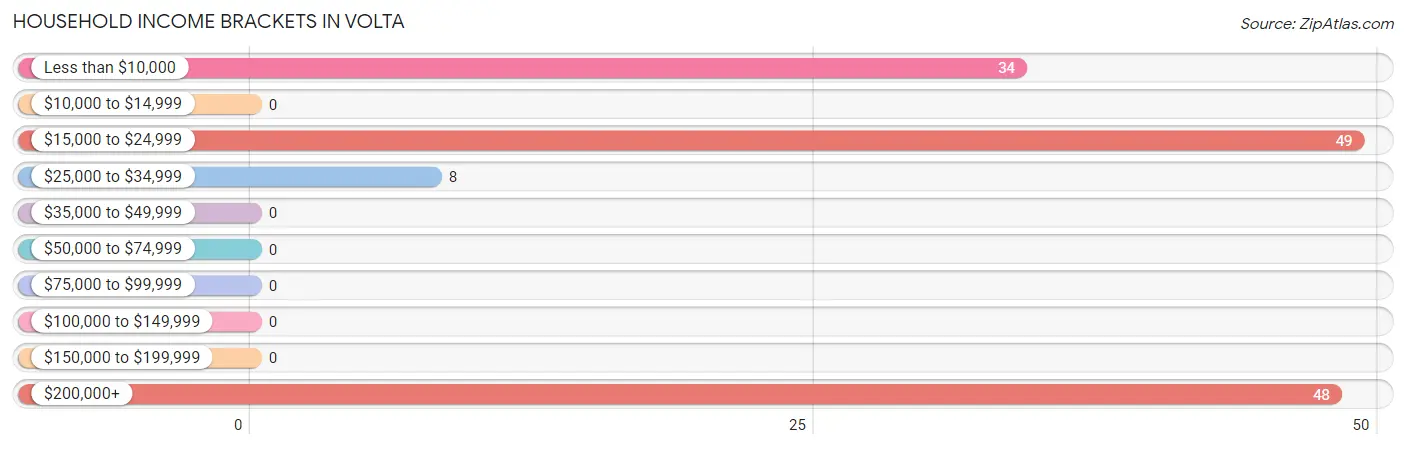
| Income Bracket | # Households | % Households |
| Less than $10,000 | 34 | 24.5% |
| $10,000 to $14,999 | 0 | 0.0% |
| $15,000 to $24,999 | 49 | 35.3% |
| $25,000 to $34,999 | 8 | 5.8% |
| $35,000 to $49,999 | 0 | 0.0% |
| $50,000 to $74,999 | 0 | 0.0% |
| $75,000 to $99,999 | 0 | 0.0% |
| $100,000 to $149,999 | 0 | 0.0% |
| $150,000 to $199,999 | 0 | 0.0% |
| $200,000+ | 48 | 34.5% |
Household Income by Householder Age in Volta
| Income Bracket | # Households | Median Income |
| 15 to 24 Years | 0 (0.0%) | $0 |
| 25 to 44 Years | 0 (0.0%) | $0 |
| 45 to 64 Years | 92 (66.2%) | $0 |
| 65+ Years | 47 (33.8%) | $0 |
| Total | 139 (100.0%) | $0 |
Poverty in Volta
Income Below Poverty by Sex and Age in Volta
With 21.9% poverty level for males and 6.1% for females among the residents of Volta, 65 to 74 year old males and 65 to 74 year old females are the most vulnerable to poverty, with 39 males (83.0%) and 7 females (50.0%) in their respective age groups living below the poverty level.
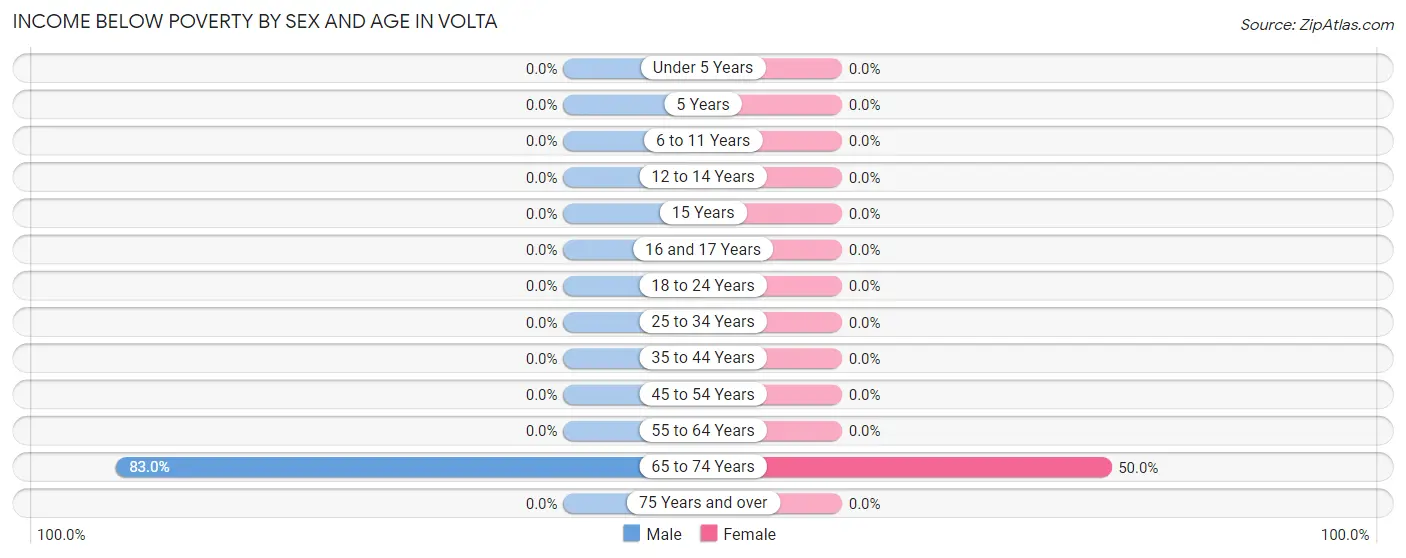
| Age Bracket | Male | Female |
| Under 5 Years | 0 (0.0%) | 0 (0.0%) |
| 5 Years | 0 (0.0%) | 0 (0.0%) |
| 6 to 11 Years | 0 (0.0%) | 0 (0.0%) |
| 12 to 14 Years | 0 (0.0%) | 0 (0.0%) |
| 15 Years | 0 (0.0%) | 0 (0.0%) |
| 16 and 17 Years | 0 (0.0%) | 0 (0.0%) |
| 18 to 24 Years | 0 (0.0%) | 0 (0.0%) |
| 25 to 34 Years | 0 (0.0%) | 0 (0.0%) |
| 35 to 44 Years | 0 (0.0%) | 0 (0.0%) |
| 45 to 54 Years | 0 (0.0%) | 0 (0.0%) |
| 55 to 64 Years | 0 (0.0%) | 0 (0.0%) |
| 65 to 74 Years | 39 (83.0%) | 7 (50.0%) |
| 75 Years and over | 0 (0.0%) | 0 (0.0%) |
| Total | 39 (21.9%) | 7 (6.1%) |
Income Above Poverty by Sex and Age in Volta
According to the poverty statistics in Volta, males aged 15 years and females aged 16 and 17 years are the age groups that are most secure financially, with 100.0% of males and 100.0% of females in these age groups living above the poverty line.
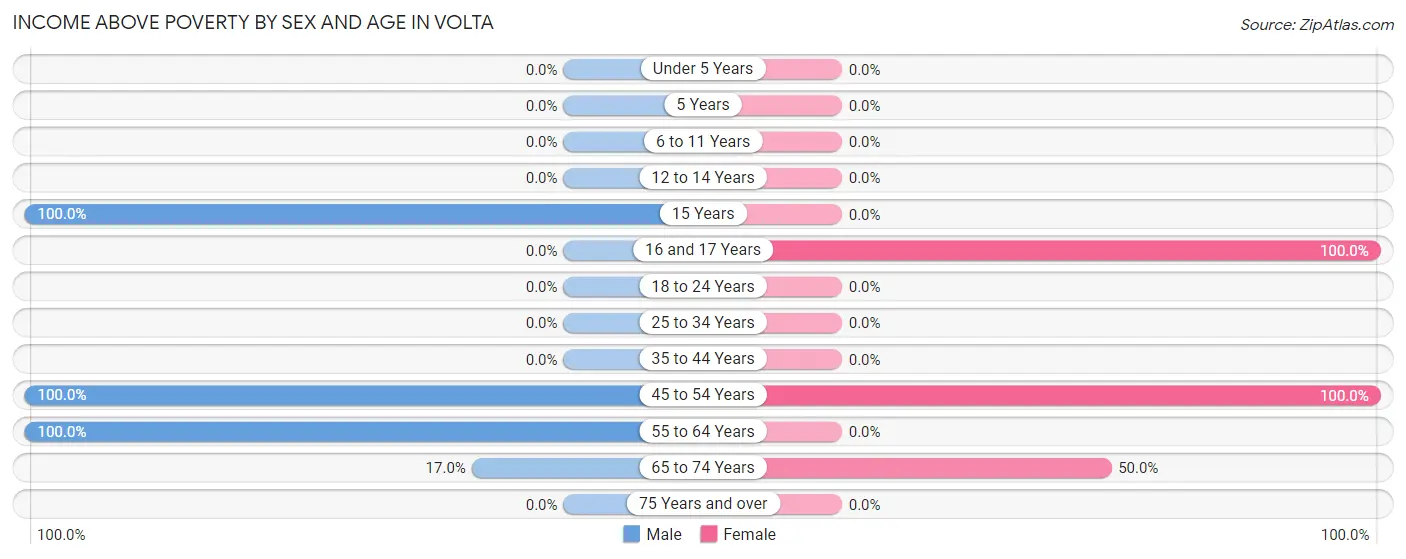
| Age Bracket | Male | Female |
| Under 5 Years | 0 (0.0%) | 0 (0.0%) |
| 5 Years | 0 (0.0%) | 0 (0.0%) |
| 6 to 11 Years | 0 (0.0%) | 0 (0.0%) |
| 12 to 14 Years | 0 (0.0%) | 0 (0.0%) |
| 15 Years | 39 (100.0%) | 0 (0.0%) |
| 16 and 17 Years | 0 (0.0%) | 51 (100.0%) |
| 18 to 24 Years | 0 (0.0%) | 0 (0.0%) |
| 25 to 34 Years | 0 (0.0%) | 0 (0.0%) |
| 35 to 44 Years | 0 (0.0%) | 0 (0.0%) |
| 45 to 54 Years | 48 (100.0%) | 49 (100.0%) |
| 55 to 64 Years | 44 (100.0%) | 0 (0.0%) |
| 65 to 74 Years | 8 (17.0%) | 7 (50.0%) |
| 75 Years and over | 0 (0.0%) | 0 (0.0%) |
| Total | 139 (78.1%) | 107 (93.9%) |
Income Below Poverty Among Married-Couple Families in Volta
| Children | Above Poverty | Below Poverty |
| No Children | 8 (100.0%) | 0 (0.0%) |
| 1 or 2 Children | 48 (100.0%) | 0 (0.0%) |
| 3 or 4 Children | 0 (0.0%) | 0 (0.0%) |
| 5 or more Children | 0 (0.0%) | 0 (0.0%) |
| Total | 56 (100.0%) | 0 (0.0%) |
Income Below Poverty Among Single-Parent Households in Volta
| Children | Single Father | Single Mother |
| No Children | 0 (0.0%) | 0 (0.0%) |
| 1 or 2 Children | 0 (0.0%) | 0 (0.0%) |
| 3 or 4 Children | 0 (0.0%) | 0 (0.0%) |
| 5 or more Children | 0 (0.0%) | 0 (0.0%) |
| Total | 0 (0.0%) | 0 (0.0%) |
Income Below Poverty Among Married-Couple vs Single-Parent Households in Volta
| Children | Married-Couple Families | Single-Parent Households |
| No Children | 0 (0.0%) | 0 (0.0%) |
| 1 or 2 Children | 0 (0.0%) | 0 (0.0%) |
| 3 or 4 Children | 0 (0.0%) | 0 (0.0%) |
| 5 or more Children | 0 (0.0%) | 0 (0.0%) |
| Total | 0 (0.0%) | 0 (0.0%) |
Race in Volta
The most populous races in Volta are Two or more Races (192 | 65.7%), Some other Race (78 | 26.7%), and Hispanic or Latino (34 | 11.6%).
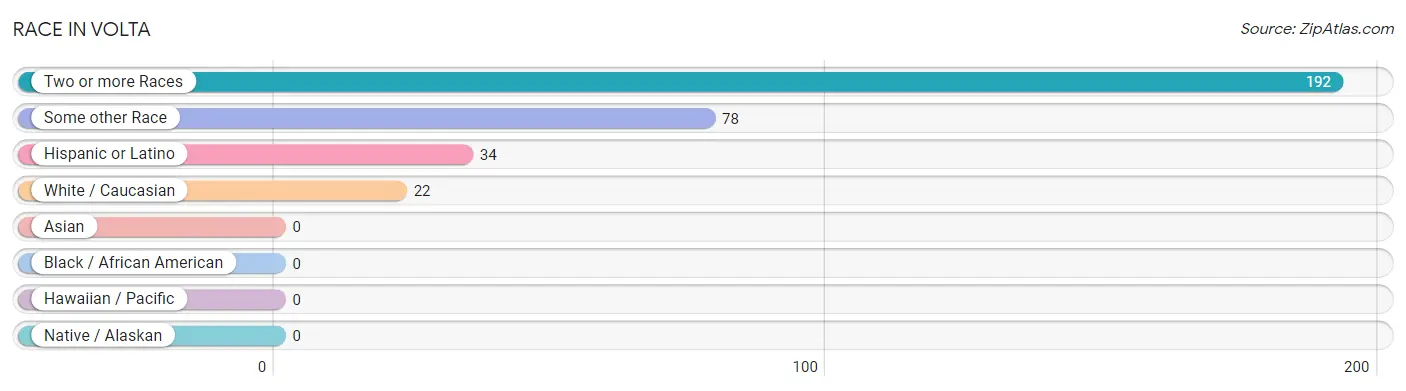
| Race | # Population | % Population |
| Asian | 0 | 0.0% |
| Black / African American | 0 | 0.0% |
| Hawaiian / Pacific | 0 | 0.0% |
| Hispanic or Latino | 34 | 11.6% |
| Native / Alaskan | 0 | 0.0% |
| White / Caucasian | 22 | 7.5% |
| Two or more Races | 192 | 65.7% |
| Some other Race | 78 | 26.7% |
| Total | 292 | 100.0% |
Ancestry in Volta
The most populous ancestries reported in Volta are German (192 | 65.7%), Bhutanese (187 | 64.0%), Portuguese (44 | 15.1%), Mexican (34 | 11.6%), and Irish (13 | 4.4%), together accounting for 160.9% of all Volta residents.
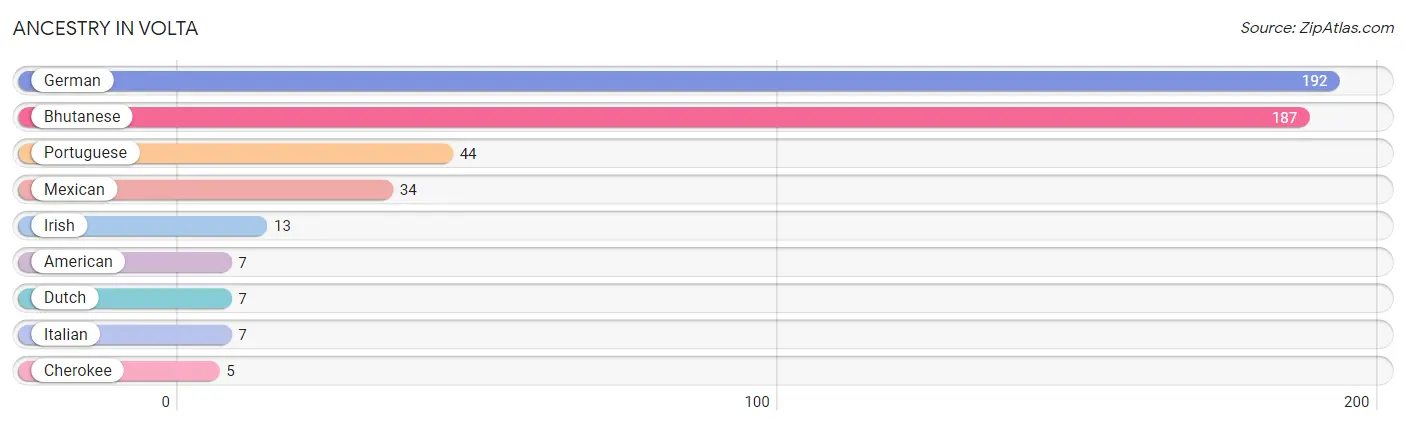
| Ancestry | # Population | % Population |
| American | 7 | 2.4% |
| Bhutanese | 187 | 64.0% |
| Cherokee | 5 | 1.7% |
| Dutch | 7 | 2.4% |
| German | 192 | 65.7% |
| Irish | 13 | 4.4% |
| Italian | 7 | 2.4% |
| Mexican | 34 | 11.6% |
| Portuguese | 44 | 15.1% | View All 9 Rows |
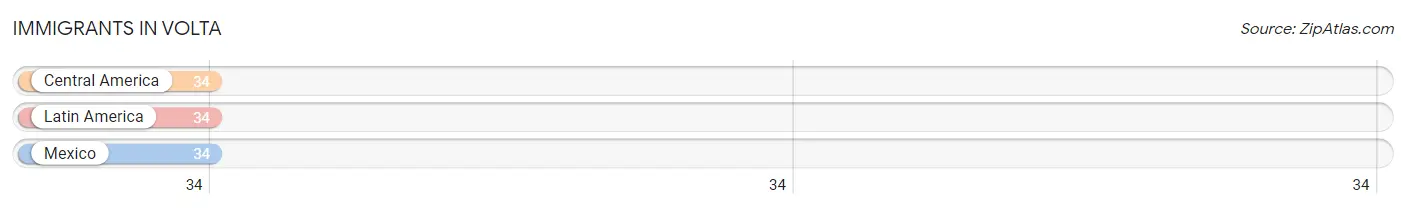
Immigrants in Volta
The most numerous immigrant groups reported in Volta came from Central America (34 | 11.6%), Latin America (34 | 11.6%), and Mexico (34 | 11.6%), together accounting for 34.9% of all Volta residents.
| Immigration Origin | # Population | % Population |
| Central America | 34 | 11.6% |
| Latin America | 34 | 11.6% |
| Mexico | 34 | 11.6% | View All 3 Rows |
Sex and Age in Volta
Sex and Age in Volta
The most populous age groups in Volta are 45 to 49 Years (48 | 27.0%) for men and 15 to 19 Years (51 | 44.7%) for women.
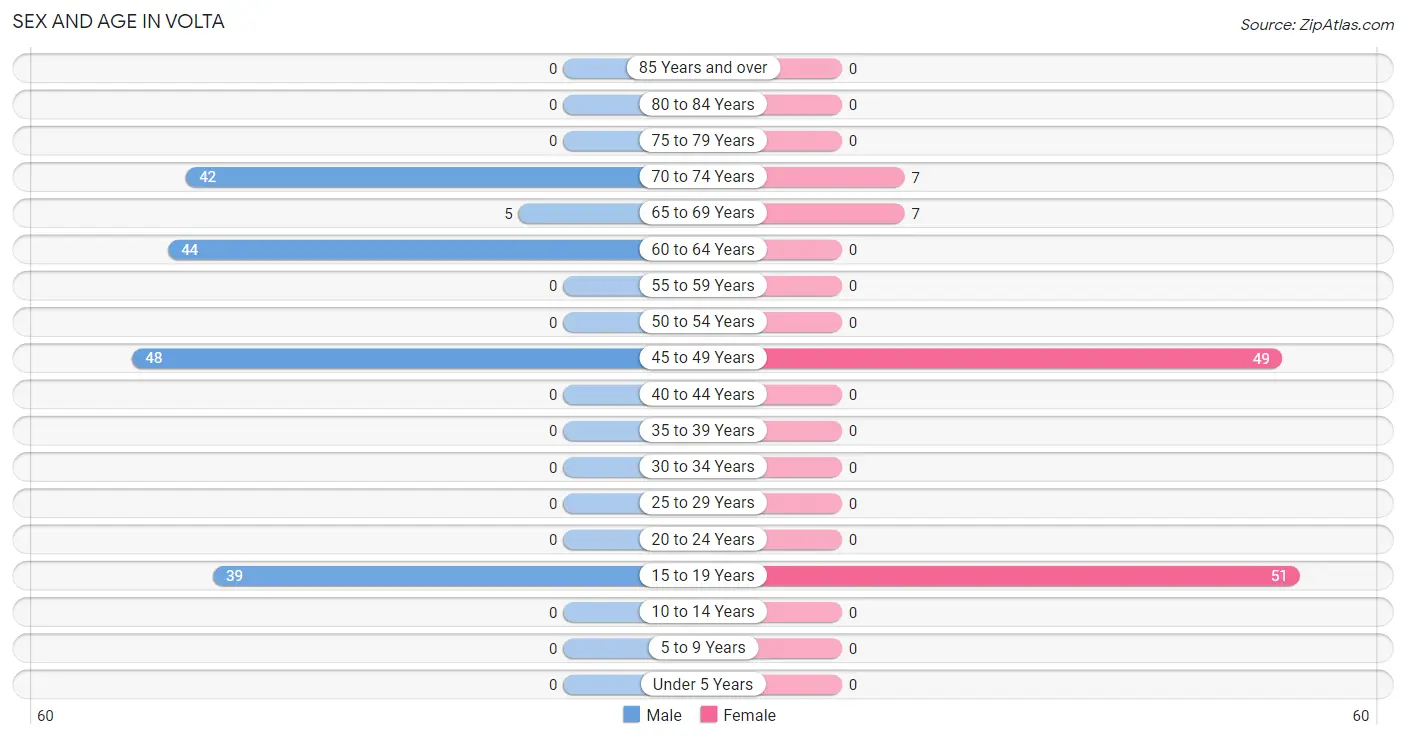
| Age Bracket | Male | Female |
| Under 5 Years | 0 (0.0%) | 0 (0.0%) |
| 5 to 9 Years | 0 (0.0%) | 0 (0.0%) |
| 10 to 14 Years | 0 (0.0%) | 0 (0.0%) |
| 15 to 19 Years | 39 (21.9%) | 51 (44.7%) |
| 20 to 24 Years | 0 (0.0%) | 0 (0.0%) |
| 25 to 29 Years | 0 (0.0%) | 0 (0.0%) |
| 30 to 34 Years | 0 (0.0%) | 0 (0.0%) |
| 35 to 39 Years | 0 (0.0%) | 0 (0.0%) |
| 40 to 44 Years | 0 (0.0%) | 0 (0.0%) |
| 45 to 49 Years | 48 (27.0%) | 49 (43.0%) |
| 50 to 54 Years | 0 (0.0%) | 0 (0.0%) |
| 55 to 59 Years | 0 (0.0%) | 0 (0.0%) |
| 60 to 64 Years | 44 (24.7%) | 0 (0.0%) |
| 65 to 69 Years | 5 (2.8%) | 7 (6.1%) |
| 70 to 74 Years | 42 (23.6%) | 7 (6.1%) |
| 75 to 79 Years | 0 (0.0%) | 0 (0.0%) |
| 80 to 84 Years | 0 (0.0%) | 0 (0.0%) |
| 85 Years and over | 0 (0.0%) | 0 (0.0%) |
| Total | 178 (100.0%) | 114 (100.0%) |
Families and Households in Volta
Median Family Size in Volta
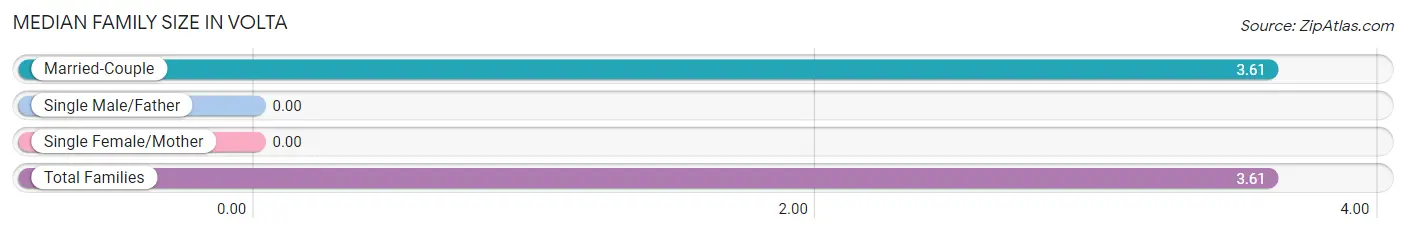
| Family Type | # Families | Family Size |
| Married-Couple | 56 (100.0%) | 3.61 |
| Single Male/Father | 0 (0.0%) | - |
| Single Female/Mother | 0 (0.0%) | - |
| Total Families | 56 (100.0%) | 3.61 |
Median Household Size in Volta
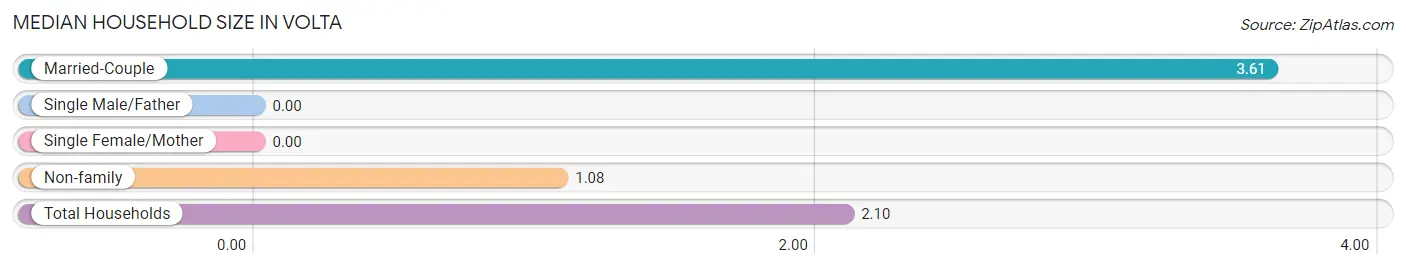
| Household Type | # Households | Household Size |
| Married-Couple | 56 (40.3%) | 3.61 |
| Single Male/Father | 0 (0.0%) | - |
| Single Female/Mother | 0 (0.0%) | - |
| Non-family | 83 (59.7%) | 1.08 |
| Total Households | 139 (100.0%) | 2.10 |
Household Size by Marriage Status in Volta
Out of a total of 139 households in Volta, 56 (40.3%) are family households, while 83 (59.7%) are nonfamily households. The most numerous type of family households are 4-person households, comprising 48, and the most common type of nonfamily households are 1-person households, comprising 78.
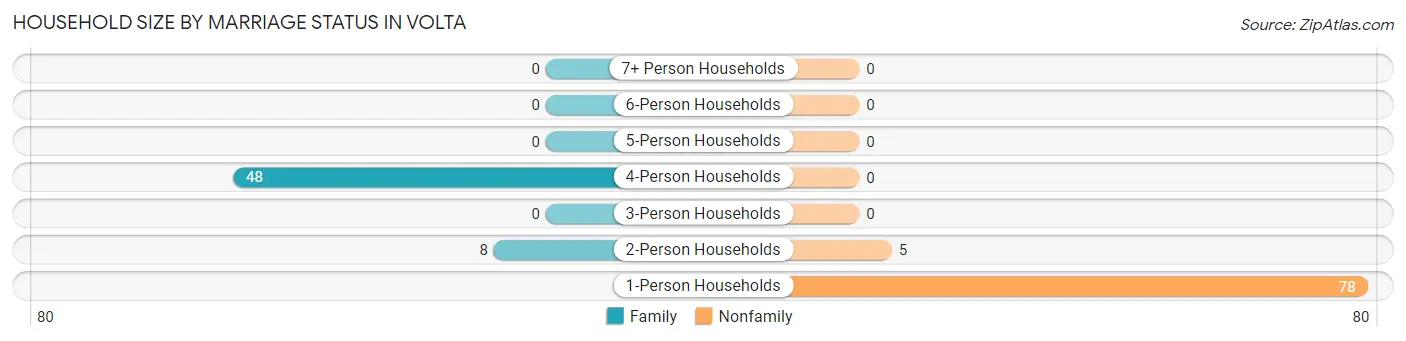
| Household Size | Family Households | Nonfamily Households |
| 1-Person Households | - | 78 (56.1%) |
| 2-Person Households | 8 (5.8%) | 5 (3.6%) |
| 3-Person Households | 0 (0.0%) | 0 (0.0%) |
| 4-Person Households | 48 (34.5%) | 0 (0.0%) |
| 5-Person Households | 0 (0.0%) | 0 (0.0%) |
| 6-Person Households | 0 (0.0%) | 0 (0.0%) |
| 7+ Person Households | 0 (0.0%) | 0 (0.0%) |
| Total | 56 (40.3%) | 83 (59.7%) |
Female Fertility in Volta
Fertility by Age in Volta
| Age Bracket | Women with Births | Births / 1,000 Women |
| 15 to 19 years | 0 (0.0%) | 0.0 |
| 20 to 34 years | 0 (0.0%) | 0.0 |
| 35 to 50 years | 0 (0.0%) | 0.0 |
| Total | 0 (0.0%) | 0.0 |
Fertility by Age by Marriage Status in Volta
| Age Bracket | Married | Unmarried |
| 15 to 19 years | 0 (0.0%) | 0 (0.0%) |
| 20 to 34 years | 0 (0.0%) | 0 (0.0%) |
| 35 to 50 years | 0 (0.0%) | 0 (0.0%) |
| Total | 0 (0.0%) | 0 (0.0%) |
Fertility by Education in Volta
| Educational Attainment | Women with Births | Births / 1,000 Women |
| Less than High School | 0 (0.0%) | 0.0 |
| High School Diploma | 0 (0.0%) | 0.0 |
| College or Associate's Degree | 0 (0.0%) | 0.0 |
| Bachelor's Degree | 0 (0.0%) | 0.0 |
| Graduate Degree | 0 (0.0%) | 0.0 |
| Total | 0 (0.0%) | 0.0 |
Fertility by Education by Marriage Status in Volta
| Educational Attainment | Married | Unmarried |
| Less than High School | 0 (0.0%) | 0 (0.0%) |
| High School Diploma | 0 (0.0%) | 0 (0.0%) |
| College or Associate's Degree | 0 (0.0%) | 0 (0.0%) |
| Bachelor's Degree | 0 (0.0%) | 0 (0.0%) |
| Graduate Degree | 0 (0.0%) | 0 (0.0%) |
| Total | 0 (0.0%) | 0 (0.0%) |
Employment Characteristics in Volta
Employment by Class of Employer in Volta
Among the 148 employed individuals in Volta, private company employees (99 | 66.9%), and state government employees (49 | 33.1%) make up the most common classes of employment.
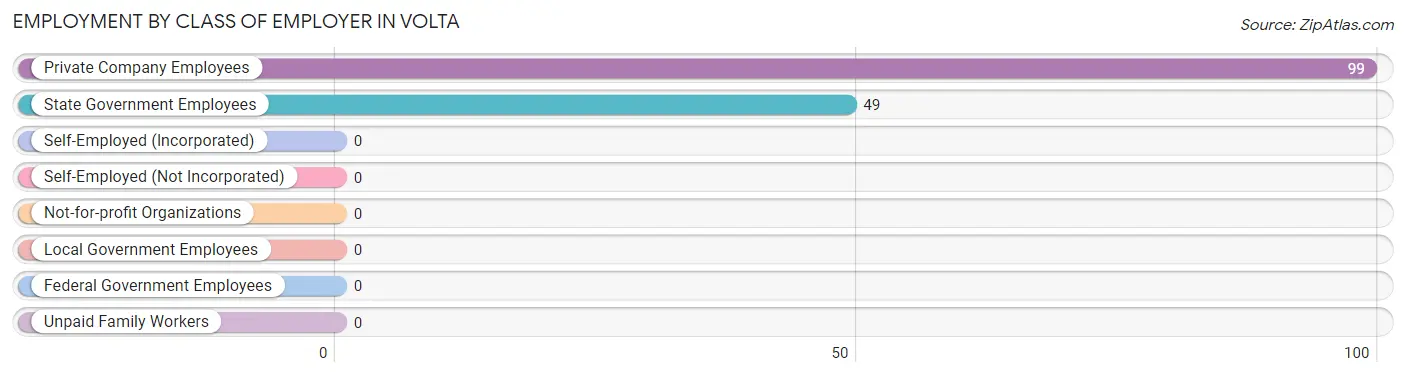
| Employer Class | # Employees | % Employees |
| Private Company Employees | 99 | 66.9% |
| Self-Employed (Incorporated) | 0 | 0.0% |
| Self-Employed (Not Incorporated) | 0 | 0.0% |
| Not-for-profit Organizations | 0 | 0.0% |
| Local Government Employees | 0 | 0.0% |
| State Government Employees | 49 | 33.1% |
| Federal Government Employees | 0 | 0.0% |
| Unpaid Family Workers | 0 | 0.0% |
| Total | 148 | 100.0% |
Employment Status by Age in Volta
According to the labor force statistics for Volta, out of the total population over 16 years of age (253), 78.7% or 199 individuals are in the labor force, with 25.6% or 51 of them unemployed. The age group with the highest labor force participation rate is 16 to 19 years, with 100.0% or 51 individuals in the labor force. Within the labor force, the 16 to 19 years age range has the highest percentage of unemployed individuals, with 100.0% or 51 of them being unemployed.
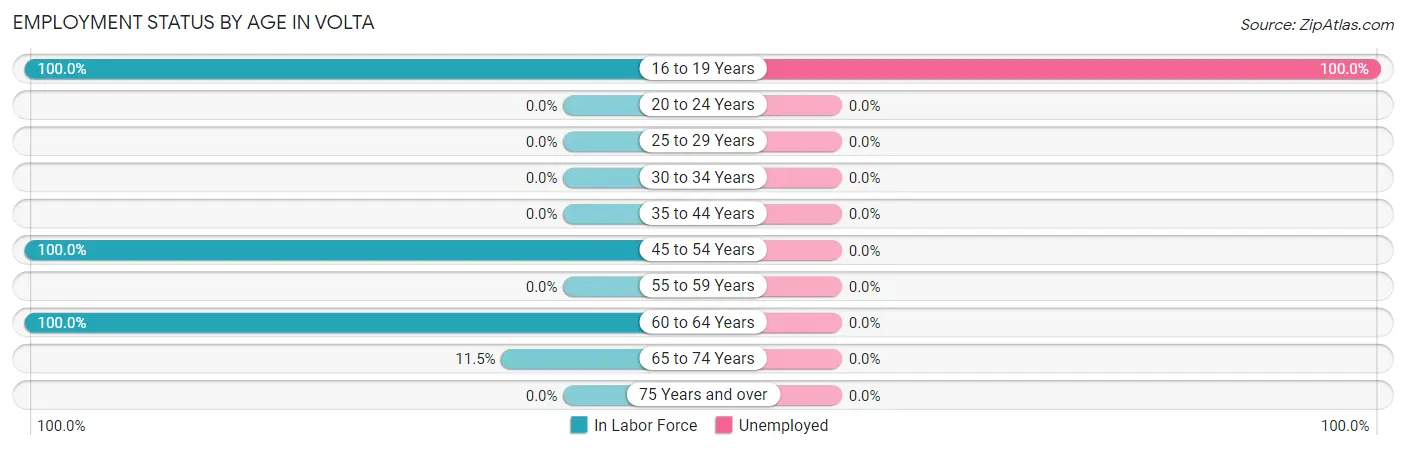
| Age Bracket | In Labor Force | Unemployed |
| 16 to 19 Years | 51 (100.0%) | 51 (100.0%) |
| 20 to 24 Years | 0 (0.0%) | 0 (0.0%) |
| 25 to 29 Years | 0 (0.0%) | 0 (0.0%) |
| 30 to 34 Years | 0 (0.0%) | 0 (0.0%) |
| 35 to 44 Years | 0 (0.0%) | 0 (0.0%) |
| 45 to 54 Years | 97 (100.0%) | 0 (0.0%) |
| 55 to 59 Years | 0 (0.0%) | 0 (0.0%) |
| 60 to 64 Years | 44 (100.0%) | 0 (0.0%) |
| 65 to 74 Years | 7 (11.5%) | 0 (0.0%) |
| 75 Years and over | 0 (0.0%) | 0 (0.0%) |
| Total | 199 (78.7%) | 51 (25.6%) |
Employment Status by Educational Attainment in Volta
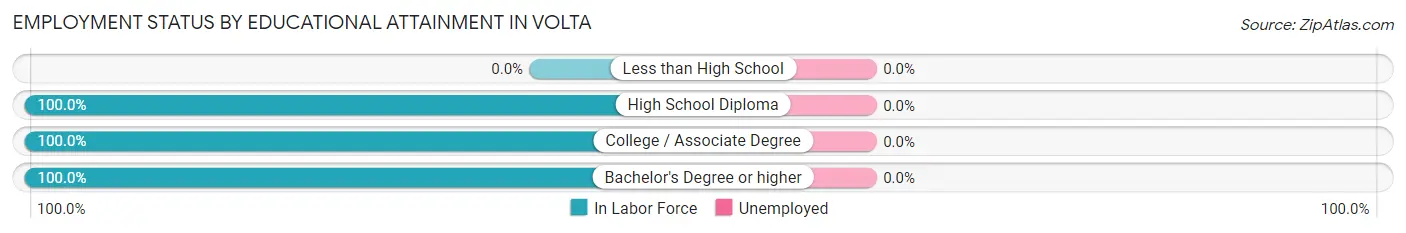
| Educational Attainment | In Labor Force | Unemployed |
| Less than High School | 0 (0.0%) | 0 (0.0%) |
| High School Diploma | 44 (100.0%) | 0 (0.0%) |
| College / Associate Degree | 48 (100.0%) | 0 (0.0%) |
| Bachelor's Degree or higher | 49 (100.0%) | 0 (0.0%) |
| Total | 141 (100.0%) | 0 (0.0%) |
Employment Occupations by Sex in Volta
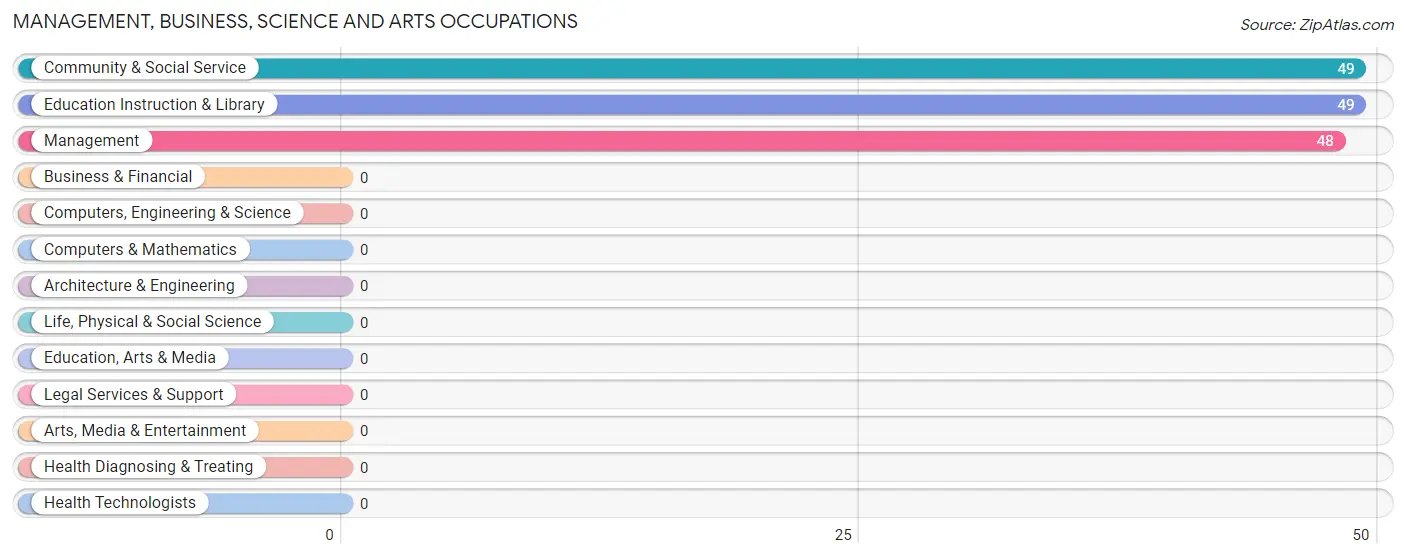
Management, Business, Science and Arts Occupations
The most common Management, Business, Science and Arts occupations in Volta are Community & Social Service (49 | 33.1%), Education Instruction & Library (49 | 33.1%), and Management (48 | 32.4%).
Management, Business, Science and Arts Occupations by Sex
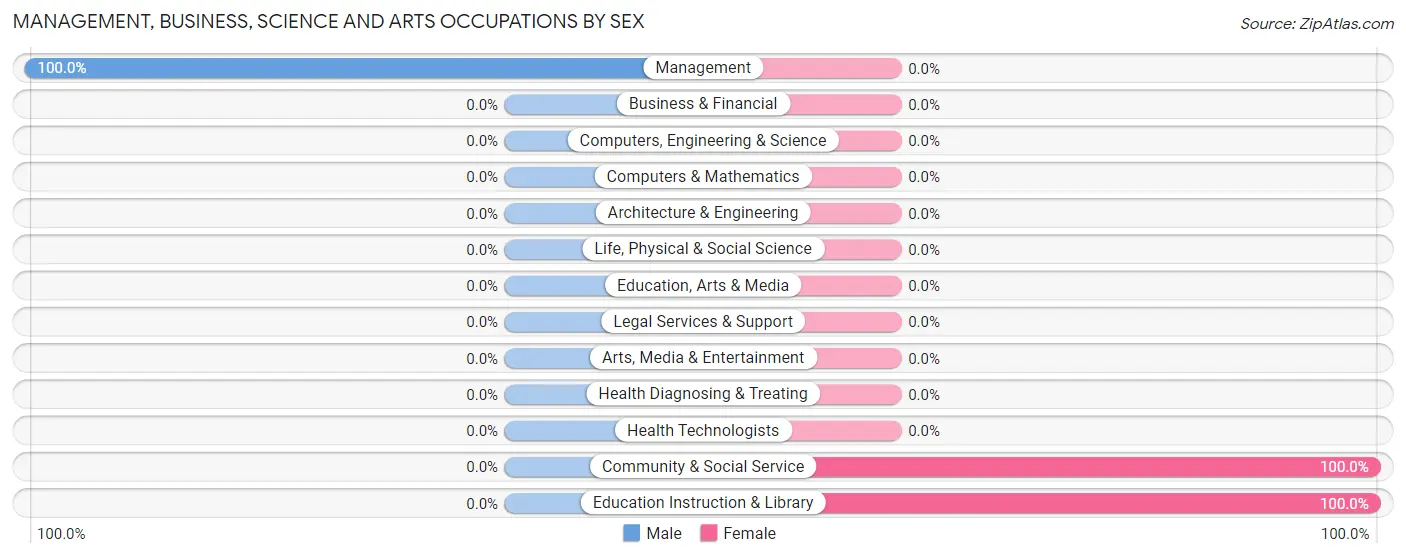
| Occupation | Male | Female |
| Management | 48 (100.0%) | 0 (0.0%) |
| Business & Financial | 0 (0.0%) | 0 (0.0%) |
| Computers, Engineering & Science | 0 (0.0%) | 0 (0.0%) |
| Computers & Mathematics | 0 (0.0%) | 0 (0.0%) |
| Architecture & Engineering | 0 (0.0%) | 0 (0.0%) |
| Life, Physical & Social Science | 0 (0.0%) | 0 (0.0%) |
| Community & Social Service | 0 (0.0%) | 49 (100.0%) |
| Education, Arts & Media | 0 (0.0%) | 0 (0.0%) |
| Legal Services & Support | 0 (0.0%) | 0 (0.0%) |
| Education Instruction & Library | 0 (0.0%) | 49 (100.0%) |
| Arts, Media & Entertainment | 0 (0.0%) | 0 (0.0%) |
| Health Diagnosing & Treating | 0 (0.0%) | 0 (0.0%) |
| Health Technologists | 0 (0.0%) | 0 (0.0%) |
| Total (Category) | 48 (49.5%) | 49 (50.5%) |
| Total (Overall) | 92 (62.2%) | 56 (37.8%) |
Services Occupations
Services Occupations by Sex
| Occupation | Male | Female |
| Healthcare Support | 0 (0.0%) | 0 (0.0%) |
| Security & Protection | 0 (0.0%) | 0 (0.0%) |
| Firefighting & Prevention | 0 (0.0%) | 0 (0.0%) |
| Law Enforcement | 0 (0.0%) | 0 (0.0%) |
| Food Preparation & Serving | 0 (0.0%) | 0 (0.0%) |
| Cleaning & Maintenance | 0 (0.0%) | 0 (0.0%) |
| Personal Care & Service | 0 (0.0%) | 0 (0.0%) |
| Total (Category) | 0 (0.0%) | 0 (0.0%) |
| Total (Overall) | 92 (62.2%) | 56 (37.8%) |
Sales and Office Occupations
The most common Sales and Office occupations in Volta are , and Office & Administration (7 | 4.7%).

Sales and Office Occupations by Sex
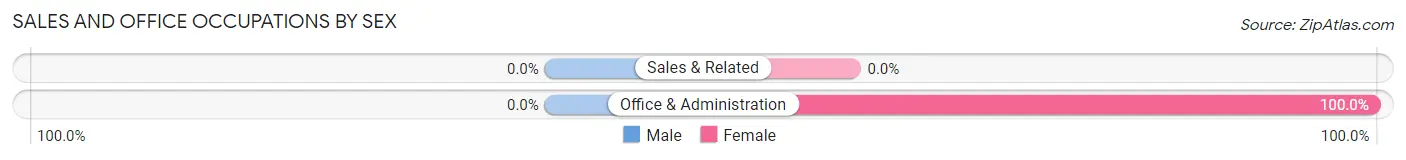
| Occupation | Male | Female |
| Sales & Related | 0 (0.0%) | 0 (0.0%) |
| Office & Administration | 0 (0.0%) | 7 (100.0%) |
| Total (Category) | 0 (0.0%) | 7 (100.0%) |
| Total (Overall) | 92 (62.2%) | 56 (37.8%) |
Natural Resources, Construction and Maintenance Occupations

Natural Resources, Construction and Maintenance Occupations by Sex
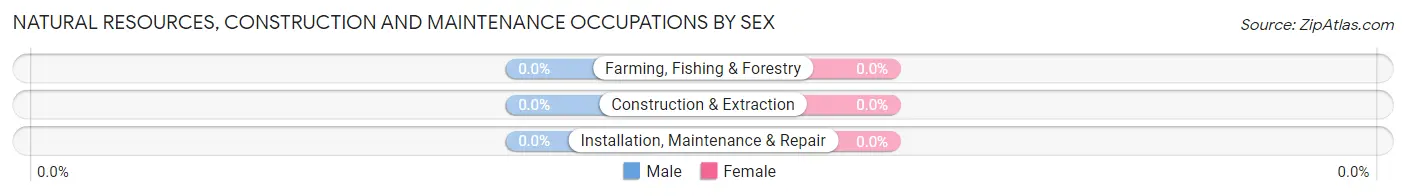
| Occupation | Male | Female |
| Farming, Fishing & Forestry | 0 (0.0%) | 0 (0.0%) |
| Construction & Extraction | 0 (0.0%) | 0 (0.0%) |
| Installation, Maintenance & Repair | 0 (0.0%) | 0 (0.0%) |
| Total (Category) | 0 (0.0%) | 0 (0.0%) |
| Total (Overall) | 92 (62.2%) | 56 (37.8%) |
Production, Transportation and Moving Occupations
The most common Production, Transportation and Moving occupations in Volta are , and Transportation (44 | 29.7%).
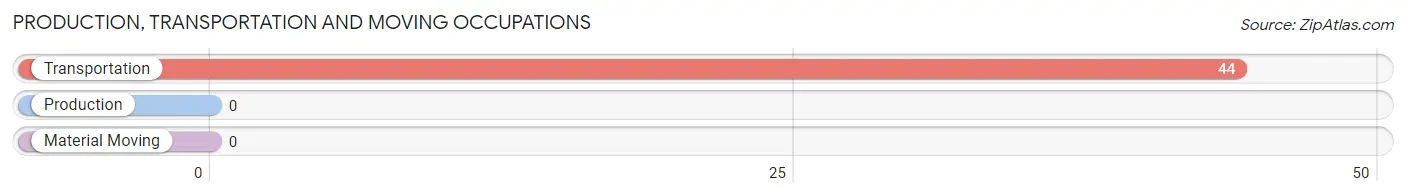
Production, Transportation and Moving Occupations by Sex
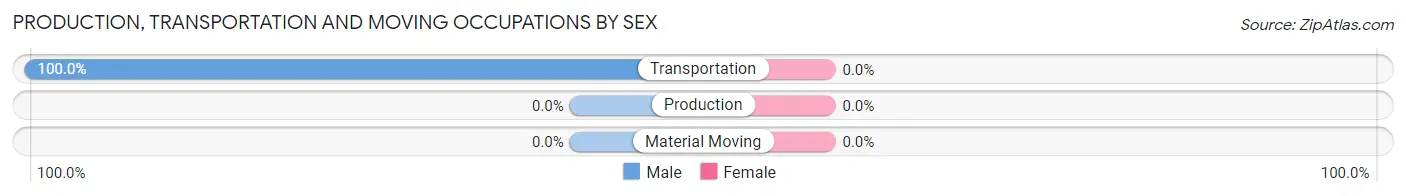
| Occupation | Male | Female |
| Production | 0 (0.0%) | 0 (0.0%) |
| Transportation | 44 (100.0%) | 0 (0.0%) |
| Material Moving | 0 (0.0%) | 0 (0.0%) |
| Total (Category) | 44 (100.0%) | 0 (0.0%) |
| Total (Overall) | 92 (62.2%) | 56 (37.8%) |
Employment Industries by Sex in Volta
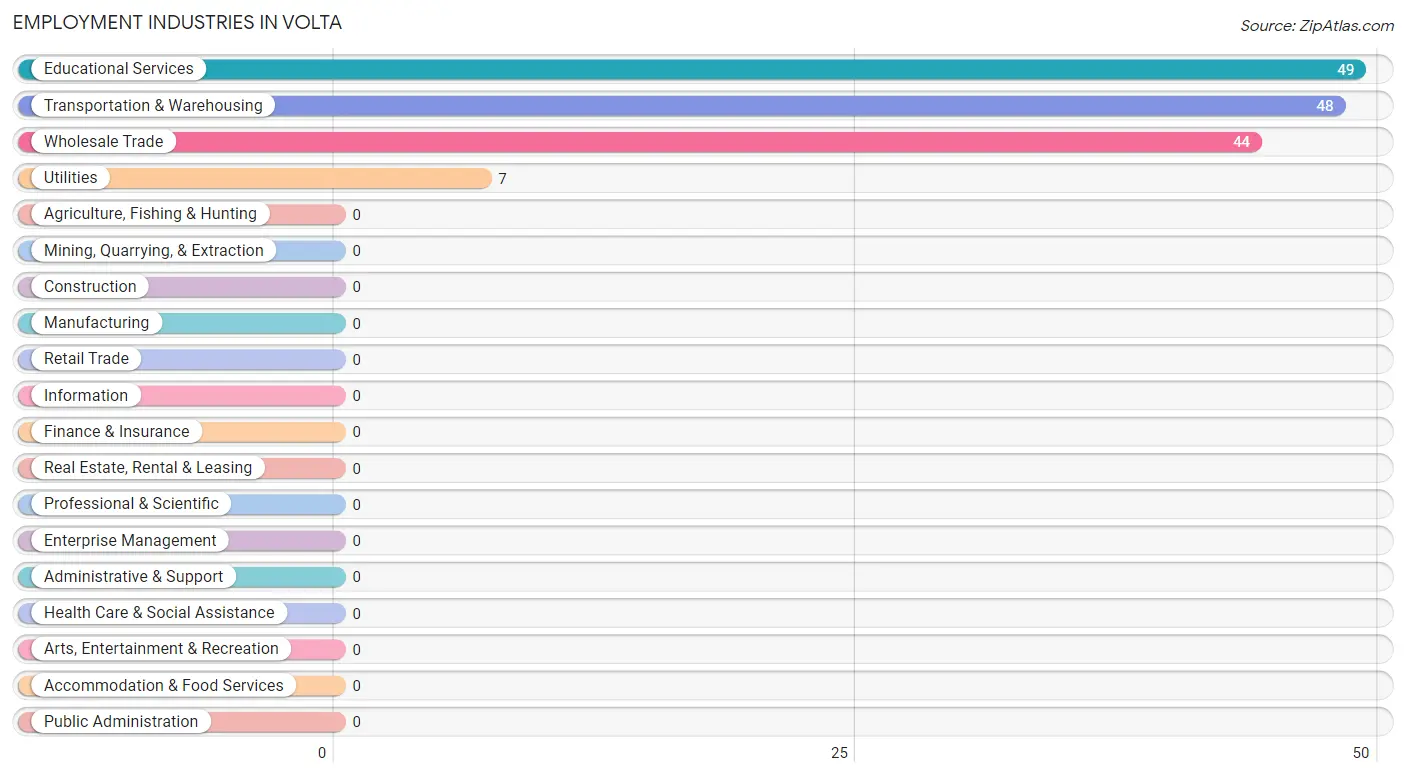
Employment Industries in Volta
The major employment industries in Volta include Educational Services (49 | 33.1%), Transportation & Warehousing (48 | 32.4%), Wholesale Trade (44 | 29.7%), and Utilities (7 | 4.7%).
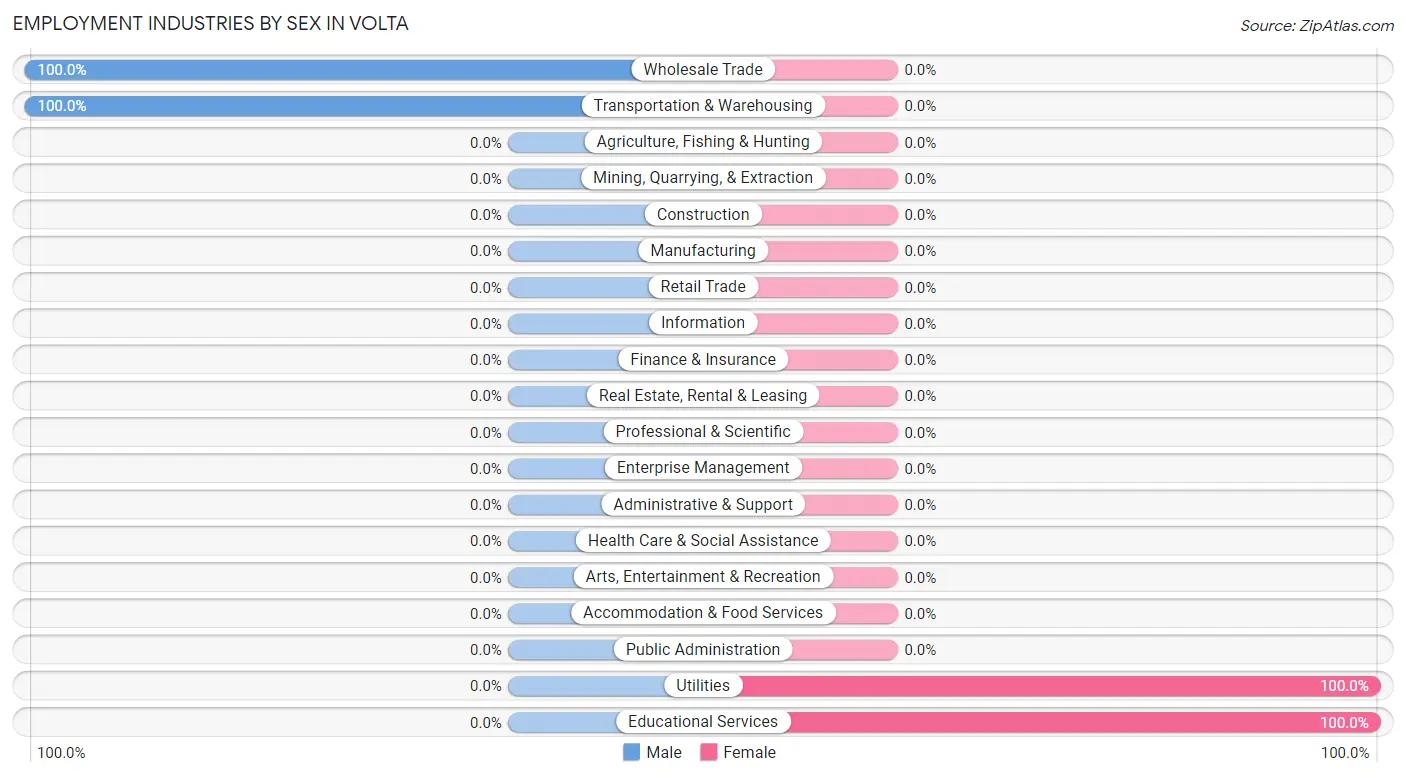
Employment Industries by Sex in Volta
The Volta industries that see more men than women are Wholesale Trade (100.0%), and Transportation & Warehousing (100.0%), whereas the industries that tend to have a higher number of women are Utilities (100.0%), and Educational Services (100.0%).
| Industry | Male | Female |
| Agriculture, Fishing & Hunting | 0 (0.0%) | 0 (0.0%) |
| Mining, Quarrying, & Extraction | 0 (0.0%) | 0 (0.0%) |
| Construction | 0 (0.0%) | 0 (0.0%) |
| Manufacturing | 0 (0.0%) | 0 (0.0%) |
| Wholesale Trade | 44 (100.0%) | 0 (0.0%) |
| Retail Trade | 0 (0.0%) | 0 (0.0%) |
| Transportation & Warehousing | 48 (100.0%) | 0 (0.0%) |
| Utilities | 0 (0.0%) | 7 (100.0%) |
| Information | 0 (0.0%) | 0 (0.0%) |
| Finance & Insurance | 0 (0.0%) | 0 (0.0%) |
| Real Estate, Rental & Leasing | 0 (0.0%) | 0 (0.0%) |
| Professional & Scientific | 0 (0.0%) | 0 (0.0%) |
| Enterprise Management | 0 (0.0%) | 0 (0.0%) |
| Administrative & Support | 0 (0.0%) | 0 (0.0%) |
| Educational Services | 0 (0.0%) | 49 (100.0%) |
| Health Care & Social Assistance | 0 (0.0%) | 0 (0.0%) |
| Arts, Entertainment & Recreation | 0 (0.0%) | 0 (0.0%) |
| Accommodation & Food Services | 0 (0.0%) | 0 (0.0%) |
| Public Administration | 0 (0.0%) | 0 (0.0%) |
| Total | 92 (62.2%) | 56 (37.8%) |
Education in Volta
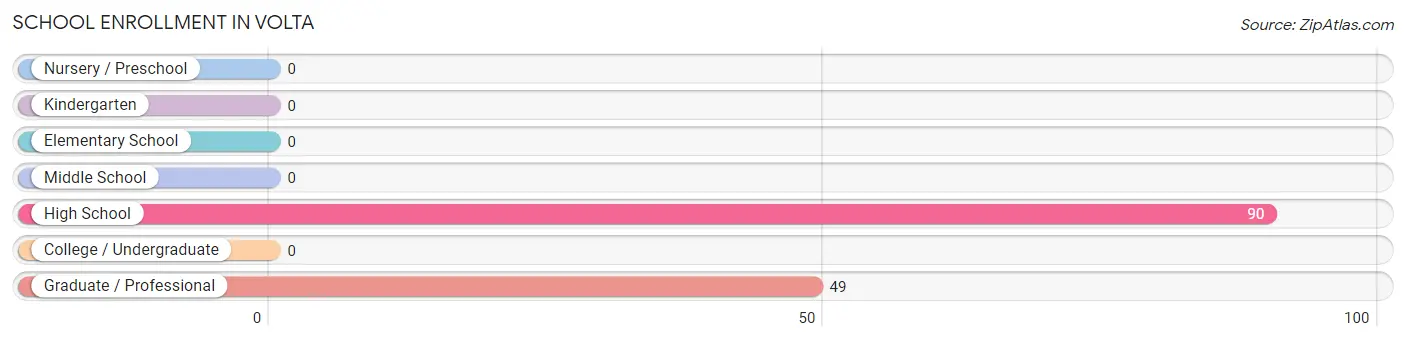
School Enrollment in Volta
The most common levels of schooling among the 139 students in Volta are high school (90 | 64.7%), and graduate / professional (49 | 35.2%).
| School Level | # Students | % Students |
| Nursery / Preschool | 0 | 0.0% |
| Kindergarten | 0 | 0.0% |
| Elementary School | 0 | 0.0% |
| Middle School | 0 | 0.0% |
| High School | 90 | 64.7% |
| College / Undergraduate | 0 | 0.0% |
| Graduate / Professional | 49 | 35.2% |
| Total | 139 | 100.0% |
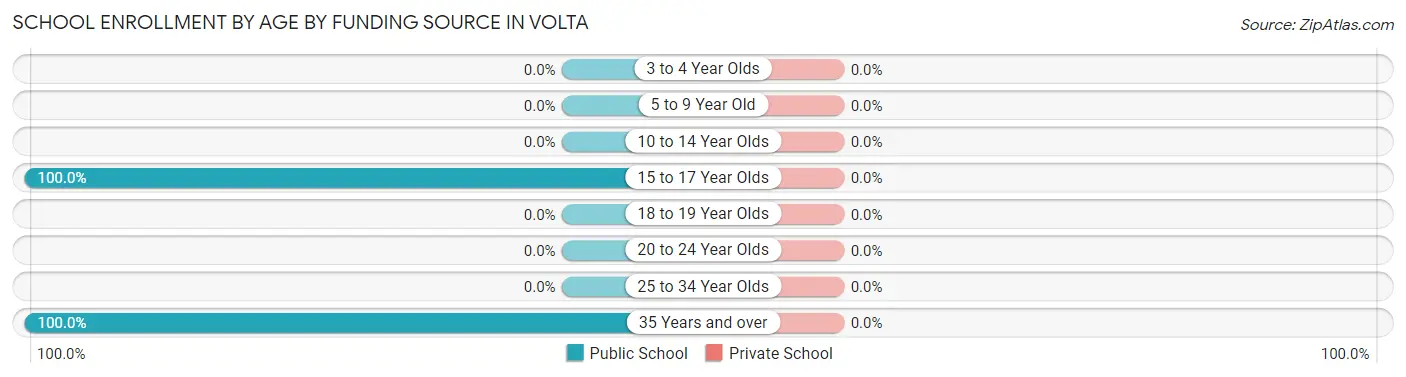
School Enrollment by Age by Funding Source in Volta
| Age Bracket | Public School | Private School |
| 3 to 4 Year Olds | 0 (0.0%) | 0 (0.0%) |
| 5 to 9 Year Old | 0 (0.0%) | 0 (0.0%) |
| 10 to 14 Year Olds | 0 (0.0%) | 0 (0.0%) |
| 15 to 17 Year Olds | 90 (100.0%) | 0 (0.0%) |
| 18 to 19 Year Olds | 0 (0.0%) | 0 (0.0%) |
| 20 to 24 Year Olds | 0 (0.0%) | 0 (0.0%) |
| 25 to 34 Year Olds | 0 (0.0%) | 0 (0.0%) |
| 35 Years and over | 49 (100.0%) | 0 (0.0%) |
| Total | 139 (100.0%) | 0 (0.0%) |
Educational Attainment by Field of Study in Volta
, and engineering (49 | 100.0%) are the most common fields of study among 49 individuals in Volta who have obtained a bachelor's degree or higher.
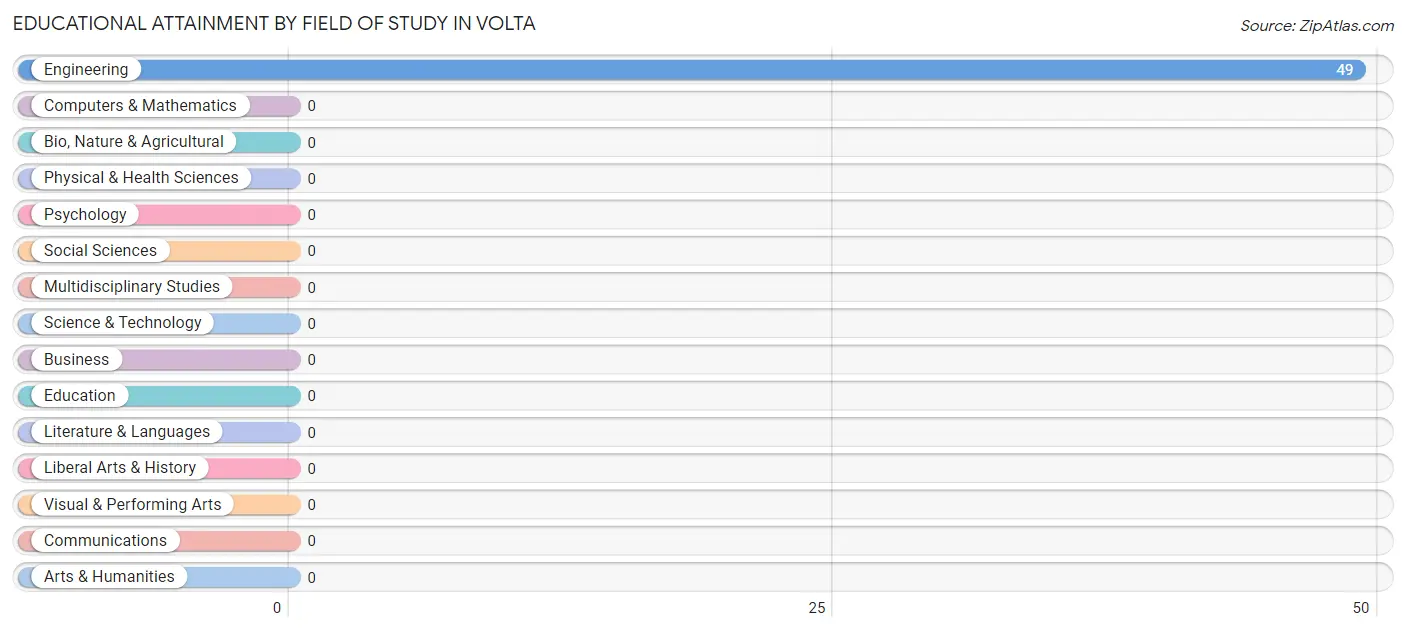
| Field of Study | # Graduates | % Graduates |
| Computers & Mathematics | 0 | 0.0% |
| Bio, Nature & Agricultural | 0 | 0.0% |
| Physical & Health Sciences | 0 | 0.0% |
| Psychology | 0 | 0.0% |
| Social Sciences | 0 | 0.0% |
| Engineering | 49 | 100.0% |
| Multidisciplinary Studies | 0 | 0.0% |
| Science & Technology | 0 | 0.0% |
| Business | 0 | 0.0% |
| Education | 0 | 0.0% |
| Literature & Languages | 0 | 0.0% |
| Liberal Arts & History | 0 | 0.0% |
| Visual & Performing Arts | 0 | 0.0% |
| Communications | 0 | 0.0% |
| Arts & Humanities | 0 | 0.0% |
| Total | 49 | 100.0% |
Transportation & Commute in Volta
Vehicle Availability by Sex in Volta
The most prevalent vehicle ownership categories in Volta are males with 3 vehicles (48, accounting for 52.2%) and females with 3 vehicles (49, making up 85.7%).
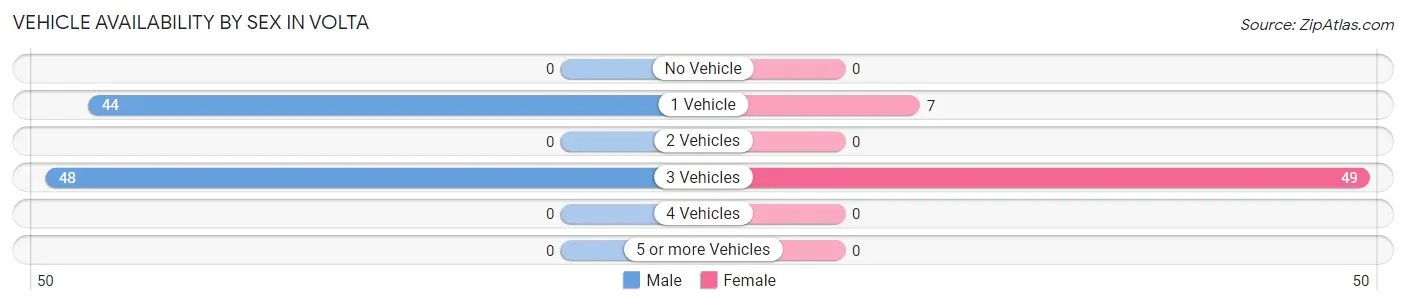
| Vehicles Available | Male | Female |
| No Vehicle | 0 (0.0%) | 0 (0.0%) |
| 1 Vehicle | 44 (47.8%) | 7 (12.5%) |
| 2 Vehicles | 0 (0.0%) | 0 (0.0%) |
| 3 Vehicles | 48 (52.2%) | 49 (87.5%) |
| 4 Vehicles | 0 (0.0%) | 0 (0.0%) |
| 5 or more Vehicles | 0 (0.0%) | 0 (0.0%) |
| Total | 92 (100.0%) | 56 (100.0%) |
Commute Time in Volta
The most frequently occuring commute durations in Volta are 40 to 44 minutes (49 commuters, 34.7%), 90 or more minutes (48 commuters, 34.0%), and 10 to 14 minutes (44 commuters, 31.2%).
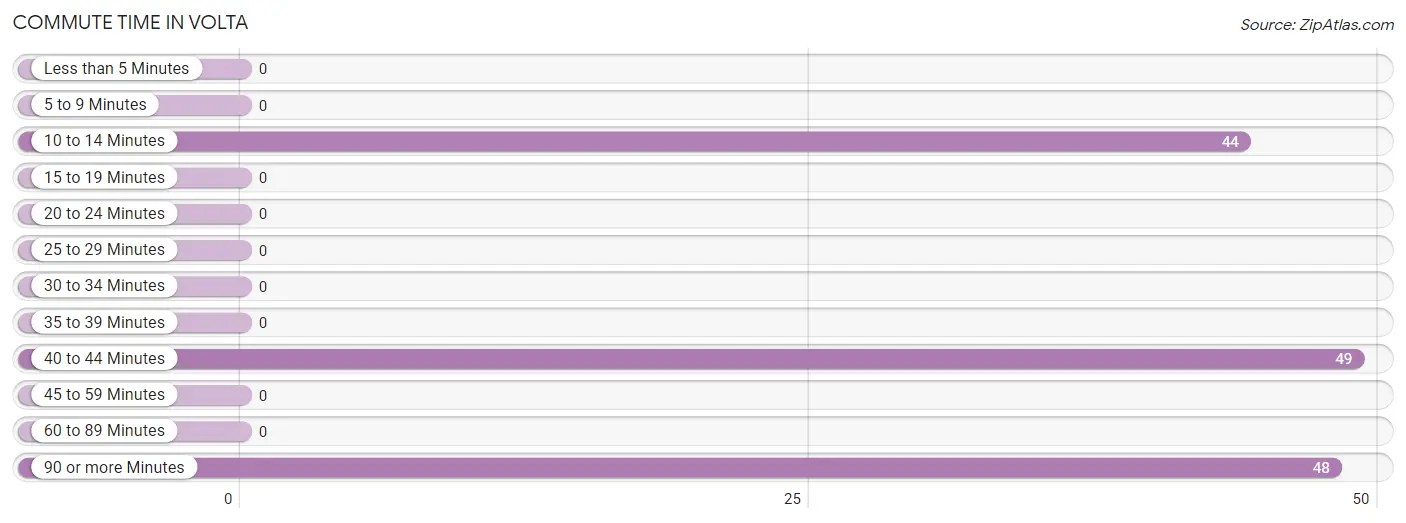
| Commute Time | # Commuters | % Commuters |
| Less than 5 Minutes | 0 | 0.0% |
| 5 to 9 Minutes | 0 | 0.0% |
| 10 to 14 Minutes | 44 | 31.2% |
| 15 to 19 Minutes | 0 | 0.0% |
| 20 to 24 Minutes | 0 | 0.0% |
| 25 to 29 Minutes | 0 | 0.0% |
| 30 to 34 Minutes | 0 | 0.0% |
| 35 to 39 Minutes | 0 | 0.0% |
| 40 to 44 Minutes | 49 | 34.7% |
| 45 to 59 Minutes | 0 | 0.0% |
| 60 to 89 Minutes | 0 | 0.0% |
| 90 or more Minutes | 48 | 34.0% |
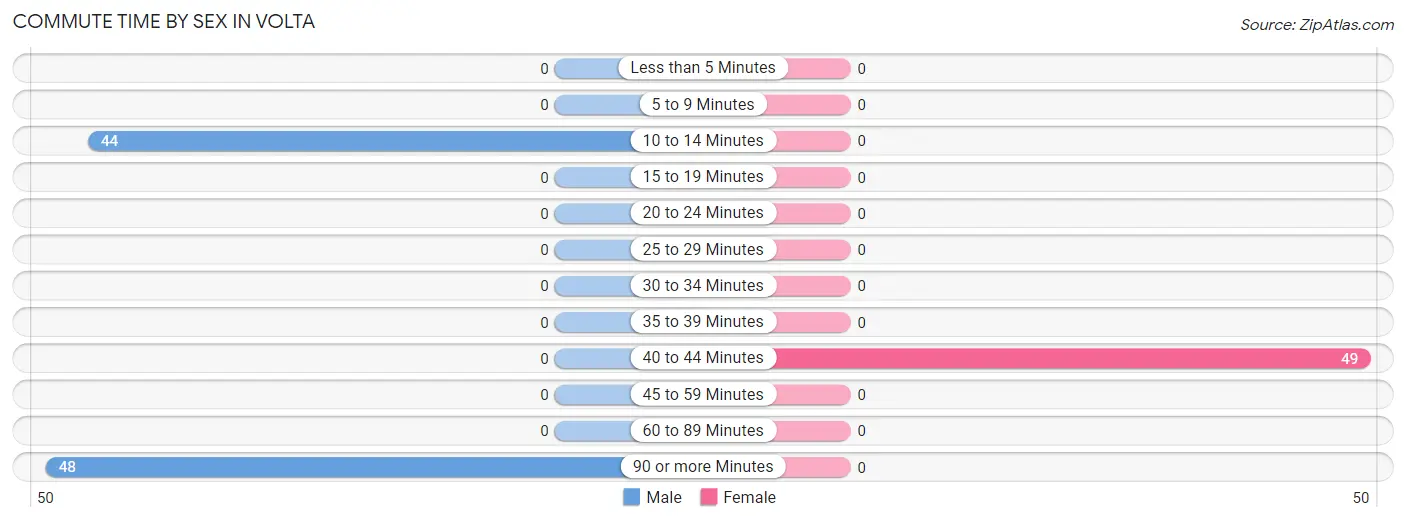
Commute Time by Sex in Volta
The most common commute times in Volta are 90 or more minutes (48 commuters, 52.2%) for males and 40 to 44 minutes (49 commuters, 100.0%) for females.
| Commute Time | Male | Female |
| Less than 5 Minutes | 0 (0.0%) | 0 (0.0%) |
| 5 to 9 Minutes | 0 (0.0%) | 0 (0.0%) |
| 10 to 14 Minutes | 44 (47.8%) | 0 (0.0%) |
| 15 to 19 Minutes | 0 (0.0%) | 0 (0.0%) |
| 20 to 24 Minutes | 0 (0.0%) | 0 (0.0%) |
| 25 to 29 Minutes | 0 (0.0%) | 0 (0.0%) |
| 30 to 34 Minutes | 0 (0.0%) | 0 (0.0%) |
| 35 to 39 Minutes | 0 (0.0%) | 0 (0.0%) |
| 40 to 44 Minutes | 0 (0.0%) | 49 (100.0%) |
| 45 to 59 Minutes | 0 (0.0%) | 0 (0.0%) |
| 60 to 89 Minutes | 0 (0.0%) | 0 (0.0%) |
| 90 or more Minutes | 48 (52.2%) | 0 (0.0%) |
Time of Departure to Work by Sex in Volta
The most frequent times of departure to work in Volta are 5:30 AM to 5:59 AM (48, 52.2%) for males and 8:00 AM to 8:29 AM (49, 100.0%) for females.
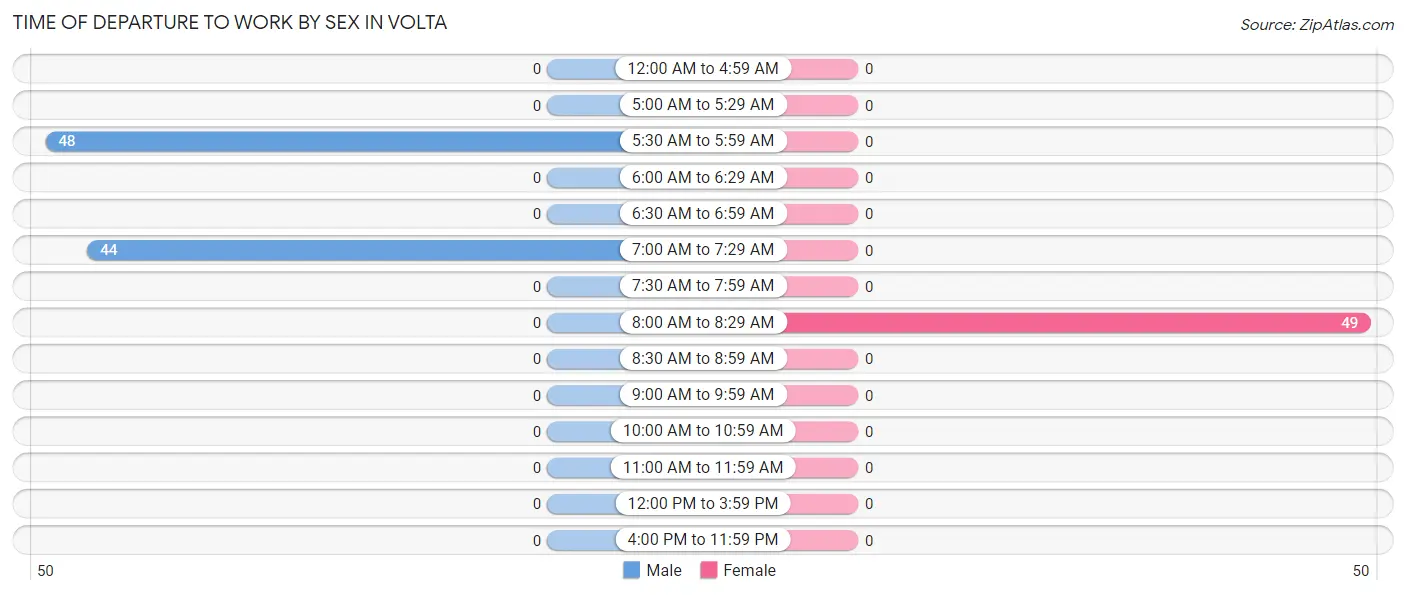
| Time of Departure | Male | Female |
| 12:00 AM to 4:59 AM | 0 (0.0%) | 0 (0.0%) |
| 5:00 AM to 5:29 AM | 0 (0.0%) | 0 (0.0%) |
| 5:30 AM to 5:59 AM | 48 (52.2%) | 0 (0.0%) |
| 6:00 AM to 6:29 AM | 0 (0.0%) | 0 (0.0%) |
| 6:30 AM to 6:59 AM | 0 (0.0%) | 0 (0.0%) |
| 7:00 AM to 7:29 AM | 44 (47.8%) | 0 (0.0%) |
| 7:30 AM to 7:59 AM | 0 (0.0%) | 0 (0.0%) |
| 8:00 AM to 8:29 AM | 0 (0.0%) | 49 (100.0%) |
| 8:30 AM to 8:59 AM | 0 (0.0%) | 0 (0.0%) |
| 9:00 AM to 9:59 AM | 0 (0.0%) | 0 (0.0%) |
| 10:00 AM to 10:59 AM | 0 (0.0%) | 0 (0.0%) |
| 11:00 AM to 11:59 AM | 0 (0.0%) | 0 (0.0%) |
| 12:00 PM to 3:59 PM | 0 (0.0%) | 0 (0.0%) |
| 4:00 PM to 11:59 PM | 0 (0.0%) | 0 (0.0%) |
| Total | 92 (100.0%) | 49 (100.0%) |
Housing Occupancy in Volta
Occupancy by Ownership in Volta
Of the total 139 dwellings in Volta, owner-occupied units account for 92 (66.2%), while renter-occupied units make up 47 (33.8%).
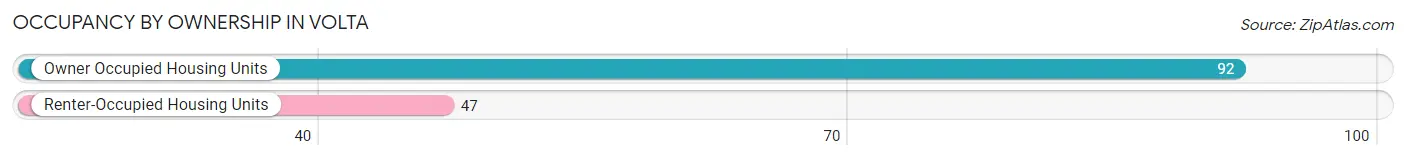
| Occupancy | # Housing Units | % Housing Units |
| Owner Occupied Housing Units | 92 | 66.2% |
| Renter-Occupied Housing Units | 47 | 33.8% |
| Total Occupied Housing Units | 139 | 100.0% |
Occupancy by Household Size in Volta
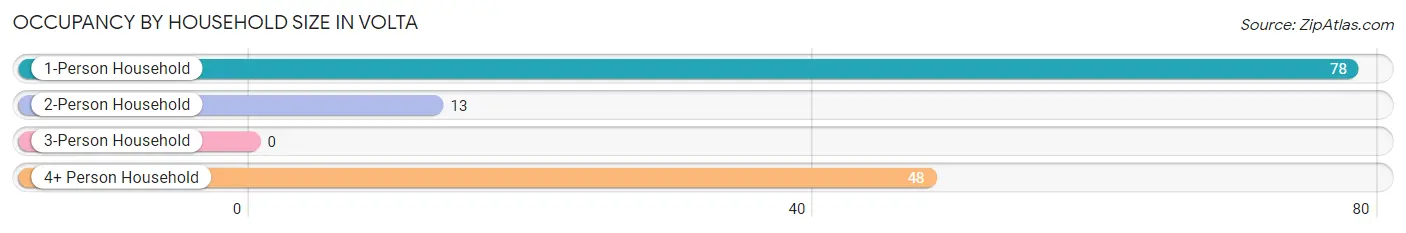
| Household Size | # Housing Units | % Housing Units |
| 1-Person Household | 78 | 56.1% |
| 2-Person Household | 13 | 9.3% |
| 3-Person Household | 0 | 0.0% |
| 4+ Person Household | 48 | 34.5% |
| Total Housing Units | 139 | 100.0% |
Occupancy by Ownership by Household Size in Volta
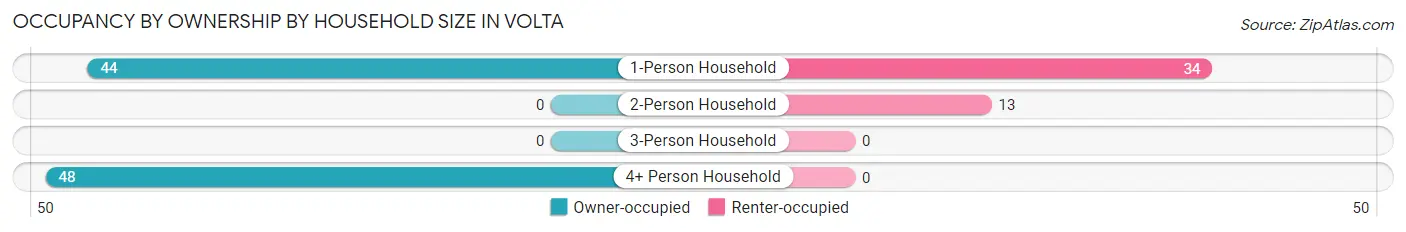
| Household Size | Owner-occupied | Renter-occupied |
| 1-Person Household | 44 (56.4%) | 34 (43.6%) |
| 2-Person Household | 0 (0.0%) | 13 (100.0%) |
| 3-Person Household | 0 (0.0%) | 0 (0.0%) |
| 4+ Person Household | 48 (100.0%) | 0 (0.0%) |
| Total Housing Units | 92 (66.2%) | 47 (33.8%) |
Occupancy by Educational Attainment in Volta
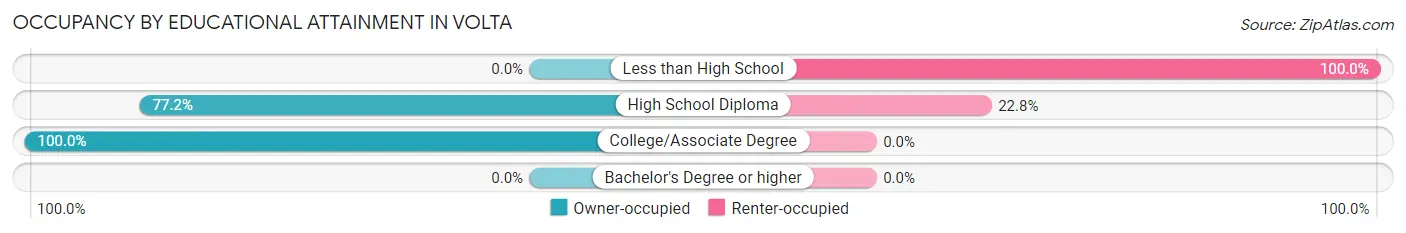
| Household Size | Owner-occupied | Renter-occupied |
| Less than High School | 0 (0.0%) | 34 (100.0%) |
| High School Diploma | 44 (77.2%) | 13 (22.8%) |
| College/Associate Degree | 48 (100.0%) | 0 (0.0%) |
| Bachelor's Degree or higher | 0 (0.0%) | 0 (0.0%) |
Occupancy by Age of Householder in Volta
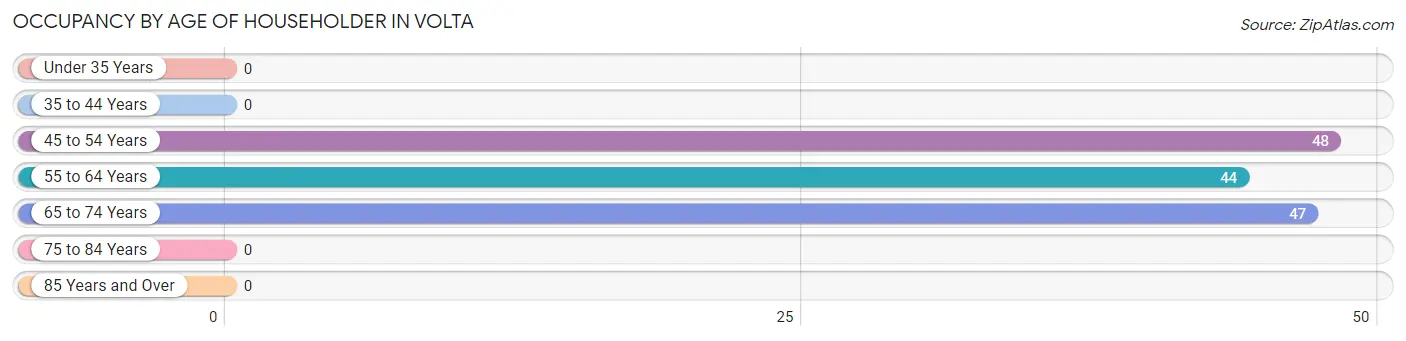
| Age Bracket | # Households | % Households |
| Under 35 Years | 0 | 0.0% |
| 35 to 44 Years | 0 | 0.0% |
| 45 to 54 Years | 48 | 34.5% |
| 55 to 64 Years | 44 | 31.7% |
| 65 to 74 Years | 47 | 33.8% |
| 75 to 84 Years | 0 | 0.0% |
| 85 Years and Over | 0 | 0.0% |
| Total | 139 | 100.0% |
Housing Finances in Volta
Median Income by Occupancy in Volta
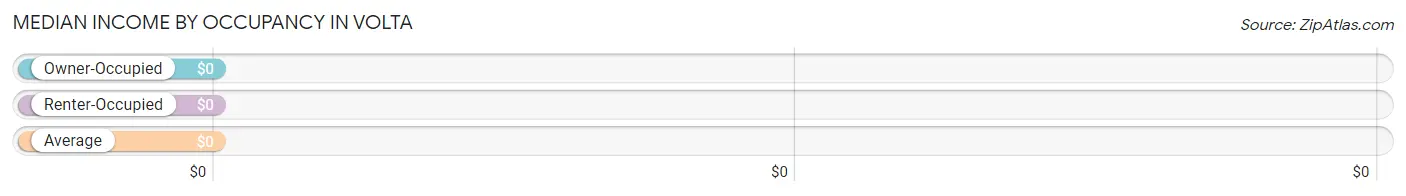
| Occupancy Type | # Households | Median Income |
| Owner-Occupied | 92 (66.2%) | $0 |
| Renter-Occupied | 47 (33.8%) | $0 |
| Average | 139 (100.0%) | $0 |
Occupancy by Householder Income Bracket in Volta
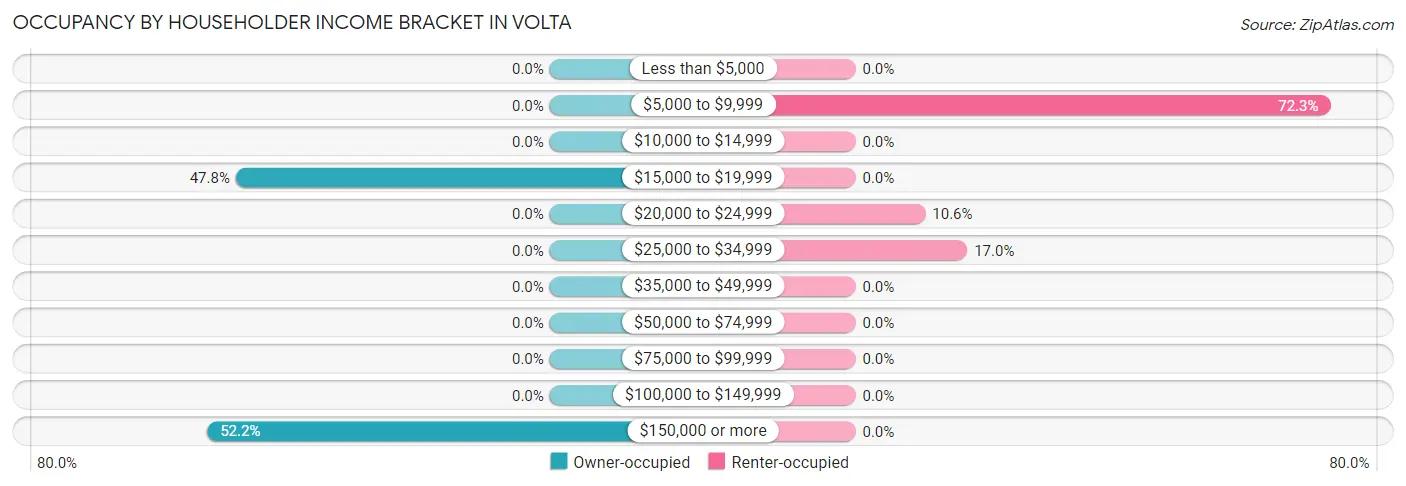
| Income Bracket | Owner-occupied | Renter-occupied |
| Less than $5,000 | 0 (0.0%) | 0 (0.0%) |
| $5,000 to $9,999 | 0 (0.0%) | 34 (72.3%) |
| $10,000 to $14,999 | 0 (0.0%) | 0 (0.0%) |
| $15,000 to $19,999 | 44 (47.8%) | 0 (0.0%) |
| $20,000 to $24,999 | 0 (0.0%) | 5 (10.6%) |
| $25,000 to $34,999 | 0 (0.0%) | 8 (17.0%) |
| $35,000 to $49,999 | 0 (0.0%) | 0 (0.0%) |
| $50,000 to $74,999 | 0 (0.0%) | 0 (0.0%) |
| $75,000 to $99,999 | 0 (0.0%) | 0 (0.0%) |
| $100,000 to $149,999 | 0 (0.0%) | 0 (0.0%) |
| $150,000 or more | 48 (52.2%) | 0 (0.0%) |
| Total | 92 (100.0%) | 47 (100.0%) |
Monthly Housing Cost Tiers in Volta
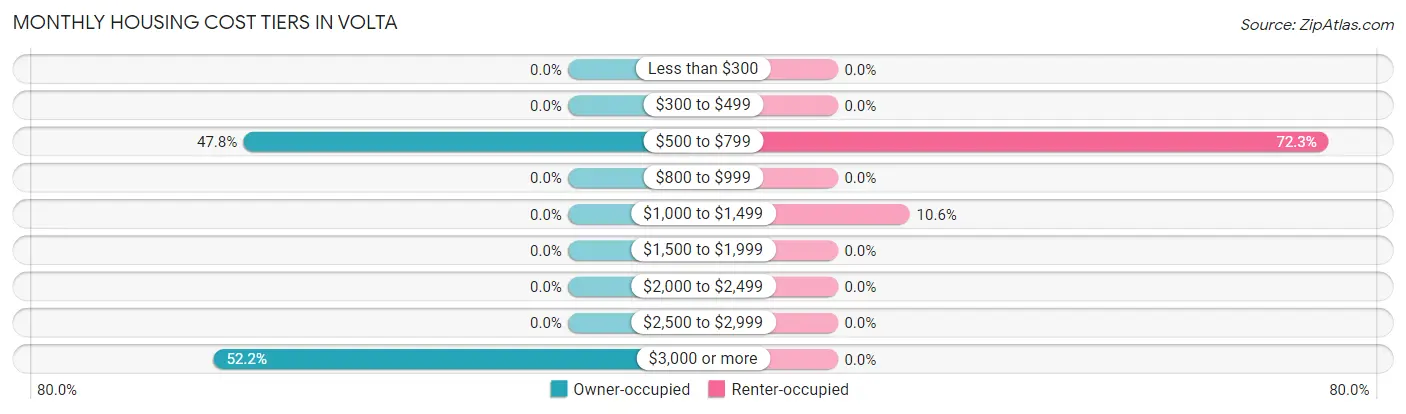
| Monthly Cost | Owner-occupied | Renter-occupied |
| Less than $300 | 0 (0.0%) | 0 (0.0%) |
| $300 to $499 | 0 (0.0%) | 0 (0.0%) |
| $500 to $799 | 44 (47.8%) | 34 (72.3%) |
| $800 to $999 | 0 (0.0%) | 0 (0.0%) |
| $1,000 to $1,499 | 0 (0.0%) | 5 (10.6%) |
| $1,500 to $1,999 | 0 (0.0%) | 0 (0.0%) |
| $2,000 to $2,499 | 0 (0.0%) | 0 (0.0%) |
| $2,500 to $2,999 | 0 (0.0%) | 0 (0.0%) |
| $3,000 or more | 48 (52.2%) | 0 (0.0%) |
| Total | 92 (100.0%) | 47 (100.0%) |
Physical Housing Characteristics in Volta
Housing Structures in Volta
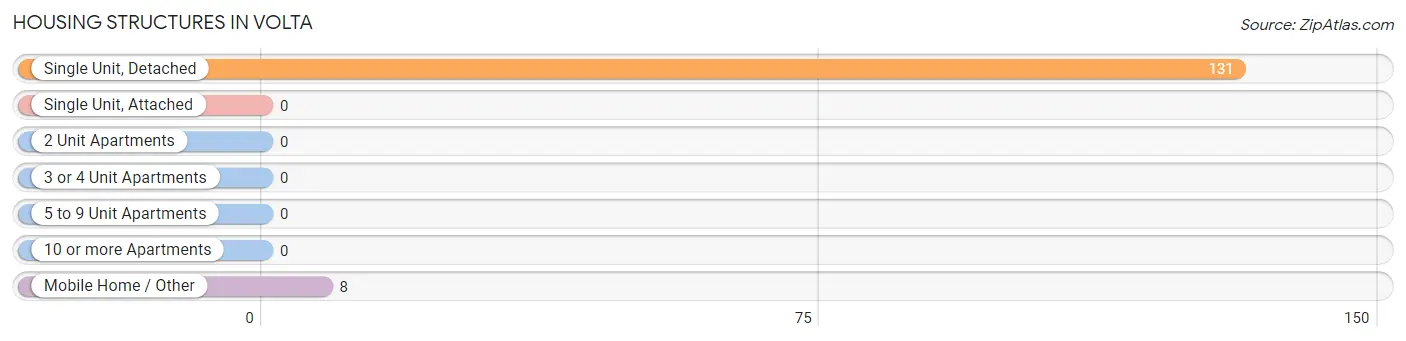
| Structure Type | # Housing Units | % Housing Units |
| Single Unit, Detached | 131 | 94.2% |
| Single Unit, Attached | 0 | 0.0% |
| 2 Unit Apartments | 0 | 0.0% |
| 3 or 4 Unit Apartments | 0 | 0.0% |
| 5 to 9 Unit Apartments | 0 | 0.0% |
| 10 or more Apartments | 0 | 0.0% |
| Mobile Home / Other | 8 | 5.8% |
| Total | 139 | 100.0% |
Housing Structures by Occupancy in Volta
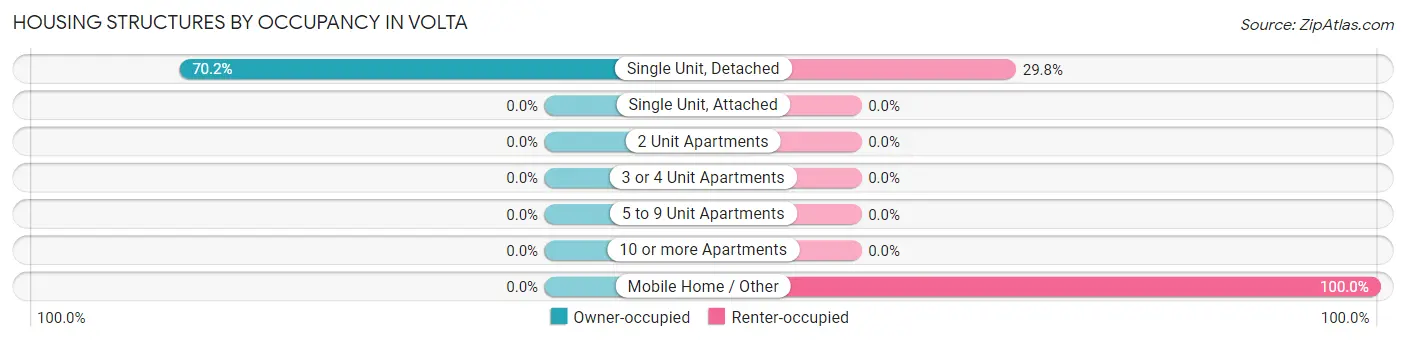
| Structure Type | Owner-occupied | Renter-occupied |
| Single Unit, Detached | 92 (70.2%) | 39 (29.8%) |
| Single Unit, Attached | 0 (0.0%) | 0 (0.0%) |
| 2 Unit Apartments | 0 (0.0%) | 0 (0.0%) |
| 3 or 4 Unit Apartments | 0 (0.0%) | 0 (0.0%) |
| 5 to 9 Unit Apartments | 0 (0.0%) | 0 (0.0%) |
| 10 or more Apartments | 0 (0.0%) | 0 (0.0%) |
| Mobile Home / Other | 0 (0.0%) | 8 (100.0%) |
| Total | 92 (66.2%) | 47 (33.8%) |
Housing Structures by Number of Rooms in Volta
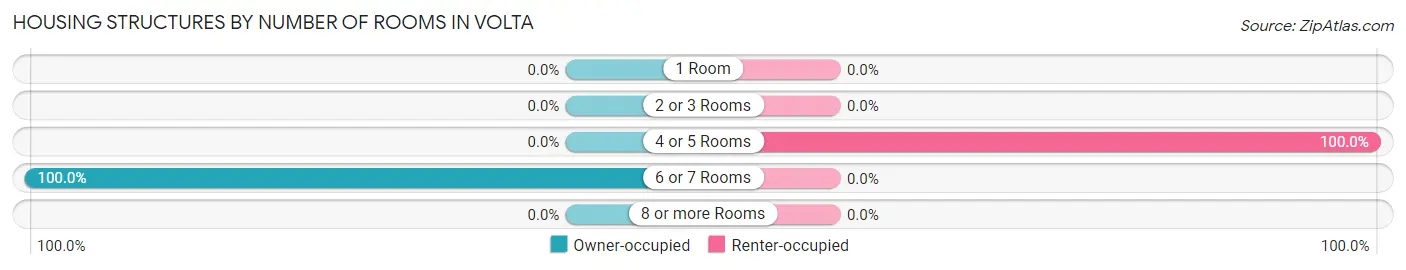
| Number of Rooms | Owner-occupied | Renter-occupied |
| 1 Room | 0 (0.0%) | 0 (0.0%) |
| 2 or 3 Rooms | 0 (0.0%) | 0 (0.0%) |
| 4 or 5 Rooms | 0 (0.0%) | 47 (100.0%) |
| 6 or 7 Rooms | 92 (100.0%) | 0 (0.0%) |
| 8 or more Rooms | 0 (0.0%) | 0 (0.0%) |
| Total | 92 (100.0%) | 47 (100.0%) |
Housing Structure by Heating Type in Volta
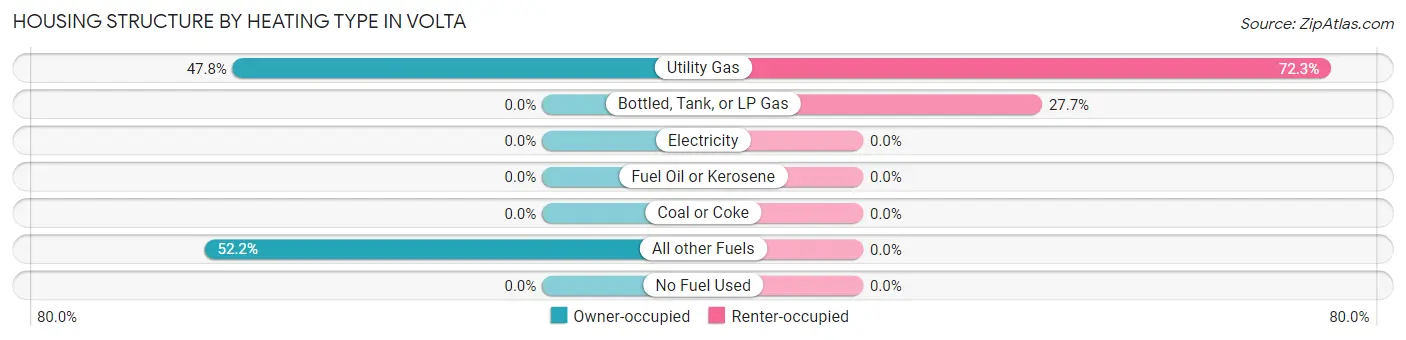
| Heating Type | Owner-occupied | Renter-occupied |
| Utility Gas | 44 (47.8%) | 34 (72.3%) |
| Bottled, Tank, or LP Gas | 0 (0.0%) | 13 (27.7%) |
| Electricity | 0 (0.0%) | 0 (0.0%) |
| Fuel Oil or Kerosene | 0 (0.0%) | 0 (0.0%) |
| Coal or Coke | 0 (0.0%) | 0 (0.0%) |
| All other Fuels | 48 (52.2%) | 0 (0.0%) |
| No Fuel Used | 0 (0.0%) | 0 (0.0%) |
| Total | 92 (100.0%) | 47 (100.0%) |
Household Vehicle Usage in Volta
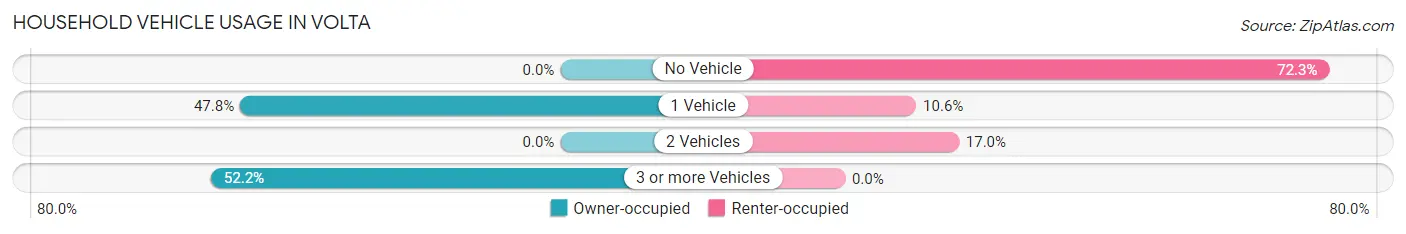
| Vehicles per Household | Owner-occupied | Renter-occupied |
| No Vehicle | 0 (0.0%) | 34 (72.3%) |
| 1 Vehicle | 44 (47.8%) | 5 (10.6%) |
| 2 Vehicles | 0 (0.0%) | 8 (17.0%) |
| 3 or more Vehicles | 48 (52.2%) | 0 (0.0%) |
| Total | 92 (100.0%) | 47 (100.0%) |
Real Estate & Mortgages in Volta
Real Estate and Mortgage Overview in Volta
| Characteristic | Without Mortgage | With Mortgage |
| Housing Units | 44 | 48 |
| Median Property Value | - | - |
| Median Household Income | - | - |
| Monthly Housing Costs | - | - |
| Real Estate Taxes | - | - |
Property Value by Mortgage Status in Volta
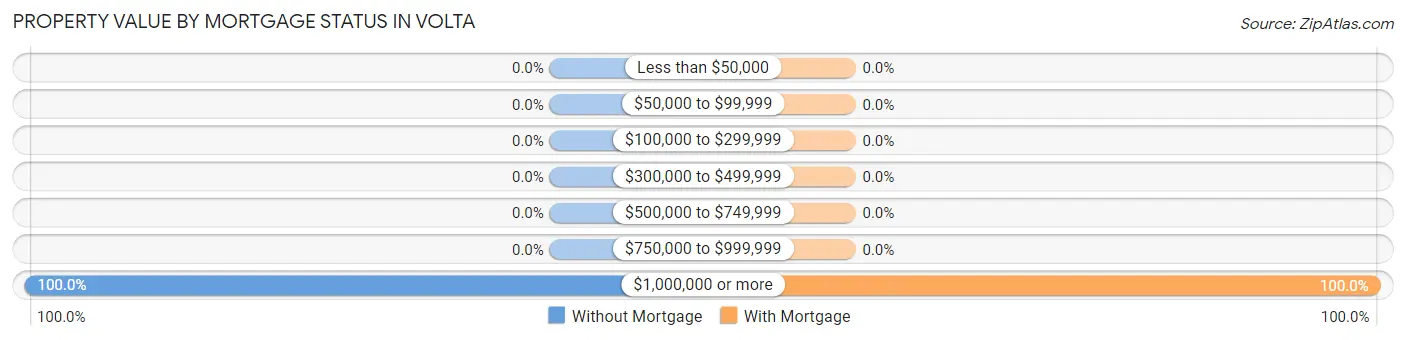
| Property Value | Without Mortgage | With Mortgage |
| Less than $50,000 | 0 (0.0%) | 0 (0.0%) |
| $50,000 to $99,999 | 0 (0.0%) | 0 (0.0%) |
| $100,000 to $299,999 | 0 (0.0%) | 0 (0.0%) |
| $300,000 to $499,999 | 0 (0.0%) | 0 (0.0%) |
| $500,000 to $749,999 | 0 (0.0%) | 0 (0.0%) |
| $750,000 to $999,999 | 0 (0.0%) | 0 (0.0%) |
| $1,000,000 or more | 44 (100.0%) | 48 (100.0%) |
| Total | 44 (100.0%) | 48 (100.0%) |
Household Income by Mortgage Status in Volta
| Household Income | Without Mortgage | With Mortgage |
| Less than $10,000 | 0 (0.0%) | 0 (0.0%) |
| $10,000 to $24,999 | 44 (100.0%) | 0 (0.0%) |
| $25,000 to $34,999 | 0 (0.0%) | 0 (0.0%) |
| $35,000 to $49,999 | 0 (0.0%) | 0 (0.0%) |
| $50,000 to $74,999 | 0 (0.0%) | 0 (0.0%) |
| $75,000 to $99,999 | 0 (0.0%) | 0 (0.0%) |
| $100,000 to $149,999 | 0 (0.0%) | 0 (0.0%) |
| $150,000 or more | 0 (0.0%) | 0 (0.0%) |
| Total | 44 (100.0%) | 48 (100.0%) |
Property Value to Household Income Ratio in Volta
| Value-to-Income Ratio | Without Mortgage | With Mortgage |
| Less than 2.0x | 0 (0.0%) | 0 (0.0%) |
| 2.0x to 2.9x | 0 (0.0%) | 0 (0.0%) |
| 3.0x to 3.9x | 0 (0.0%) | 0 (0.0%) |
| 4.0x or more | 44 (100.0%) | 0 (0.0%) |
| Total | 44 (100.0%) | 48 (100.0%) |
Real Estate Taxes by Mortgage Status in Volta
| Property Taxes | Without Mortgage | With Mortgage |
| Less than $800 | 0 (0.0%) | 0 (0.0%) |
| $800 to $1,499 | 0 (0.0%) | 0 (0.0%) |
| $800 to $1,499 | 44 (100.0%) | 0 (0.0%) |
| Total | 44 (100.0%) | 48 (100.0%) |
Health & Disability in Volta
Health Insurance Coverage by Age in Volta
| Age Bracket | With Coverage | Without Coverage |
| Under 6 Years | 0 (0.0%) | 0 (0.0%) |
| 6 to 18 Years | 90 (100.0%) | 0 (0.0%) |
| 19 to 25 Years | 0 (0.0%) | 0 (0.0%) |
| 26 to 34 Years | 0 (0.0%) | 0 (0.0%) |
| 35 to 44 Years | 0 (0.0%) | 0 (0.0%) |
| 45 to 54 Years | 97 (100.0%) | 0 (0.0%) |
| 55 to 64 Years | 44 (100.0%) | 0 (0.0%) |
| 65 to 74 Years | 61 (100.0%) | 0 (0.0%) |
| 75 Years and older | 0 (0.0%) | 0 (0.0%) |
| Total | 292 (100.0%) | 0 (0.0%) |
Health Insurance Coverage by Citizenship Status in Volta
| Citizenship Status | With Coverage | Without Coverage |
| Native Born | 0 (0.0%) | 0 (0.0%) |
| Foreign Born, Citizen | 90 (100.0%) | 0 (0.0%) |
| Foreign Born, not a Citizen | 0 (0.0%) | 0 (0.0%) |
Health Insurance Coverage by Household Income in Volta
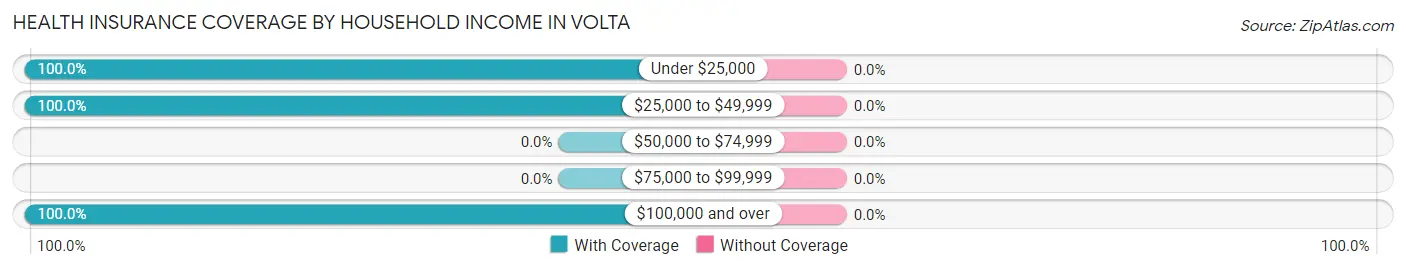
| Household Income | With Coverage | Without Coverage |
| Under $25,000 | 90 (100.0%) | 0 (0.0%) |
| $25,000 to $49,999 | 15 (100.0%) | 0 (0.0%) |
| $50,000 to $74,999 | 0 (0.0%) | 0 (0.0%) |
| $75,000 to $99,999 | 0 (0.0%) | 0 (0.0%) |
| $100,000 and over | 187 (100.0%) | 0 (0.0%) |
Public vs Private Health Insurance Coverage by Age in Volta
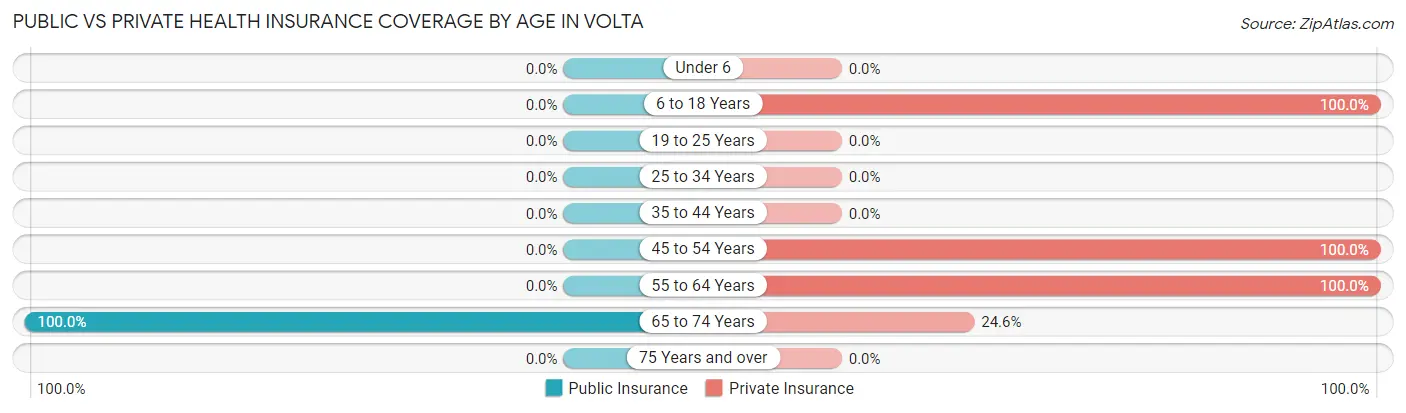
| Age Bracket | Public Insurance | Private Insurance |
| Under 6 | 0 (0.0%) | 0 (0.0%) |
| 6 to 18 Years | 0 (0.0%) | 90 (100.0%) |
| 19 to 25 Years | 0 (0.0%) | 0 (0.0%) |
| 25 to 34 Years | 0 (0.0%) | 0 (0.0%) |
| 35 to 44 Years | 0 (0.0%) | 0 (0.0%) |
| 45 to 54 Years | 0 (0.0%) | 97 (100.0%) |
| 55 to 64 Years | 0 (0.0%) | 44 (100.0%) |
| 65 to 74 Years | 61 (100.0%) | 15 (24.6%) |
| 75 Years and over | 0 (0.0%) | 0 (0.0%) |
| Total | 61 (20.9%) | 246 (84.3%) |
Disability Status by Sex by Age in Volta
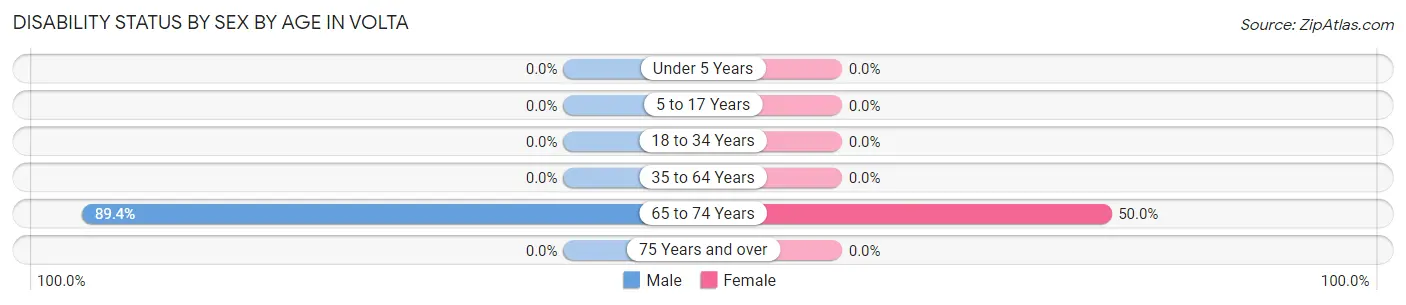
| Age Bracket | Male | Female |
| Under 5 Years | 0 (0.0%) | 0 (0.0%) |
| 5 to 17 Years | 0 (0.0%) | 0 (0.0%) |
| 18 to 34 Years | 0 (0.0%) | 0 (0.0%) |
| 35 to 64 Years | 0 (0.0%) | 0 (0.0%) |
| 65 to 74 Years | 42 (89.4%) | 7 (50.0%) |
| 75 Years and over | 0 (0.0%) | 0 (0.0%) |
Disability Class by Sex by Age in Volta
Disability Class: Hearing Difficulty
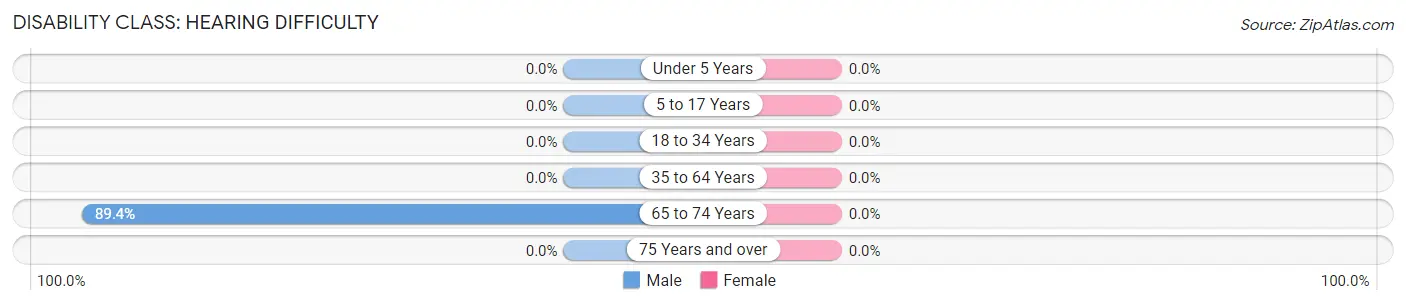
| Age Bracket | Male | Female |
| Under 5 Years | 0 (0.0%) | 0 (0.0%) |
| 5 to 17 Years | 0 (0.0%) | 0 (0.0%) |
| 18 to 34 Years | 0 (0.0%) | 0 (0.0%) |
| 35 to 64 Years | 0 (0.0%) | 0 (0.0%) |
| 65 to 74 Years | 42 (89.4%) | 0 (0.0%) |
| 75 Years and over | 0 (0.0%) | 0 (0.0%) |
Disability Class: Vision Difficulty

| Age Bracket | Male | Female |
| Under 5 Years | 0 (0.0%) | 0 (0.0%) |
| 5 to 17 Years | 0 (0.0%) | 0 (0.0%) |
| 18 to 34 Years | 0 (0.0%) | 0 (0.0%) |
| 35 to 64 Years | 0 (0.0%) | 0 (0.0%) |
| 65 to 74 Years | 34 (72.3%) | 0 (0.0%) |
| 75 Years and over | 0 (0.0%) | 0 (0.0%) |
Disability Class: Cognitive Difficulty

| Age Bracket | Male | Female |
| 5 to 17 Years | 0 (0.0%) | 0 (0.0%) |
| 18 to 34 Years | 0 (0.0%) | 0 (0.0%) |
| 35 to 64 Years | 0 (0.0%) | 0 (0.0%) |
| 65 to 74 Years | 34 (72.3%) | 0 (0.0%) |
| 75 Years and over | 0 (0.0%) | 0 (0.0%) |
Disability Class: Ambulatory Difficulty
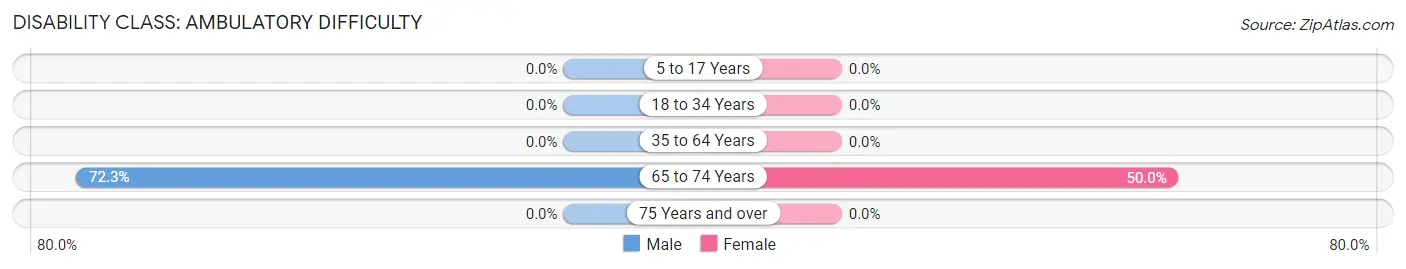
| Age Bracket | Male | Female |
| 5 to 17 Years | 0 (0.0%) | 0 (0.0%) |
| 18 to 34 Years | 0 (0.0%) | 0 (0.0%) |
| 35 to 64 Years | 0 (0.0%) | 0 (0.0%) |
| 65 to 74 Years | 34 (72.3%) | 7 (50.0%) |
| 75 Years and over | 0 (0.0%) | 0 (0.0%) |
Disability Class: Self-Care Difficulty
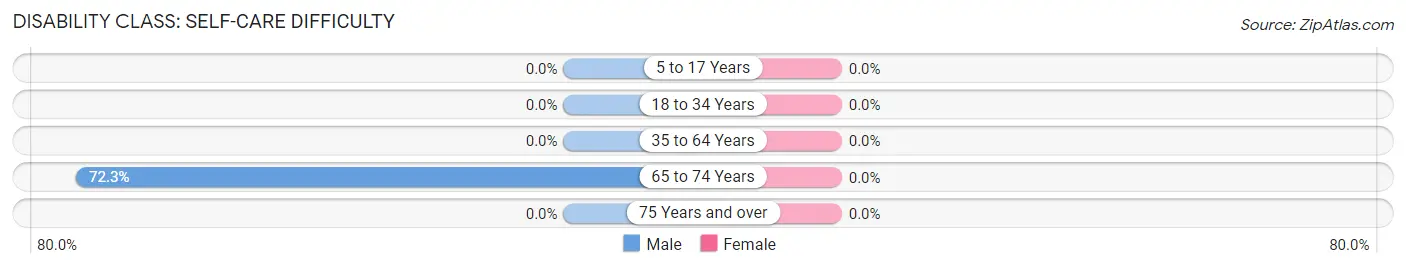
| Age Bracket | Male | Female |
| 5 to 17 Years | 0 (0.0%) | 0 (0.0%) |
| 18 to 34 Years | 0 (0.0%) | 0 (0.0%) |
| 35 to 64 Years | 0 (0.0%) | 0 (0.0%) |
| 65 to 74 Years | 34 (72.3%) | 0 (0.0%) |
| 75 Years and over | 0 (0.0%) | 0 (0.0%) |
Technology Access in Volta
Computing Device Access in Volta
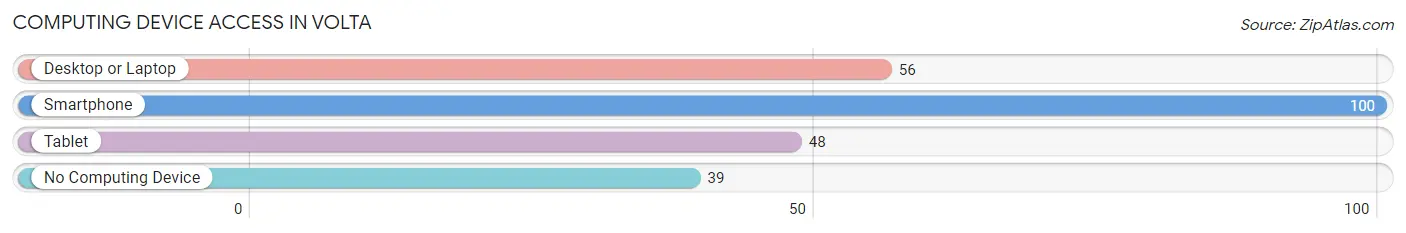
| Device Type | # Households | % Households |
| Desktop or Laptop | 56 | 40.3% |
| Smartphone | 100 | 71.9% |
| Tablet | 48 | 34.5% |
| No Computing Device | 39 | 28.1% |
| Total | 139 | 100.0% |
Internet Access in Volta
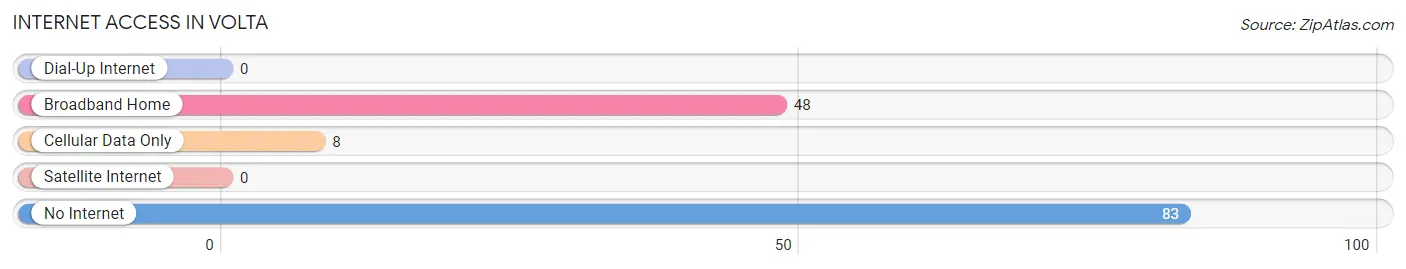
| Internet Type | # Households | % Households |
| Dial-Up Internet | 0 | 0.0% |
| Broadband Home | 48 | 34.5% |
| Cellular Data Only | 8 | 5.8% |
| Satellite Internet | 0 | 0.0% |
| No Internet | 83 | 59.7% |
| Total | 139 | 100.0% |
Volta Summary
Volta is a small town located in the northern part of California, in the Sierra Nevada foothills. It is situated in the Sierra Valley, which is a large agricultural valley that stretches from the Sierra Nevada Mountains to the Sacramento Valley. The town is located in Sierra County, which is one of the most rural counties in California.
Volta was founded in 1852 by a group of miners who were looking for gold. The town was named after the Italian physicist Alessandro Volta, who invented the first battery. The town grew quickly and soon became a bustling center of commerce and industry. The town was home to several businesses, including a sawmill, a blacksmith shop, a general store, and a hotel.
The town's economy was largely based on agriculture and mining. The surrounding area was rich in gold, and many of the town's residents worked in the mines. The town also had a thriving lumber industry, as the surrounding forests provided an abundance of timber.
The town's population peaked in the late 1800s, when it had a population of over 1,000 people. However, the population began to decline in the early 1900s, as the gold mines began to run dry and the lumber industry began to decline. By the 1950s, the population had dropped to just over 500 people.
Today, Volta is a small, rural town with a population of just over 500 people. The town is still largely agricultural, with many of the residents working in the local farms and ranches. The town also has a few small businesses, including a general store, a gas station, and a few restaurants.
The town is served by the Sierra Valley Unified School District, which provides education to the town's students. The town also has a small library, which is run by the Sierra Valley Library Association.
The town is located in a beautiful area of California, surrounded by rolling hills and lush forests. The town is also close to several recreational areas, including the Sierra National Forest and the Tahoe National Forest.
Volta is a great place to live for those who enjoy the outdoors and the rural lifestyle. The town is a great place to raise a family, as it offers a safe and peaceful environment. The town is also close to several larger cities, such as Sacramento and Reno, which provide access to a variety of amenities and services.
Common Questions
What is Per Capita Income in Volta?
Per Capita income in Volta is $53,206.
What is Inequality or Gini Index in Volta?
Inequality or Gini Index in Volta is 0.58.
What is the Total Population of Volta?
Total Population of Volta is 292.
What is the Total Male Population of Volta?
Total Male Population of Volta is 178.
What is the Total Female Population of Volta?
Total Female Population of Volta is 114.
What is the Ratio of Males per 100 Females in Volta?
There are 156.14 Males per 100 Females in Volta.
What is the Ratio of Females per 100 Males in Volta?
There are 64.04 Females per 100 Males in Volta.
What is the Median Population Age in Volta?
Median Population Age in Volta is 47.1 Years.
What is the Average Family Size in Volta
Average Family Size in Volta is 3.6 People.
What is the Average Household Size in Volta
Average Household Size in Volta is 2.1 People.
How Large is the Labor Force in Volta?
There are 199 People in the Labor Forcein in Volta.
What is the Percentage of People in the Labor Force in Volta?
78.7% of People are in the Labor Force in Volta.
What is the Unemployment Rate in Volta?
Unemployment Rate in Volta is 25.6%.