Cities with the Highest Percentage of Families with Income Above $200,000 in North Dakota
RELATED REPORTS & OPTIONS
Family Income | $200k+
North Dakota
Compare Cities
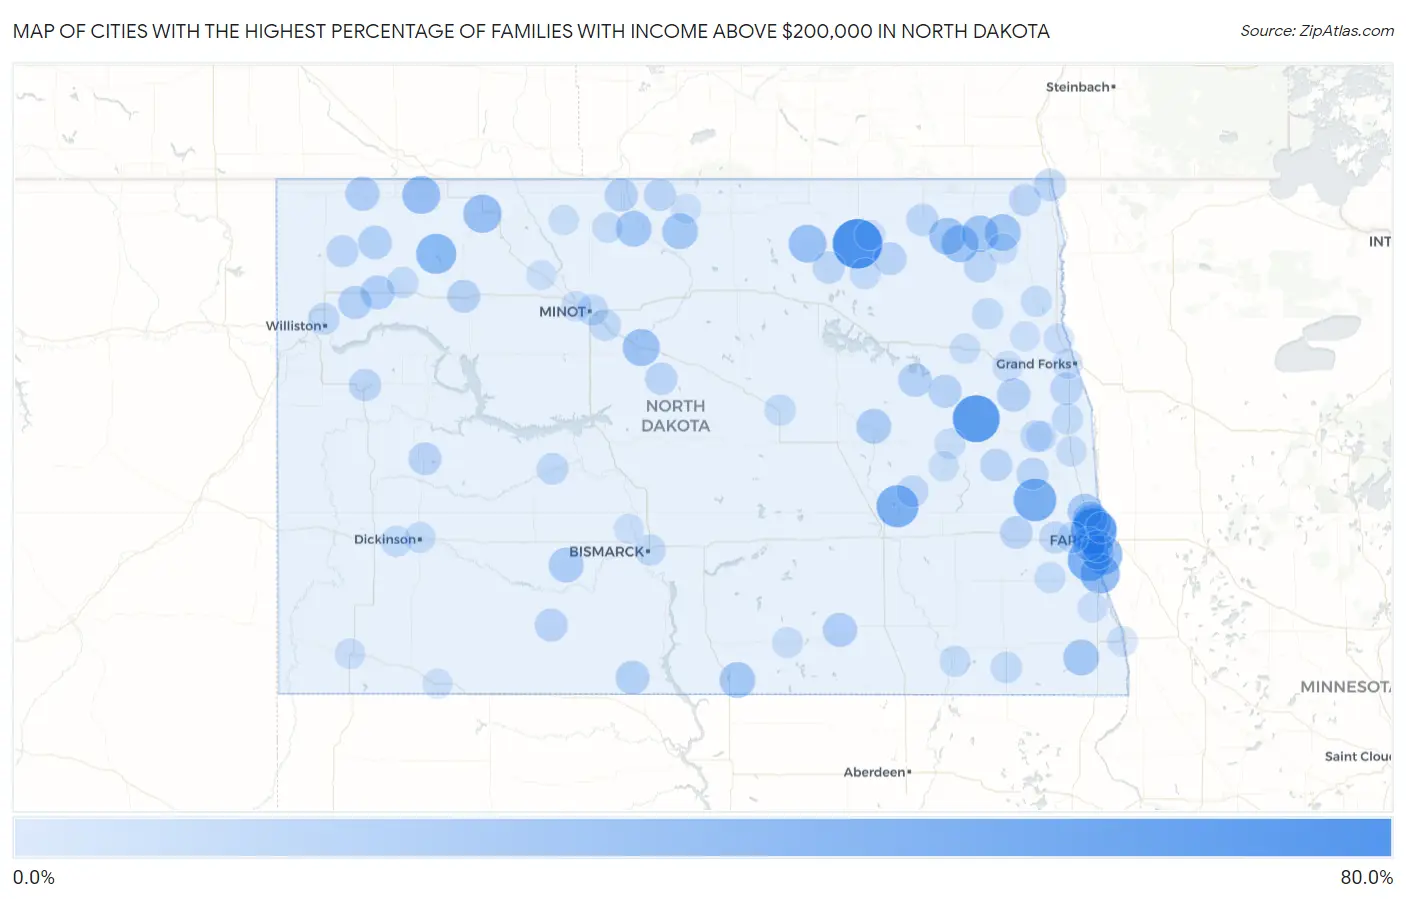
Map of Cities with the Highest Percentage of Families with Income Above $200,000 in North Dakota
0.0%
80.0%
Cities with the Highest Percentage of Families with Income Above $200,000 in North Dakota
| City | Families with Income > $200k | vs State | vs National | |
| 1. | Calio | 66.7% | 12.2%(+54.5)#1 | 14.8%(+51.9)#234 |
| 2. | Sharon | 58.6% | 12.2%(+46.4)#2 | 14.8%(+43.8)#449 |
| 3. | Reile S Acres | 55.2% | 12.2%(+43.0)#3 | 14.8%(+40.4)#572 |
| 4. | Erie | 45.5% | 12.2%(+33.3)#4 | 14.8%(+30.7)#1,024 |
| 5. | Horace | 43.7% | 12.2%(+31.5)#5 | 14.8%(+28.9)#1,125 |
| 6. | Spiritwood Lake | 43.5% | 12.2%(+31.3)#6 | 14.8%(+28.7)#1,144 |
| 7. | Powers Lake | 37.8% | 12.2%(+25.6)#7 | 14.8%(+23.0)#1,600 |
| 8. | Briarwood | 36.8% | 12.2%(+24.6)#8 | 14.8%(+22.0)#1,680 |
| 9. | Oxbow | 36.4% | 12.2%(+24.2)#9 | 14.8%(+21.6)#1,714 |
| 10. | Bowbells | 32.1% | 12.2%(+19.9)#10 | 14.8%(+17.3)#2,146 |
| 11. | Columbus | 31.3% | 12.2%(+19.1)#11 | 14.8%(+16.5)#2,231 |
| 12. | Bisbee | 30.8% | 12.2%(+18.6)#12 | 14.8%(+16.0)#2,283 |
| 13. | Harwood | 30.6% | 12.2%(+18.4)#13 | 14.8%(+15.8)#2,301 |
| 14. | Milton | 28.6% | 12.2%(+16.4)#14 | 14.8%(+13.8)#2,574 |
| 15. | Voltaire | 28.6% | 12.2%(+16.4)#15 | 14.8%(+13.8)#2,575 |
| 16. | Osnabrock | 27.8% | 12.2%(+15.6)#16 | 14.8%(+13.0)#2,698 |
| 17. | Mountain | 27.3% | 12.2%(+15.1)#17 | 14.8%(+12.5)#2,773 |
| 18. | Canton City Hensel | 27.3% | 12.2%(+15.1)#18 | 14.8%(+12.5)#2,775 |
| 19. | Hague | 25.0% | 12.2%(+12.8)#19 | 14.8%(+10.2)#3,119 |
| 20. | Newburg | 25.0% | 12.2%(+12.8)#20 | 14.8%(+10.2)#3,124 |
| 21. | Gardena | 25.0% | 12.2%(+12.8)#21 | 14.8%(+10.2)#3,127 |
| 22. | Mantador | 25.0% | 12.2%(+12.8)#22 | 14.8%(+10.2)#3,128 |
| 23. | Argusville | 22.6% | 12.2%(+10.4)#23 | 14.8%(+7.80)#3,554 |
| 24. | Almont | 22.5% | 12.2%(+10.3)#24 | 14.8%(+7.70)#3,580 |
| 25. | Grace City | 22.2% | 12.2%(+10.00)#25 | 14.8%(+7.40)#3,641 |
| 26. | Brooktree Park | 21.6% | 12.2%(+9.40)#26 | 14.8%(+6.80)#3,768 |
| 27. | Frontier | 20.3% | 12.2%(+8.10)#27 | 14.8%(+5.50)#4,060 |
| 28. | Crosby | 20.1% | 12.2%(+7.90)#28 | 14.8%(+5.30)#4,101 |
| 29. | Fredonia | 20.0% | 12.2%(+7.80)#29 | 14.8%(+5.20)#4,143 |
| 30. | Ray | 19.9% | 12.2%(+7.70)#30 | 14.8%(+5.10)#4,160 |
| 31. | Selfridge | 19.2% | 12.2%(+7.00)#31 | 14.8%(+4.40)#4,314 |
| 32. | Wildrose | 18.9% | 12.2%(+6.70)#32 | 14.8%(+4.10)#4,397 |
| 33. | West Fargo | 18.8% | 12.2%(+6.60)#33 | 14.8%(+4.00)#4,401 |
| 34. | Tolna | 18.2% | 12.2%(+6.00)#34 | 14.8%(+3.40)#4,581 |
| 35. | Northwood | 18.1% | 12.2%(+5.90)#35 | 14.8%(+3.30)#4,612 |
| 36. | Epping | 17.8% | 12.2%(+5.60)#36 | 14.8%(+3.00)#4,713 |
| 37. | Westhope | 17.3% | 12.2%(+5.10)#37 | 14.8%(+2.50)#4,885 |
| 38. | Mcville | 17.0% | 12.2%(+4.80)#38 | 14.8%(+2.20)#4,964 |
| 39. | Stanley | 16.9% | 12.2%(+4.70)#39 | 14.8%(+2.10)#4,986 |
| 40. | Leith | 16.7% | 12.2%(+4.50)#40 | 14.8%(+1.90)#5,062 |
| 41. | Hampden | 16.7% | 12.2%(+4.50)#41 | 14.8%(+1.90)#5,064 |
| 42. | Killdeer | 16.4% | 12.2%(+4.20)#42 | 14.8%(+1.60)#5,151 |
| 43. | Buffalo | 16.1% | 12.2%(+3.90)#43 | 14.8%(+1.30)#5,257 |
| 44. | Hope | 15.5% | 12.2%(+3.30)#44 | 14.8%(+0.700)#5,465 |
| 45. | Pembina | 15.4% | 12.2%(+3.20)#45 | 14.8%(+0.600)#5,505 |
| 46. | Watford City | 15.2% | 12.2%(+3.00)#46 | 14.8%(+0.400)#5,553 |
| 47. | Langdon | 15.2% | 12.2%(+3.00)#47 | 14.8%(+0.400)#5,566 |
| 48. | Edinburg | 15.2% | 12.2%(+3.00)#48 | 14.8%(+0.400)#5,577 |
| 49. | Butte | 15.0% | 12.2%(+2.80)#49 | 14.8%(+0.200)#5,664 |
| 50. | Thompson | 14.7% | 12.2%(+2.50)#50 | 14.8%(-0.100)#5,757 |
| 51. | Cando | 14.6% | 12.2%(+2.40)#51 | 14.8%(-0.200)#5,801 |
| 52. | Alamo | 14.3% | 12.2%(+2.10)#52 | 14.8%(-0.500)#5,938 |
| 53. | Galesburg | 14.3% | 12.2%(+2.10)#53 | 14.8%(-0.500)#5,939 |
| 54. | Souris | 14.3% | 12.2%(+2.10)#54 | 14.8%(-0.500)#5,940 |
| 55. | Bathgate | 14.3% | 12.2%(+2.10)#55 | 14.8%(-0.500)#5,943 |
| 56. | Fargo | 13.7% | 12.2%(+1.50)#56 | 14.8%(-1.10)#6,173 |
| 57. | Williston | 13.7% | 12.2%(+1.50)#57 | 14.8%(-1.10)#6,179 |
| 58. | Portland | 13.6% | 12.2%(+1.40)#58 | 14.8%(-1.20)#6,257 |
| 59. | Casselton | 13.4% | 12.2%(+1.20)#59 | 14.8%(-1.40)#6,330 |
| 60. | Wimbledon | 13.3% | 12.2%(+1.10)#60 | 14.8%(-1.50)#6,393 |
| 61. | Hazen | 13.2% | 12.2%(+1.00)#61 | 14.8%(-1.60)#6,427 |
| 62. | Logan | 12.9% | 12.2%(+0.700)#62 | 14.8%(-1.90)#6,589 |
| 63. | Forman | 12.6% | 12.2%(+0.400)#63 | 14.8%(-2.20)#6,709 |
| 64. | Buxton | 12.4% | 12.2%(+0.200)#64 | 14.8%(-2.40)#6,828 |
| 65. | Trenton | 12.3% | 12.2%(+0.100)#65 | 14.8%(-2.50)#6,869 |
| 66. | Minot | 12.2% | 12.2%(=0.000)#66 | 14.8%(-2.60)#6,884 |
| 67. | Mapleton | 12.2% | 12.2%(=0.000)#67 | 14.8%(-2.60)#6,912 |
| 68. | Bismarck | 12.1% | 12.2%(-0.100)#68 | 14.8%(-2.70)#6,932 |
| 69. | Fessenden | 12.1% | 12.2%(-0.100)#69 | 14.8%(-2.70)#6,980 |
| 70. | Fordville | 12.1% | 12.2%(-0.100)#70 | 14.8%(-2.70)#6,987 |
| 71. | Tioga | 12.0% | 12.2%(-0.200)#71 | 14.8%(-2.80)#7,019 |
| 72. | South Heart | 11.5% | 12.2%(-0.700)#72 | 14.8%(-3.30)#7,309 |
| 73. | Minto | 11.3% | 12.2%(-0.900)#73 | 14.8%(-3.50)#7,446 |
| 74. | Leonard | 11.3% | 12.2%(-0.900)#74 | 14.8%(-3.50)#7,455 |
| 75. | Dickinson | 11.2% | 12.2%(-1.00)#75 | 14.8%(-3.60)#7,466 |
| 76. | Starkweather | 11.1% | 12.2%(-1.10)#76 | 14.8%(-3.70)#7,600 |
| 77. | Oakes | 11.0% | 12.2%(-1.20)#77 | 14.8%(-3.80)#7,634 |
| 78. | Wishek | 10.6% | 12.2%(-1.60)#78 | 14.8%(-4.20)#7,867 |
| 79. | Maxbass | 10.5% | 12.2%(-1.70)#79 | 14.8%(-4.30)#7,948 |
| 80. | North River | 10.5% | 12.2%(-1.70)#80 | 14.8%(-4.30)#7,954 |
| 81. | Petersburg | 10.3% | 12.2%(-1.90)#81 | 14.8%(-4.50)#8,084 |
| 82. | Hillsboro | 10.2% | 12.2%(-2.00)#82 | 14.8%(-4.60)#8,118 |
| 83. | Mayville | 10.1% | 12.2%(-2.10)#83 | 14.8%(-4.70)#8,188 |
| 84. | Cooperstown | 10.0% | 12.2%(-2.20)#84 | 14.8%(-4.80)#8,282 |
| 85. | Crystal | 10.0% | 12.2%(-2.20)#85 | 14.8%(-4.80)#8,302 |
| 86. | Burlington | 9.9% | 12.2%(-2.30)#86 | 14.8%(-4.90)#8,373 |
| 87. | Bowman | 9.8% | 12.2%(-2.40)#87 | 14.8%(-5.00)#8,429 |
| 88. | Manvel | 9.8% | 12.2%(-2.40)#88 | 14.8%(-5.00)#8,454 |
| 89. | Wahpeton | 9.7% | 12.2%(-2.50)#89 | 14.8%(-5.10)#8,482 |
| 90. | Larimore | 9.7% | 12.2%(-2.50)#90 | 14.8%(-5.10)#8,514 |
| 91. | Grand Forks | 9.6% | 12.2%(-2.60)#91 | 14.8%(-5.20)#8,541 |
| 92. | Munich | 9.3% | 12.2%(-2.90)#92 | 14.8%(-5.50)#8,815 |
| 93. | Colfax | 9.1% | 12.2%(-3.10)#93 | 14.8%(-5.70)#8,970 |
| 94. | Hannaford | 9.1% | 12.2%(-3.10)#94 | 14.8%(-5.70)#8,985 |
| 95. | Mohall | 9.0% | 12.2%(-3.20)#95 | 14.8%(-5.80)#9,046 |
| 96. | Gilby | 8.9% | 12.2%(-3.30)#96 | 14.8%(-5.90)#9,112 |
| 97. | Bottineau | 8.7% | 12.2%(-3.50)#97 | 14.8%(-6.10)#9,261 |
| 98. | Carpio | 8.7% | 12.2%(-3.50)#98 | 14.8%(-6.10)#9,299 |
| 99. | Harmon | 8.6% | 12.2%(-3.60)#99 | 14.8%(-6.20)#9,404 |
| 100. | Hettinger | 8.5% | 12.2%(-3.70)#100 | 14.8%(-6.30)#9,467 |
Common Questions
What are the Top 10 Cities with the Highest Percentage of Families with Income Above $200,000 in North Dakota?
Top 10 Cities with the Highest Percentage of Families with Income Above $200,000 in North Dakota are:
#1
66.7%
#2
58.6%
#3
55.2%
#4
45.5%
#5
43.7%
#6
43.5%
#7
37.8%
#8
36.8%
#9
36.4%
#10
32.1%
What city has the Highest Percentage of Families with Income Above $200,000 in North Dakota?
Calio has the Highest Percentage of Families with Income Above $200,000 in North Dakota with 66.7%.
What is the Percentage of Families with Income Above $200,000 in the State of North Dakota?
Percentage of Families with Income Above $200,000 in North Dakota is 12.2%.
What is the Percentage of Families with Income Above $200,000 in the United States?
Percentage of Families with Income Above $200,000 in the United States is 14.8%.