Cities with the Highest Percentage of Families with Income Above $200,000 in Kansas
RELATED REPORTS & OPTIONS
Family Income | $200k+
Kansas
Compare Cities
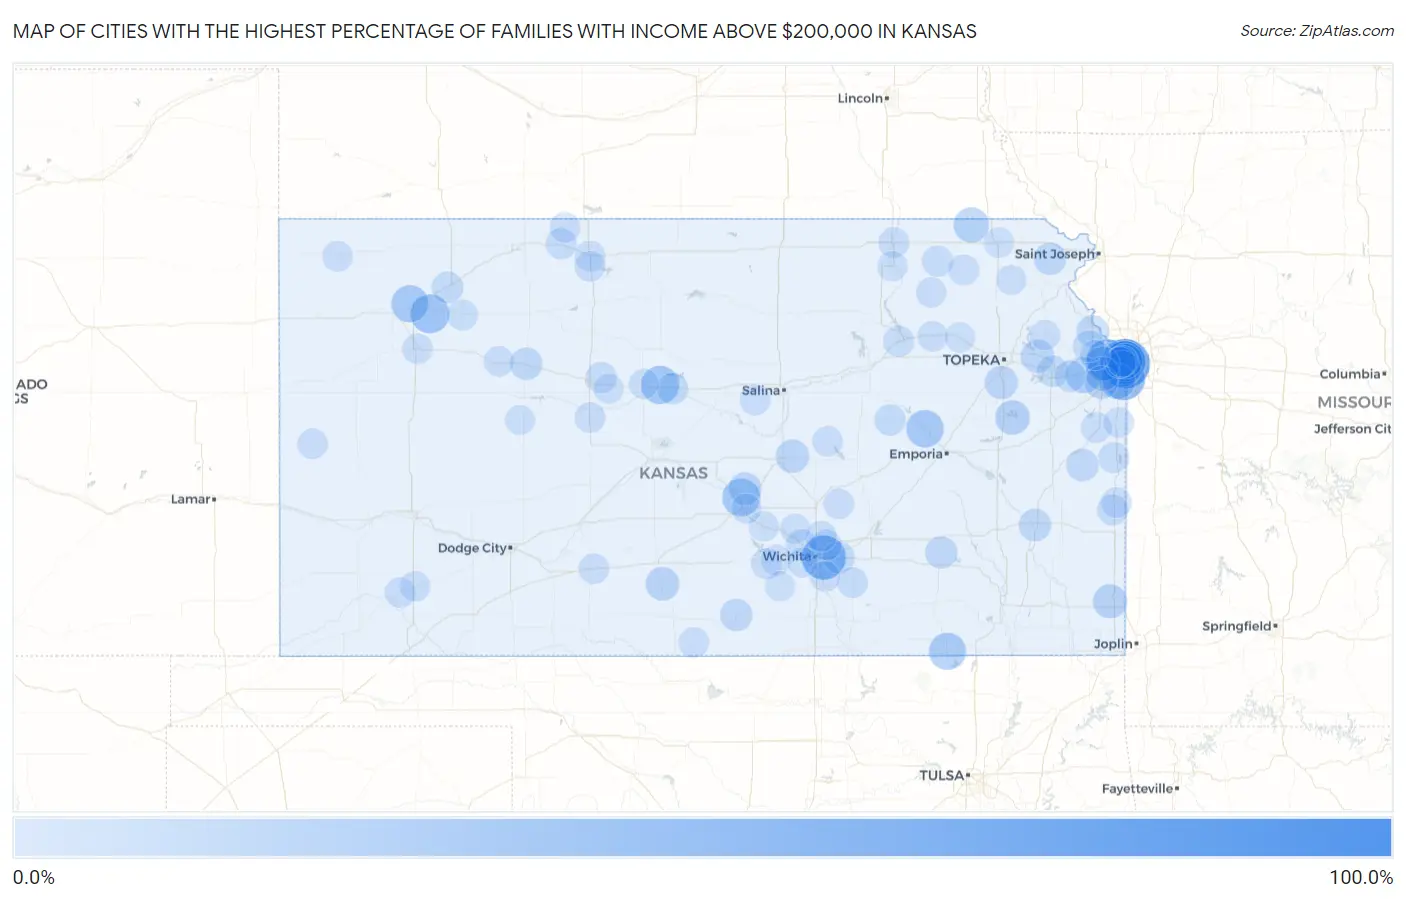
Map of Cities with the Highest Percentage of Families with Income Above $200,000 in Kansas
0.0%
100.0%
Cities with the Highest Percentage of Families with Income Above $200,000 in Kansas
| City | Families with Income > $200k | vs State | vs National | |
| 1. | Peck | 100.0% | 11.1%(+88.9)#1 | 14.8%(+85.2)#22 |
| 2. | Mission Hills | 75.6% | 11.1%(+64.5)#2 | 14.8%(+60.8)#112 |
| 3. | Piedmont | 61.1% | 11.1%(+50.0)#3 | 14.8%(+46.3)#379 |
| 4. | Bremen | 59.3% | 11.1%(+48.2)#4 | 14.8%(+44.5)#424 |
| 5. | Eastborough | 56.8% | 11.1%(+45.7)#5 | 14.8%(+42.0)#515 |
| 6. | Mission Woods | 55.1% | 11.1%(+44.0)#6 | 14.8%(+40.3)#576 |
| 7. | Fairway | 53.6% | 11.1%(+42.5)#7 | 14.8%(+38.8)#639 |
| 8. | Leawood | 51.6% | 11.1%(+40.5)#8 | 14.8%(+36.8)#721 |
| 9. | Lake Quivira | 47.4% | 11.1%(+36.3)#9 | 14.8%(+32.6)#911 |
| 10. | Westwood Hills | 43.7% | 11.1%(+32.6)#10 | 14.8%(+28.9)#1,127 |
| 11. | Menlo | 38.5% | 11.1%(+27.4)#11 | 14.8%(+23.7)#1,546 |
| 12. | Bunker Hill | 35.3% | 11.1%(+24.2)#12 | 14.8%(+20.5)#1,814 |
| 13. | Willowbrook | 34.8% | 11.1%(+23.7)#13 | 14.8%(+20.0)#1,864 |
| 14. | Dunlap | 33.3% | 11.1%(+22.2)#14 | 14.8%(+18.5)#2,016 |
| 15. | Gem | 32.1% | 11.1%(+21.0)#15 | 14.8%(+17.3)#2,148 |
| 16. | Chautauqua | 31.8% | 11.1%(+20.7)#16 | 14.8%(+17.0)#2,184 |
| 17. | Keats | 30.8% | 11.1%(+19.7)#17 | 14.8%(+16.0)#2,279 |
| 18. | Prairie Village | 29.4% | 11.1%(+18.3)#18 | 14.8%(+14.6)#2,440 |
| 19. | De Soto | 28.6% | 11.1%(+17.5)#19 | 14.8%(+13.8)#2,556 |
| 20. | Overland Park | 26.7% | 11.1%(+15.6)#20 | 14.8%(+11.9)#2,849 |
| 21. | Bern | 25.6% | 11.1%(+14.5)#21 | 14.8%(+10.8)#3,022 |
| 22. | Westwood | 25.1% | 11.1%(+14.0)#22 | 14.8%(+10.3)#3,093 |
| 23. | Shawnee | 23.0% | 11.1%(+11.9)#23 | 14.8%(+8.20)#3,450 |
| 24. | Vassar | 23.0% | 11.1%(+11.9)#24 | 14.8%(+8.20)#3,465 |
| 25. | Lenexa | 21.6% | 11.1%(+10.5)#25 | 14.8%(+6.80)#3,749 |
| 26. | Chicopee | 21.4% | 11.1%(+10.3)#26 | 14.8%(+6.60)#3,802 |
| 27. | St. Marks | 21.4% | 11.1%(+10.3)#27 | 14.8%(+6.60)#3,806 |
| 28. | Sawyer | 20.0% | 11.1%(+8.90)#28 | 14.8%(+5.20)#4,132 |
| 29. | Galva | 19.3% | 11.1%(+8.20)#29 | 14.8%(+4.50)#4,284 |
| 30. | Perry | 19.2% | 11.1%(+8.10)#30 | 14.8%(+4.40)#4,309 |
| 31. | Wakarusa | 18.5% | 11.1%(+7.40)#31 | 14.8%(+3.70)#4,501 |
| 32. | Tecumseh | 18.4% | 11.1%(+7.30)#32 | 14.8%(+3.60)#4,528 |
| 33. | Olathe | 18.1% | 11.1%(+7.00)#33 | 14.8%(+3.30)#4,590 |
| 34. | The Highlands | 18.1% | 11.1%(+7.00)#34 | 14.8%(+3.30)#4,615 |
| 35. | Bassett | 16.7% | 11.1%(+5.60)#35 | 14.8%(+1.90)#5,068 |
| 36. | Wakeeney | 16.4% | 11.1%(+5.30)#36 | 14.8%(+1.60)#5,144 |
| 37. | Denton | 16.3% | 11.1%(+5.20)#37 | 14.8%(+1.50)#5,184 |
| 38. | Parker | 16.0% | 11.1%(+4.90)#38 | 14.8%(+1.20)#5,289 |
| 39. | Harper | 15.9% | 11.1%(+4.80)#39 | 14.8%(+1.10)#5,322 |
| 40. | Climax | 15.8% | 11.1%(+4.70)#40 | 14.8%(+1.000)#5,375 |
| 41. | Lansing | 15.6% | 11.1%(+4.50)#41 | 14.8%(+0.800)#5,411 |
| 42. | Andover | 14.4% | 11.1%(+3.30)#42 | 14.8%(-0.400)#5,861 |
| 43. | Selden | 13.7% | 11.1%(+2.60)#43 | 14.8%(-1.10)#6,219 |
| 44. | Lawrence | 13.6% | 11.1%(+2.50)#44 | 14.8%(-1.20)#6,221 |
| 45. | Basehor | 13.4% | 11.1%(+2.30)#45 | 14.8%(-1.40)#6,320 |
| 46. | Dorrance | 13.0% | 11.1%(+1.90)#46 | 14.8%(-1.80)#6,536 |
| 47. | Eudora | 12.4% | 11.1%(+1.30)#47 | 14.8%(-2.40)#6,800 |
| 48. | Wilsey | 12.2% | 11.1%(+1.10)#48 | 14.8%(-2.60)#6,927 |
| 49. | Manhattan | 12.0% | 11.1%(+0.900)#49 | 14.8%(-2.80)#6,991 |
| 50. | Prairie View | 11.8% | 11.1%(+0.700)#50 | 14.8%(-3.00)#7,140 |
| 51. | Vermillion | 11.8% | 11.1%(+0.700)#51 | 14.8%(-3.00)#7,142 |
| 52. | Bel Aire | 11.6% | 11.1%(+0.500)#52 | 14.8%(-3.20)#7,205 |
| 53. | Catharine | 11.6% | 11.1%(+0.500)#53 | 14.8%(-3.20)#7,257 |
| 54. | Fulton | 11.5% | 11.1%(+0.400)#54 | 14.8%(-3.30)#7,328 |
| 55. | Maize | 11.4% | 11.1%(+0.300)#55 | 14.8%(-3.40)#7,361 |
| 56. | Linn Valley | 11.2% | 11.1%(+0.100)#56 | 14.8%(-3.60)#7,502 |
| 57. | Mission | 10.8% | 11.1%(-0.300)#57 | 14.8%(-4.00)#7,726 |
| 58. | Douglass | 10.6% | 11.1%(-0.500)#58 | 14.8%(-4.20)#7,860 |
| 59. | Paola | 10.5% | 11.1%(-0.600)#59 | 14.8%(-4.30)#7,902 |
| 60. | Kechi | 10.5% | 11.1%(-0.600)#60 | 14.8%(-4.30)#7,914 |
| 61. | Corning | 10.5% | 11.1%(-0.600)#61 | 14.8%(-4.30)#7,944 |
| 62. | Brookville | 10.4% | 11.1%(-0.700)#62 | 14.8%(-4.40)#8,010 |
| 63. | Phillipsburg | 10.3% | 11.1%(-0.800)#63 | 14.8%(-4.50)#8,043 |
| 64. | Hoxie | 10.2% | 11.1%(-0.900)#64 | 14.8%(-4.60)#8,124 |
| 65. | Prescott | 10.2% | 11.1%(-0.900)#65 | 14.8%(-4.60)#8,145 |
| 66. | Roeland Park | 10.1% | 11.1%(-1.00)#66 | 14.8%(-4.70)#8,171 |
| 67. | Marysville | 10.1% | 11.1%(-1.00)#67 | 14.8%(-4.70)#8,183 |
| 68. | Cheney | 10.0% | 11.1%(-1.10)#68 | 14.8%(-4.80)#8,268 |
| 69. | Elbing | 10.0% | 11.1%(-1.10)#69 | 14.8%(-4.80)#8,291 |
| 70. | Long Island | 10.0% | 11.1%(-1.10)#70 | 14.8%(-4.80)#8,299 |
| 71. | Liebenthal | 10.0% | 11.1%(-1.10)#71 | 14.8%(-4.80)#8,301 |
| 72. | Bird City | 9.9% | 11.1%(-1.20)#72 | 14.8%(-4.90)#8,380 |
| 73. | Garden Plain | 9.8% | 11.1%(-1.30)#73 | 14.8%(-5.00)#8,437 |
| 74. | Satanta | 9.8% | 11.1%(-1.30)#74 | 14.8%(-5.00)#8,441 |
| 75. | Tribune | 9.8% | 11.1%(-1.30)#75 | 14.8%(-5.00)#8,442 |
| 76. | Derby | 9.7% | 11.1%(-1.40)#76 | 14.8%(-5.10)#8,473 |
| 77. | Oakley | 9.6% | 11.1%(-1.50)#77 | 14.8%(-5.20)#8,566 |
| 78. | Greensburg | 9.6% | 11.1%(-1.50)#78 | 14.8%(-5.20)#8,588 |
| 79. | Collyer | 9.5% | 11.1%(-1.60)#79 | 14.8%(-5.30)#8,657 |
| 80. | Glade | 9.5% | 11.1%(-1.60)#80 | 14.8%(-5.30)#8,662 |
| 81. | Durham | 9.5% | 11.1%(-1.60)#81 | 14.8%(-5.30)#8,665 |
| 82. | Louisburg | 9.3% | 11.1%(-1.80)#82 | 14.8%(-5.50)#8,770 |
| 83. | Wamego | 9.2% | 11.1%(-1.90)#83 | 14.8%(-5.60)#8,856 |
| 84. | Sublette | 9.2% | 11.1%(-1.90)#84 | 14.8%(-5.60)#8,874 |
| 85. | Oskaloosa | 9.2% | 11.1%(-1.90)#85 | 14.8%(-5.60)#8,878 |
| 86. | Hazelton | 9.1% | 11.1%(-2.00)#86 | 14.8%(-5.70)#8,984 |
| 87. | Wheaton | 9.1% | 11.1%(-2.00)#87 | 14.8%(-5.70)#8,986 |
| 88. | Haven | 9.0% | 11.1%(-2.10)#88 | 14.8%(-5.80)#9,037 |
| 89. | Blue Rapids | 9.0% | 11.1%(-2.10)#89 | 14.8%(-5.80)#9,039 |
| 90. | Bentley | 8.8% | 11.1%(-2.30)#90 | 14.8%(-6.00)#9,195 |
| 91. | Fairview | 8.8% | 11.1%(-2.30)#91 | 14.8%(-6.00)#9,202 |
| 92. | Whiting | 8.8% | 11.1%(-2.30)#92 | 14.8%(-6.00)#9,206 |
| 93. | St Marys | 8.6% | 11.1%(-2.50)#93 | 14.8%(-6.20)#9,357 |
| 94. | South Hutchinson | 8.5% | 11.1%(-2.60)#94 | 14.8%(-6.30)#9,450 |
| 95. | Bonner Springs | 8.4% | 11.1%(-2.70)#95 | 14.8%(-6.40)#9,520 |
| 96. | Russell | 8.4% | 11.1%(-2.70)#96 | 14.8%(-6.40)#9,527 |
| 97. | Wichita | 8.3% | 11.1%(-2.80)#97 | 14.8%(-6.50)#9,569 |
| 98. | Victoria | 8.3% | 11.1%(-2.80)#98 | 14.8%(-6.50)#9,616 |
| 99. | Ransom | 8.3% | 11.1%(-2.80)#99 | 14.8%(-6.50)#9,643 |
| 100. | Viola | 8.3% | 11.1%(-2.80)#100 | 14.8%(-6.50)#9,647 |
Common Questions
What are the Top 10 Cities with the Highest Percentage of Families with Income Above $200,000 in Kansas?
Top 10 Cities with the Highest Percentage of Families with Income Above $200,000 in Kansas are:
#1
75.6%
#2
56.8%
#3
55.1%
#4
53.6%
#5
51.6%
#6
47.4%
#7
43.7%
#8
38.5%
#9
35.3%
#10
34.8%
What city has the Highest Percentage of Families with Income Above $200,000 in Kansas?
Mission Hills has the Highest Percentage of Families with Income Above $200,000 in Kansas with 75.6%.
What is the Percentage of Families with Income Above $200,000 in the State of Kansas?
Percentage of Families with Income Above $200,000 in Kansas is 11.1%.
What is the Percentage of Families with Income Above $200,000 in the United States?
Percentage of Families with Income Above $200,000 in the United States is 14.8%.