Cities with the Highest Percentage of Families with Income Above $200,000 in Georgia
RELATED REPORTS & OPTIONS
Family Income | $200k+
Georgia
Compare Cities
Map of Cities with the Highest Percentage of Families with Income Above $200,000 in Georgia
0.0%
80.0%
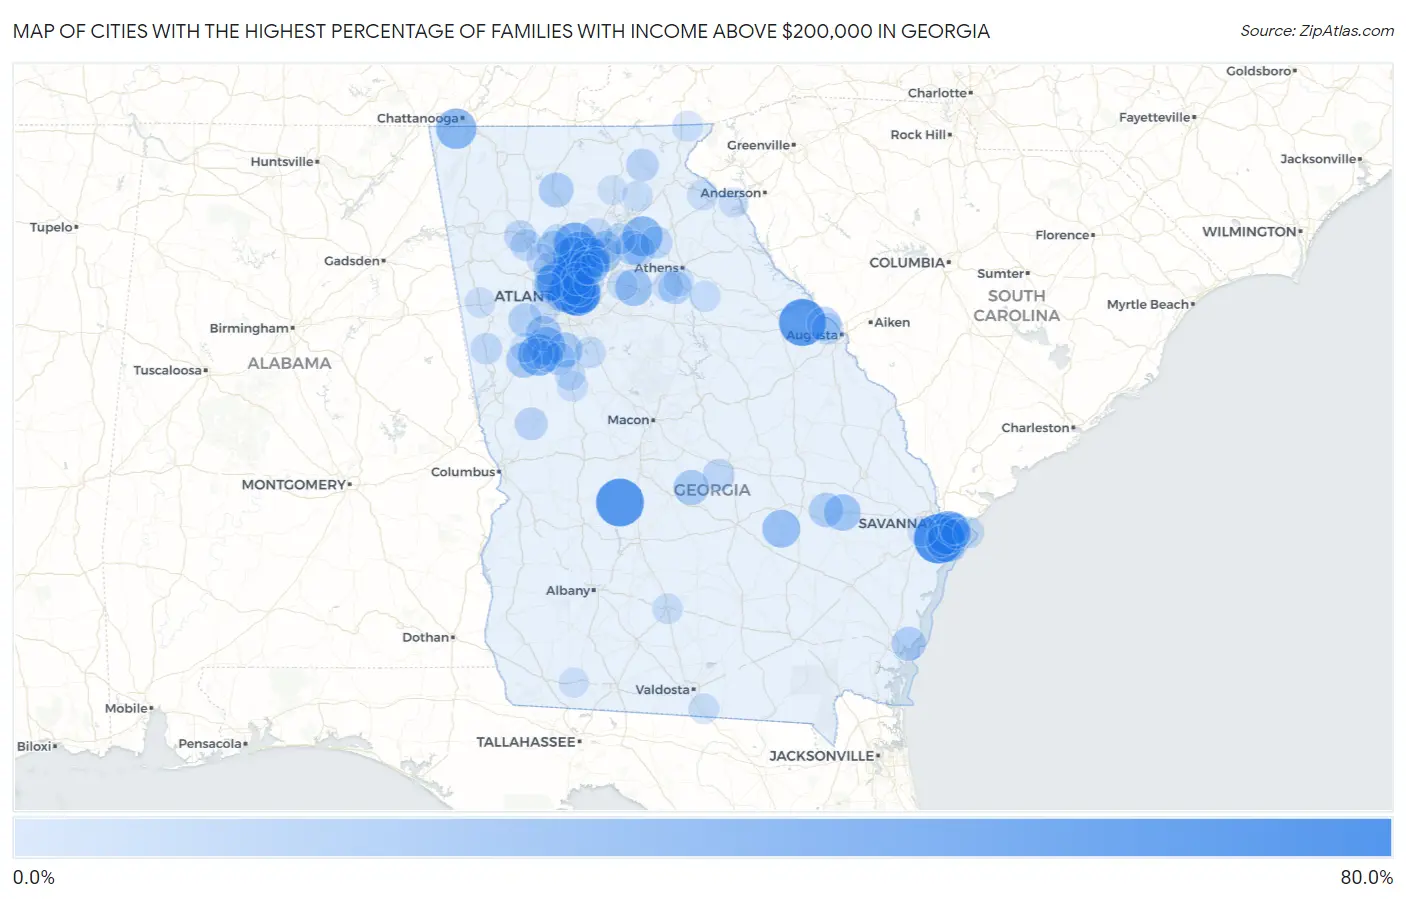
Cities with the Highest Percentage of Families with Income Above $200,000 in Georgia
| City | Families with Income > $200k | vs State | vs National | |
| 1. | Vernonburg | 64.7% | 13.0%(+51.7)#1 | 14.8%(+49.9)#272 |
| 2. | Dooling | 60.0% | 13.0%(+47.0)#2 | 14.8%(+45.2)#410 |
| 3. | Dixie | 59.2% | 13.0%(+46.2)#3 | 14.8%(+44.4)#428 |
| 4. | Appling | 57.4% | 13.0%(+44.4)#4 | 14.8%(+42.6)#495 |
| 5. | Druid Hills | 56.9% | 13.0%(+43.9)#5 | 14.8%(+42.1)#512 |
| 6. | Gardi | 55.6% | 13.0%(+42.6)#6 | 14.8%(+40.8)#559 |
| 7. | Decatur | 50.3% | 13.0%(+37.3)#7 | 14.8%(+35.5)#769 |
| 8. | Brookhaven | 47.9% | 13.0%(+34.9)#8 | 14.8%(+33.1)#883 |
| 9. | Dutch Island | 46.8% | 13.0%(+33.8)#9 | 14.8%(+32.0)#946 |
| 10. | Milton | 45.2% | 13.0%(+32.2)#10 | 14.8%(+30.4)#1,039 |
| 11. | Hortense | 45.1% | 13.0%(+32.1)#11 | 14.8%(+30.3)#1,051 |
| 12. | Alpharetta | 44.0% | 13.0%(+31.0)#12 | 14.8%(+29.2)#1,100 |
| 13. | Turin | 42.1% | 13.0%(+29.1)#13 | 14.8%(+27.3)#1,251 |
| 14. | Vinings | 40.5% | 13.0%(+27.5)#14 | 14.8%(+25.7)#1,367 |
| 15. | Dunwoody | 39.5% | 13.0%(+26.5)#15 | 14.8%(+24.7)#1,453 |
| 16. | Lookout Mountain | 39.3% | 13.0%(+26.3)#16 | 14.8%(+24.5)#1,485 |
| 17. | Talmo | 38.3% | 13.0%(+25.3)#17 | 14.8%(+23.5)#1,563 |
| 18. | Johns Creek | 37.5% | 13.0%(+24.5)#18 | 14.8%(+22.7)#1,615 |
| 19. | Avondale Estates | 36.9% | 13.0%(+23.9)#19 | 14.8%(+22.1)#1,666 |
| 20. | Skidaway Island | 36.3% | 13.0%(+23.3)#20 | 14.8%(+21.5)#1,721 |
| 21. | Sandy Springs | 35.3% | 13.0%(+22.3)#21 | 14.8%(+20.5)#1,801 |
| 22. | West Brow | 35.1% | 13.0%(+22.1)#22 | 14.8%(+20.3)#1,835 |
| 23. | Roswell | 35.0% | 13.0%(+22.0)#23 | 14.8%(+20.2)#1,838 |
| 24. | Berkeley Lake | 34.5% | 13.0%(+21.5)#24 | 14.8%(+19.7)#1,888 |
| 25. | Peachtree City | 33.2% | 13.0%(+20.2)#25 | 14.8%(+18.4)#2,021 |
| 26. | Uvalda | 32.3% | 13.0%(+19.3)#26 | 14.8%(+17.5)#2,126 |
| 27. | Between | 30.1% | 13.0%(+17.1)#27 | 14.8%(+15.3)#2,364 |
| 28. | Isle Of Hope | 29.3% | 13.0%(+16.3)#28 | 14.8%(+14.5)#2,471 |
| 29. | Atlanta | 28.8% | 13.0%(+15.8)#29 | 14.8%(+14.0)#2,525 |
| 30. | Bellville | 28.8% | 13.0%(+15.8)#30 | 14.8%(+14.0)#2,539 |
| 31. | North Druid Hills | 28.6% | 13.0%(+15.6)#31 | 14.8%(+13.8)#2,553 |
| 32. | Smyrna | 27.4% | 13.0%(+14.4)#32 | 14.8%(+12.6)#2,746 |
| 33. | North Decatur | 26.2% | 13.0%(+13.2)#33 | 14.8%(+11.4)#2,913 |
| 34. | Moreland | 26.1% | 13.0%(+13.1)#34 | 14.8%(+11.3)#2,933 |
| 35. | Tyrone | 25.9% | 13.0%(+12.9)#35 | 14.8%(+11.1)#2,967 |
| 36. | Empire | 25.2% | 13.0%(+12.2)#36 | 14.8%(+10.4)#3,083 |
| 37. | Woolsey | 25.0% | 13.0%(+12.0)#37 | 14.8%(+10.2)#3,116 |
| 38. | Talking Rock | 24.2% | 13.0%(+11.2)#38 | 14.8%(+9.40)#3,260 |
| 39. | Suwanee | 24.0% | 13.0%(+11.0)#39 | 14.8%(+9.20)#3,265 |
| 40. | Braselton | 23.9% | 13.0%(+10.9)#40 | 14.8%(+9.10)#3,295 |
| 41. | Collins | 23.5% | 13.0%(+10.5)#41 | 14.8%(+8.70)#3,380 |
| 42. | Evans | 22.7% | 13.0%(+9.70)#42 | 14.8%(+7.90)#3,511 |
| 43. | Peachtree Corners | 22.2% | 13.0%(+9.20)#43 | 14.8%(+7.40)#3,619 |
| 44. | St Simons | 22.1% | 13.0%(+9.10)#44 | 14.8%(+7.30)#3,651 |
| 45. | Smarr | 21.9% | 13.0%(+8.90)#45 | 14.8%(+7.10)#3,711 |
| 46. | Bolingbroke | 21.8% | 13.0%(+8.80)#46 | 14.8%(+7.00)#3,728 |
| 47. | Chattahoochee Hills | 21.2% | 13.0%(+8.20)#47 | 14.8%(+6.40)#3,840 |
| 48. | Woodstock | 21.0% | 13.0%(+8.00)#48 | 14.8%(+6.20)#3,881 |
| 49. | Whitemarsh Island | 20.4% | 13.0%(+7.40)#49 | 14.8%(+5.60)#4,020 |
| 50. | Bishop | 20.3% | 13.0%(+7.30)#50 | 14.8%(+5.50)#4,054 |
| 51. | Marietta | 19.4% | 13.0%(+6.40)#51 | 14.8%(+4.60)#4,244 |
| 52. | Sugar Hill | 19.4% | 13.0%(+6.40)#52 | 14.8%(+4.60)#4,248 |
| 53. | Brooks | 19.4% | 13.0%(+6.40)#53 | 14.8%(+4.60)#4,265 |
| 54. | Chamblee | 19.3% | 13.0%(+6.30)#54 | 14.8%(+4.50)#4,273 |
| 55. | Shiloh | 18.8% | 13.0%(+5.80)#55 | 14.8%(+4.00)#4,420 |
| 56. | Hoschton | 18.5% | 13.0%(+5.50)#56 | 14.8%(+3.70)#4,486 |
| 57. | Helen | 18.5% | 13.0%(+5.50)#57 | 14.8%(+3.70)#4,499 |
| 58. | Jefferson | 18.4% | 13.0%(+5.40)#58 | 14.8%(+3.60)#4,512 |
| 59. | Box Springs | 17.4% | 13.0%(+4.40)#59 | 14.8%(+2.60)#4,853 |
| 60. | Dexter | 17.3% | 13.0%(+4.30)#60 | 14.8%(+2.50)#4,879 |
| 61. | Cartersville | 17.2% | 13.0%(+4.20)#61 | 14.8%(+2.40)#4,897 |
| 62. | Fairfield Plantation | 16.9% | 13.0%(+3.90)#62 | 14.8%(+2.10)#4,976 |
| 63. | Martinez | 16.7% | 13.0%(+3.70)#63 | 14.8%(+1.90)#5,025 |
| 64. | Montgomery | 16.6% | 13.0%(+3.60)#64 | 14.8%(+1.80)#5,084 |
| 65. | Cumming | 16.3% | 13.0%(+3.30)#65 | 14.8%(+1.50)#5,168 |
| 66. | Emerson | 15.9% | 13.0%(+2.90)#66 | 14.8%(+1.10)#5,320 |
| 67. | Centralhatchee | 15.9% | 13.0%(+2.90)#67 | 14.8%(+1.10)#5,328 |
| 68. | Senoia | 15.7% | 13.0%(+2.70)#68 | 14.8%(+0.900)#5,387 |
| 69. | Talahi Island | 15.7% | 13.0%(+2.70)#69 | 14.8%(+0.900)#5,397 |
| 70. | Flowery Branch | 15.6% | 13.0%(+2.60)#70 | 14.8%(+0.800)#5,412 |
| 71. | Heron Bay | 15.6% | 13.0%(+2.60)#71 | 14.8%(+0.800)#5,419 |
| 72. | Holly Springs | 15.4% | 13.0%(+2.40)#72 | 14.8%(+0.600)#5,474 |
| 73. | Tybee Island | 15.1% | 13.0%(+2.10)#73 | 14.8%(+0.300)#5,602 |
| 74. | Maxeys | 14.7% | 13.0%(+1.70)#74 | 14.8%(-0.100)#5,761 |
| 75. | Zebulon | 14.0% | 13.0%(+1.00)#75 | 14.8%(-0.800)#6,054 |
| 76. | Sharpsburg | 14.0% | 13.0%(+1.00)#76 | 14.8%(-0.800)#6,063 |
| 77. | Sky Valley | 13.8% | 13.0%(+0.800)#77 | 14.8%(-1.00)#6,165 |
| 78. | Mableton | 13.6% | 13.0%(+0.600)#78 | 14.8%(-1.20)#6,225 |
| 79. | Williamson | 13.6% | 13.0%(+0.600)#79 | 14.8%(-1.20)#6,253 |
| 80. | Martin | 13.6% | 13.0%(+0.600)#80 | 14.8%(-1.20)#6,261 |
| 81. | Clermont | 13.4% | 13.0%(+0.400)#81 | 14.8%(-1.40)#6,342 |
| 82. | Lake Park | 13.4% | 13.0%(+0.400)#82 | 14.8%(-1.40)#6,344 |
| 83. | Unionville | 13.3% | 13.0%(+0.300)#83 | 14.8%(-1.50)#6,381 |
| 84. | North High Shoals | 13.3% | 13.0%(+0.300)#84 | 14.8%(-1.50)#6,387 |
| 85. | Loganville | 13.1% | 13.0%(+0.100)#85 | 14.8%(-1.70)#6,458 |
| 86. | Henderson | 13.1% | 13.0%(+0.100)#86 | 14.8%(-1.70)#6,466 |
| 87. | Watkinsville | 13.1% | 13.0%(+0.100)#87 | 14.8%(-1.70)#6,467 |
| 88. | Bremen | 12.9% | 13.0%(-0.100)#88 | 14.8%(-1.90)#6,559 |
| 89. | Waynesville | 12.9% | 13.0%(-0.100)#89 | 14.8%(-1.90)#6,585 |
| 90. | South Fulton | 12.8% | 13.0%(-0.200)#90 | 14.8%(-2.00)#6,597 |
| 91. | Kennesaw | 12.7% | 13.0%(-0.300)#91 | 14.8%(-2.10)#6,648 |
| 92. | Jekyll Island | 12.6% | 13.0%(-0.400)#92 | 14.8%(-2.20)#6,708 |
| 93. | Reed Creek | 12.4% | 13.0%(-0.600)#93 | 14.8%(-2.40)#6,807 |
| 94. | Tucker | 12.3% | 13.0%(-0.700)#94 | 14.8%(-2.50)#6,836 |
| 95. | Newnan | 12.2% | 13.0%(-0.800)#95 | 14.8%(-2.60)#6,885 |
| 96. | Whigham | 12.2% | 13.0%(-0.800)#96 | 14.8%(-2.60)#6,917 |
| 97. | Duluth | 12.1% | 13.0%(-0.900)#97 | 14.8%(-2.70)#6,940 |
| 98. | Norcross | 12.0% | 13.0%(-1.00)#98 | 14.8%(-2.80)#6,997 |
| 99. | Wilmington Island | 11.9% | 13.0%(-1.10)#99 | 14.8%(-2.90)#7,052 |
| 100. | Dahlonega | 11.9% | 13.0%(-1.10)#100 | 14.8%(-2.90)#7,061 |
Common Questions
What are the Top 10 Cities with the Highest Percentage of Families with Income Above $200,000 in Georgia?
Top 10 Cities with the Highest Percentage of Families with Income Above $200,000 in Georgia are:
#1
64.7%
#2
60.0%
#3
57.4%
#4
56.9%
#5
50.3%
#6
47.9%
#7
46.8%
#8
45.2%
#9
44.0%
#10
42.1%
What city has the Highest Percentage of Families with Income Above $200,000 in Georgia?
Vernonburg has the Highest Percentage of Families with Income Above $200,000 in Georgia with 64.7%.
What is the Percentage of Families with Income Above $200,000 in the State of Georgia?
Percentage of Families with Income Above $200,000 in Georgia is 13.0%.
What is the Percentage of Families with Income Above $200,000 in the United States?
Percentage of Families with Income Above $200,000 in the United States is 14.8%.