Cities with the Highest Percentage of Families with Income Above $200,000 in Michigan
RELATED REPORTS & OPTIONS
Family Income | $200k+
Michigan
Compare Cities
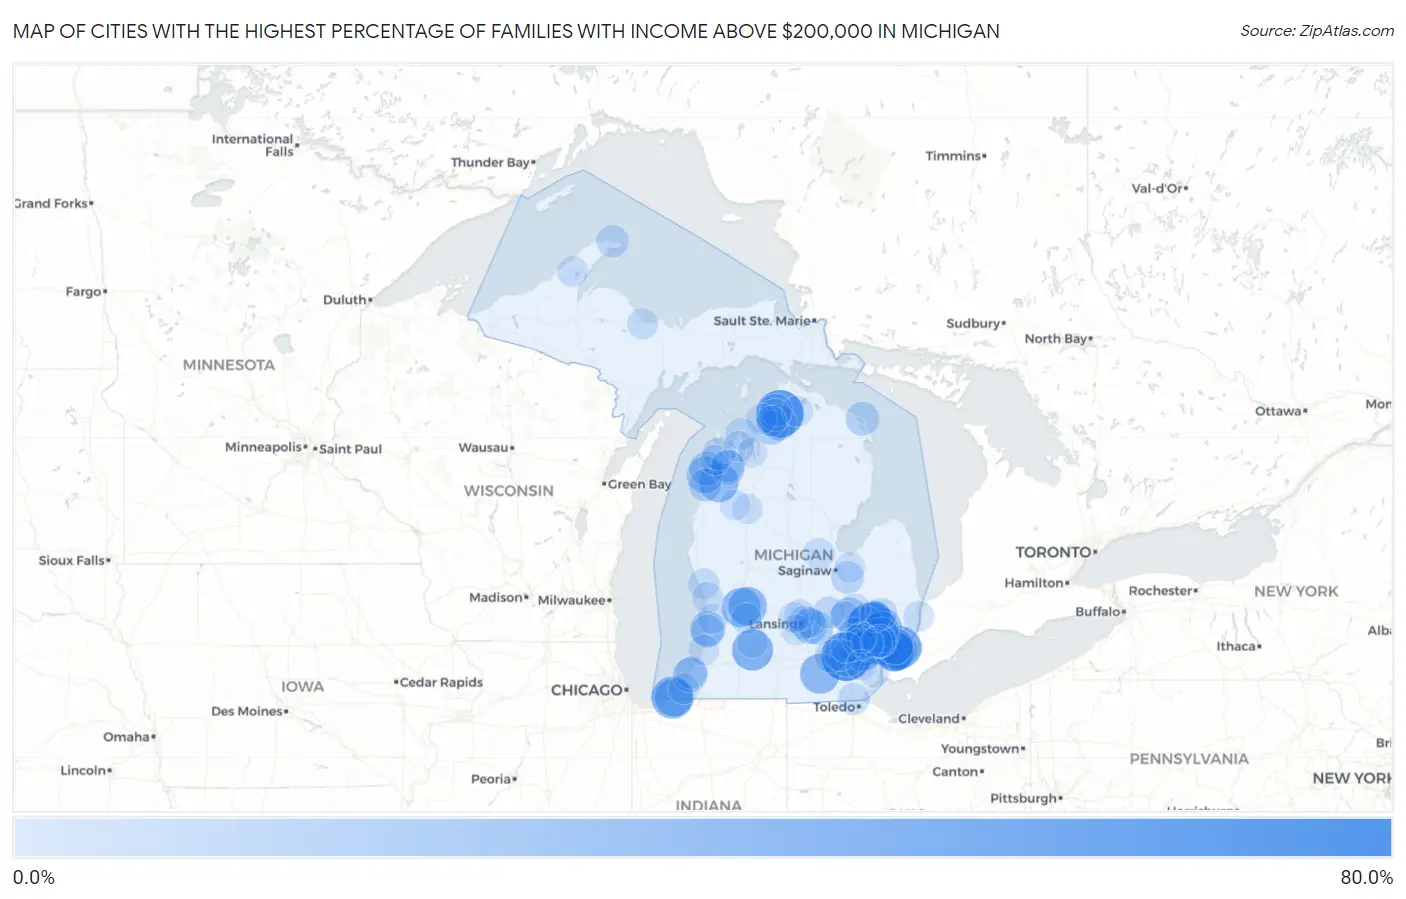
Map of Cities with the Highest Percentage of Families with Income Above $200,000 in Michigan
0.0%
80.0%
Cities with the Highest Percentage of Families with Income Above $200,000 in Michigan
| City | Families with Income > $200k | vs State | vs National | |
| 1. | Barton Hills | 72.4% | 11.3%(+61.1)#1 | 14.8%(+57.6)#146 |
| 2. | Lake Angelus | 67.0% | 11.3%(+55.7)#2 | 14.8%(+52.2)#226 |
| 3. | Bay View | 65.8% | 11.3%(+54.5)#3 | 14.8%(+51.0)#252 |
| 4. | Bloomfield Hills | 57.9% | 11.3%(+46.6)#4 | 14.8%(+43.1)#473 |
| 5. | Bingham Farms | 57.5% | 11.3%(+46.2)#5 | 14.8%(+42.7)#490 |
| 6. | Birmingham | 56.6% | 11.3%(+45.3)#6 | 14.8%(+41.8)#522 |
| 7. | Orchard Lake Village | 54.0% | 11.3%(+42.7)#7 | 14.8%(+39.2)#620 |
| 8. | Village Of Grosse Pointe Shores | 51.6% | 11.3%(+40.3)#8 | 14.8%(+36.8)#726 |
| 9. | Huntington Woods | 49.5% | 11.3%(+38.2)#9 | 14.8%(+34.7)#816 |
| 10. | Michiana | 49.0% | 11.3%(+37.7)#10 | 14.8%(+34.2)#844 |
| 11. | Beverly Hills | 48.5% | 11.3%(+37.2)#11 | 14.8%(+33.7)#862 |
| 12. | Franklin | 47.9% | 11.3%(+36.6)#12 | 14.8%(+33.1)#887 |
| 13. | Pleasant Ridge | 47.7% | 11.3%(+36.4)#13 | 14.8%(+32.9)#898 |
| 14. | South Gull Lake | 46.5% | 11.3%(+35.2)#14 | 14.8%(+31.7)#968 |
| 15. | Northville | 45.7% | 11.3%(+34.4)#15 | 14.8%(+30.9)#1,007 |
| 16. | Grosse Pointe Farms | 43.0% | 11.3%(+31.7)#16 | 14.8%(+28.2)#1,171 |
| 17. | Sylvan Lake | 43.0% | 11.3%(+31.7)#17 | 14.8%(+28.2)#1,173 |
| 18. | Grosse Pointe Park | 42.8% | 11.3%(+31.5)#18 | 14.8%(+28.0)#1,189 |
| 19. | Vineyard Lake | 42.3% | 11.3%(+31.0)#19 | 14.8%(+27.5)#1,236 |
| 20. | Grosse Pointe | 41.8% | 11.3%(+30.5)#20 | 14.8%(+27.0)#1,277 |
| 21. | Crystal Mountain | 41.4% | 11.3%(+30.1)#21 | 14.8%(+26.6)#1,302 |
| 22. | East Grand Rapids | 41.0% | 11.3%(+29.7)#22 | 14.8%(+26.2)#1,322 |
| 23. | Forest Hills | 39.4% | 11.3%(+28.1)#23 | 14.8%(+24.6)#1,465 |
| 24. | Rochester | 39.4% | 11.3%(+28.1)#24 | 14.8%(+24.6)#1,467 |
| 25. | Plymouth | 39.4% | 11.3%(+28.1)#25 | 14.8%(+24.6)#1,470 |
| 26. | Grand Beach | 38.3% | 11.3%(+27.0)#26 | 14.8%(+23.5)#1,564 |
| 27. | Elberta | 32.7% | 11.3%(+21.4)#27 | 14.8%(+17.9)#2,073 |
| 28. | Grosse Pointe Woods | 32.4% | 11.3%(+21.1)#28 | 14.8%(+17.6)#2,101 |
| 29. | Lake Orion | 32.1% | 11.3%(+20.8)#29 | 14.8%(+17.3)#2,142 |
| 30. | Novi | 30.5% | 11.3%(+19.2)#30 | 14.8%(+15.7)#2,305 |
| 31. | Ann Arbor | 30.0% | 11.3%(+18.7)#31 | 14.8%(+15.2)#2,365 |
| 32. | Walloon Lake | 29.9% | 11.3%(+18.6)#32 | 14.8%(+15.1)#2,386 |
| 33. | Village Of Clarkston | 29.7% | 11.3%(+18.4)#33 | 14.8%(+14.9)#2,411 |
| 34. | Lake Fenton | 29.2% | 11.3%(+17.9)#34 | 14.8%(+14.4)#2,477 |
| 35. | Rochester Hills | 28.8% | 11.3%(+17.5)#35 | 14.8%(+14.0)#2,526 |
| 36. | Saugatuck | 28.4% | 11.3%(+17.1)#36 | 14.8%(+13.6)#2,600 |
| 37. | Troy | 28.0% | 11.3%(+16.7)#37 | 14.8%(+13.2)#2,648 |
| 38. | Maple Grove | 28.0% | 11.3%(+16.7)#38 | 14.8%(+13.2)#2,663 |
| 39. | Okemos | 27.3% | 11.3%(+16.0)#39 | 14.8%(+12.5)#2,763 |
| 40. | Shoreham | 26.6% | 11.3%(+15.3)#40 | 14.8%(+11.8)#2,871 |
| 41. | Advance | 26.1% | 11.3%(+14.8)#41 | 14.8%(+11.3)#2,936 |
| 42. | Milford | 26.0% | 11.3%(+14.7)#42 | 14.8%(+11.2)#2,946 |
| 43. | Crystal Downs Country Club | 25.0% | 11.3%(+13.7)#43 | 14.8%(+10.2)#3,125 |
| 44. | Williamston | 24.9% | 11.3%(+13.6)#44 | 14.8%(+10.1)#3,140 |
| 45. | Presque Isle Harbor | 24.6% | 11.3%(+13.3)#45 | 14.8%(+9.80)#3,191 |
| 46. | Royal Oak | 23.5% | 11.3%(+12.2)#46 | 14.8%(+8.70)#3,371 |
| 47. | East Lansing | 22.9% | 11.3%(+11.6)#47 | 14.8%(+8.10)#3,470 |
| 48. | South Lyon | 22.4% | 11.3%(+11.1)#48 | 14.8%(+7.60)#3,585 |
| 49. | Douglas | 22.1% | 11.3%(+10.8)#49 | 14.8%(+7.30)#3,661 |
| 50. | Chelsea | 22.0% | 11.3%(+10.7)#50 | 14.8%(+7.20)#3,673 |
| 51. | Berkley | 21.8% | 11.3%(+10.5)#51 | 14.8%(+7.00)#3,717 |
| 52. | Arcadia | 21.2% | 11.3%(+9.90)#52 | 14.8%(+6.40)#3,854 |
| 53. | Frankenmuth | 21.1% | 11.3%(+9.80)#53 | 14.8%(+6.30)#3,866 |
| 54. | Farmington Hills | 21.0% | 11.3%(+9.70)#54 | 14.8%(+6.20)#3,880 |
| 55. | Harbor Springs | 20.9% | 11.3%(+9.60)#55 | 14.8%(+6.10)#3,914 |
| 56. | Glen Arbor | 20.9% | 11.3%(+9.60)#56 | 14.8%(+6.10)#3,921 |
| 57. | Lake Ann | 20.8% | 11.3%(+9.50)#57 | 14.8%(+6.00)#3,933 |
| 58. | Copper Harbor | 20.7% | 11.3%(+9.40)#58 | 14.8%(+5.90)#3,960 |
| 59. | St Joseph | 20.1% | 11.3%(+8.80)#59 | 14.8%(+5.30)#4,092 |
| 60. | Petoskey | 19.6% | 11.3%(+8.30)#60 | 14.8%(+4.80)#4,204 |
| 61. | Wixom | 19.3% | 11.3%(+8.00)#61 | 14.8%(+4.50)#4,276 |
| 62. | Bancroft | 19.1% | 11.3%(+7.80)#62 | 14.8%(+4.30)#4,341 |
| 63. | Lambertville | 18.9% | 11.3%(+7.60)#63 | 14.8%(+4.10)#4,381 |
| 64. | Leonard | 18.8% | 11.3%(+7.50)#64 | 14.8%(+4.00)#4,425 |
| 65. | Oxford | 18.1% | 11.3%(+6.80)#65 | 14.8%(+3.30)#4,602 |
| 66. | Dexter | 18.0% | 11.3%(+6.70)#66 | 14.8%(+3.20)#4,639 |
| 67. | Northport | 17.9% | 11.3%(+6.60)#67 | 14.8%(+3.10)#4,670 |
| 68. | Farmington | 17.7% | 11.3%(+6.40)#68 | 14.8%(+2.90)#4,723 |
| 69. | Lathrup Village | 17.1% | 11.3%(+5.80)#69 | 14.8%(+2.30)#4,928 |
| 70. | Midland | 16.8% | 11.3%(+5.50)#70 | 14.8%(+2.00)#5,000 |
| 71. | Whitmore Lake | 16.5% | 11.3%(+5.20)#71 | 14.8%(+1.70)#5,105 |
| 72. | Harvey | 16.5% | 11.3%(+5.20)#72 | 14.8%(+1.70)#5,109 |
| 73. | North Muskegon | 16.4% | 11.3%(+5.10)#73 | 14.8%(+1.60)#5,140 |
| 74. | Haslett | 16.3% | 11.3%(+5.00)#74 | 14.8%(+1.50)#5,162 |
| 75. | Caledonia | 16.2% | 11.3%(+4.90)#75 | 14.8%(+1.40)#5,212 |
| 76. | Indian River | 16.0% | 11.3%(+4.70)#76 | 14.8%(+1.20)#5,276 |
| 77. | Shorewood Tower Hills Harbert | 16.0% | 11.3%(+4.70)#77 | 14.8%(+1.20)#5,278 |
| 78. | Lamont | 16.0% | 11.3%(+4.70)#78 | 14.8%(+1.20)#5,283 |
| 79. | Dewitt | 15.9% | 11.3%(+4.60)#79 | 14.8%(+1.10)#5,311 |
| 80. | Dimondale | 15.9% | 11.3%(+4.60)#80 | 14.8%(+1.10)#5,319 |
| 81. | Delton | 15.9% | 11.3%(+4.60)#81 | 14.8%(+1.10)#5,325 |
| 82. | Wacousta | 15.7% | 11.3%(+4.40)#82 | 14.8%(+0.900)#5,394 |
| 83. | St Clair | 15.6% | 11.3%(+4.30)#83 | 14.8%(+0.800)#5,417 |
| 84. | Houghton | 15.4% | 11.3%(+4.10)#84 | 14.8%(+0.600)#5,482 |
| 85. | Wolverine Lake | 15.4% | 11.3%(+4.10)#85 | 14.8%(+0.600)#5,488 |
| 86. | Spring Lake | 15.4% | 11.3%(+4.10)#86 | 14.8%(+0.600)#5,492 |
| 87. | Suttons Bay | 15.4% | 11.3%(+4.10)#87 | 14.8%(+0.600)#5,504 |
| 88. | South Haven | 15.2% | 11.3%(+3.90)#88 | 14.8%(+0.400)#5,556 |
| 89. | Charlevoix | 15.1% | 11.3%(+3.80)#89 | 14.8%(+0.300)#5,606 |
| 90. | Horton Bay | 15.0% | 11.3%(+3.70)#90 | 14.8%(+0.200)#5,657 |
| 91. | Wedgewood | 14.9% | 11.3%(+3.60)#91 | 14.8%(+0.100)#5,695 |
| 92. | Reese | 14.8% | 11.3%(+3.50)#92 | 14.8%(=0.000)#5,722 |
| 93. | Grand Blanc | 14.7% | 11.3%(+3.40)#93 | 14.8%(-0.100)#5,742 |
| 94. | Beechwood | 14.3% | 11.3%(+3.00)#94 | 14.8%(-0.500)#5,908 |
| 95. | Caberfae | 14.3% | 11.3%(+3.00)#95 | 14.8%(-0.500)#5,937 |
| 96. | Linden | 14.2% | 11.3%(+2.90)#96 | 14.8%(-0.600)#5,964 |
| 97. | Empire | 14.2% | 11.3%(+2.90)#97 | 14.8%(-0.600)#5,981 |
| 98. | Belleville | 14.1% | 11.3%(+2.80)#98 | 14.8%(-0.700)#5,998 |
| 99. | Elk Rapids | 13.8% | 11.3%(+2.50)#99 | 14.8%(-1.00)#6,152 |
| 100. | Flat Rock | 13.6% | 11.3%(+2.30)#100 | 14.8%(-1.20)#6,234 |
Common Questions
What are the Top 10 Cities with the Highest Percentage of Families with Income Above $200,000 in Michigan?
Top 10 Cities with the Highest Percentage of Families with Income Above $200,000 in Michigan are:
#1
72.4%
#2
67.0%
#3
65.8%
#4
57.9%
#5
57.5%
#6
56.6%
#7
54.0%
#8
51.6%
#9
49.5%
#10
49.0%
What city has the Highest Percentage of Families with Income Above $200,000 in Michigan?
Barton Hills has the Highest Percentage of Families with Income Above $200,000 in Michigan with 72.4%.
What is the Percentage of Families with Income Above $200,000 in the State of Michigan?
Percentage of Families with Income Above $200,000 in Michigan is 11.3%.
What is the Percentage of Families with Income Above $200,000 in the United States?
Percentage of Families with Income Above $200,000 in the United States is 14.8%.