Cities with the Highest Percentage of Families with Income Above $200,000 in Nebraska
RELATED REPORTS & OPTIONS
Family Income | $200k+
Nebraska
Compare Cities
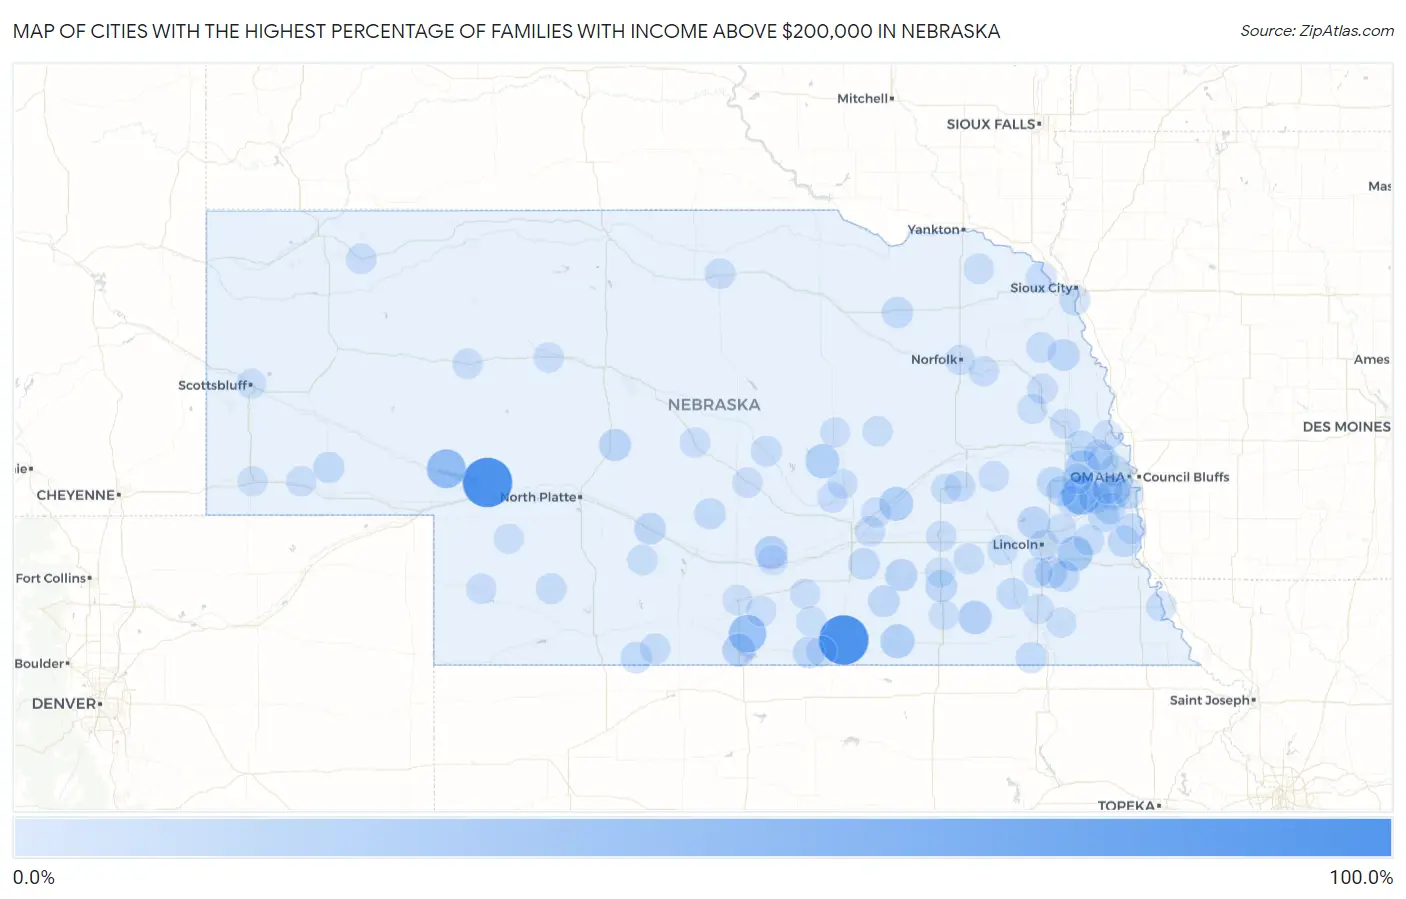
Map of Cities with the Highest Percentage of Families with Income Above $200,000 in Nebraska
0.0%
100.0%
Cities with the Highest Percentage of Families with Income Above $200,000 in Nebraska
| City | Families with Income > $200k | vs State | vs National | |
| 1. | Keystone | 100.0% | 10.9%(+89.1)#1 | 14.8%(+85.2)#43 |
| 2. | Cowles | 100.0% | 10.9%(+89.1)#2 | 14.8%(+85.2)#52 |
| 3. | Wann | 50.0% | 10.9%(+39.1)#3 | 14.8%(+35.2)#790 |
| 4. | Melia | 50.0% | 10.9%(+39.1)#4 | 14.8%(+35.2)#793 |
| 5. | Belmar | 47.2% | 10.9%(+36.3)#5 | 14.8%(+32.4)#924 |
| 6. | Huntley | 41.7% | 10.9%(+30.8)#6 | 14.8%(+26.9)#1,287 |
| 7. | Woodland Hills | 30.6% | 10.9%(+19.7)#7 | 14.8%(+15.8)#2,303 |
| 8. | Valley | 25.9% | 10.9%(+15.0)#8 | 14.8%(+11.1)#2,971 |
| 9. | Overland | 25.0% | 10.9%(+14.1)#9 | 14.8%(+10.2)#3,117 |
| 10. | Cotesfield | 25.0% | 10.9%(+14.1)#10 | 14.8%(+10.2)#3,129 |
| 11. | Nora | 25.0% | 10.9%(+14.1)#11 | 14.8%(+10.2)#3,130 |
| 12. | Daykin | 22.4% | 10.9%(+11.5)#12 | 14.8%(+7.60)#3,599 |
| 13. | Glenwood | 21.2% | 10.9%(+10.3)#13 | 14.8%(+6.40)#3,849 |
| 14. | Alma | 20.0% | 10.9%(+9.10)#14 | 14.8%(+5.20)#4,122 |
| 15. | Papillion | 17.4% | 10.9%(+6.50)#15 | 14.8%(+2.60)#4,820 |
| 16. | Raymond | 17.3% | 10.9%(+6.40)#16 | 14.8%(+2.50)#4,886 |
| 17. | Gretna | 17.0% | 10.9%(+6.10)#17 | 14.8%(+2.20)#4,947 |
| 18. | Saronville | 16.7% | 10.9%(+5.80)#18 | 14.8%(+1.90)#5,059 |
| 19. | Gandy | 16.7% | 10.9%(+5.80)#19 | 14.8%(+1.90)#5,067 |
| 20. | Hickman | 16.3% | 10.9%(+5.40)#20 | 14.8%(+1.50)#5,171 |
| 21. | Rosalie | 15.8% | 10.9%(+4.90)#21 | 14.8%(+1.000)#5,370 |
| 22. | Riverton | 15.4% | 10.9%(+4.50)#22 | 14.8%(+0.600)#5,508 |
| 23. | Fairfield | 15.0% | 10.9%(+4.10)#23 | 14.8%(+0.200)#5,658 |
| 24. | Nehawka | 15.0% | 10.9%(+4.10)#24 | 14.8%(+0.200)#5,661 |
| 25. | Geneva | 14.7% | 10.9%(+3.80)#25 | 14.8%(-0.100)#5,750 |
| 26. | Gothenburg | 14.5% | 10.9%(+3.60)#26 | 14.8%(-0.300)#5,825 |
| 27. | Arlington | 14.2% | 10.9%(+3.30)#27 | 14.8%(-0.600)#5,976 |
| 28. | Panama | 14.1% | 10.9%(+3.20)#28 | 14.8%(-0.700)#6,021 |
| 29. | Trumbull | 14.1% | 10.9%(+3.20)#29 | 14.8%(-0.700)#6,022 |
| 30. | Wilber | 13.8% | 10.9%(+2.90)#30 | 14.8%(-1.00)#6,149 |
| 31. | Louisville | 13.4% | 10.9%(+2.50)#31 | 14.8%(-1.40)#6,339 |
| 32. | Wahoo | 13.3% | 10.9%(+2.40)#32 | 14.8%(-1.50)#6,373 |
| 33. | Brunswick | 13.3% | 10.9%(+2.40)#33 | 14.8%(-1.50)#6,392 |
| 34. | Lebanon | 13.3% | 10.9%(+2.40)#34 | 14.8%(-1.50)#6,397 |
| 35. | Omaha | 13.0% | 10.9%(+2.10)#35 | 14.8%(-1.80)#6,488 |
| 36. | Gurley | 12.9% | 10.9%(+2.00)#36 | 14.8%(-1.90)#6,588 |
| 37. | Eddyville | 12.9% | 10.9%(+2.00)#37 | 14.8%(-1.90)#6,593 |
| 38. | Odell | 12.8% | 10.9%(+1.90)#38 | 14.8%(-2.00)#6,639 |
| 39. | Cedar Creek | 12.6% | 10.9%(+1.70)#39 | 14.8%(-2.20)#6,711 |
| 40. | Bennington | 11.1% | 10.9%(+0.200)#40 | 14.8%(-3.70)#7,557 |
| 41. | Memphis | 11.1% | 10.9%(+0.200)#41 | 14.8%(-3.70)#7,592 |
| 42. | Wilsonville | 11.1% | 10.9%(+0.200)#42 | 14.8%(-3.70)#7,595 |
| 43. | Ponca | 10.9% | 10.9%(=0.000)#43 | 14.8%(-3.90)#7,705 |
| 44. | Arcadia | 10.9% | 10.9%(=0.000)#44 | 14.8%(-3.90)#7,711 |
| 45. | Washington | 10.9% | 10.9%(=0.000)#45 | 14.8%(-3.90)#7,714 |
| 46. | Lincoln | 10.8% | 10.9%(-0.100)#46 | 14.8%(-4.00)#7,718 |
| 47. | Dakota City | 10.8% | 10.9%(-0.100)#47 | 14.8%(-4.00)#7,740 |
| 48. | Hayes Center | 10.8% | 10.9%(-0.100)#48 | 14.8%(-4.00)#7,766 |
| 49. | Inavale | 10.7% | 10.9%(-0.200)#49 | 14.8%(-4.10)#7,831 |
| 50. | La Vista | 10.5% | 10.9%(-0.400)#50 | 14.8%(-4.30)#7,894 |
| 51. | Elmwood | 10.5% | 10.9%(-0.400)#51 | 14.8%(-4.30)#7,929 |
| 52. | Bassett | 10.4% | 10.9%(-0.500)#52 | 14.8%(-4.40)#8,002 |
| 53. | Cordova | 10.3% | 10.9%(-0.600)#53 | 14.8%(-4.50)#8,086 |
| 54. | Shelby | 9.9% | 10.9%(-1.000)#54 | 14.8%(-4.90)#8,376 |
| 55. | Hay Springs | 9.8% | 10.9%(-1.10)#55 | 14.8%(-5.00)#8,448 |
| 56. | Pender | 9.7% | 10.9%(-1.20)#56 | 14.8%(-5.10)#8,515 |
| 57. | Imperial | 9.6% | 10.9%(-1.30)#57 | 14.8%(-5.20)#8,564 |
| 58. | York | 9.3% | 10.9%(-1.60)#58 | 14.8%(-5.50)#8,765 |
| 59. | Yutan | 9.3% | 10.9%(-1.60)#59 | 14.8%(-5.50)#8,790 |
| 60. | Farnam | 9.3% | 10.9%(-1.60)#60 | 14.8%(-5.50)#8,823 |
| 61. | Norfolk | 9.2% | 10.9%(-1.70)#61 | 14.8%(-5.60)#8,836 |
| 62. | David City | 9.2% | 10.9%(-1.70)#62 | 14.8%(-5.60)#8,860 |
| 63. | Murray | 9.2% | 10.9%(-1.70)#63 | 14.8%(-5.60)#8,891 |
| 64. | Chalco | 9.1% | 10.9%(-1.80)#64 | 14.8%(-5.70)#8,907 |
| 65. | Milford | 9.1% | 10.9%(-1.80)#65 | 14.8%(-5.70)#8,928 |
| 66. | Stanton | 9.1% | 10.9%(-1.80)#66 | 14.8%(-5.70)#8,933 |
| 67. | Wilcox | 9.1% | 10.9%(-1.80)#67 | 14.8%(-5.70)#8,964 |
| 68. | West Point | 9.0% | 10.9%(-1.90)#68 | 14.8%(-5.80)#9,024 |
| 69. | Phillips | 8.9% | 10.9%(-2.00)#69 | 14.8%(-5.90)#9,114 |
| 70. | Ithaca | 8.9% | 10.9%(-2.00)#70 | 14.8%(-5.90)#9,122 |
| 71. | Bellevue | 8.8% | 10.9%(-2.10)#71 | 14.8%(-6.00)#9,128 |
| 72. | Brownville | 8.8% | 10.9%(-2.10)#72 | 14.8%(-6.00)#9,210 |
| 73. | Hyannis | 8.8% | 10.9%(-2.10)#73 | 14.8%(-6.00)#9,211 |
| 74. | Hartington | 8.7% | 10.9%(-2.20)#74 | 14.8%(-6.10)#9,269 |
| 75. | Potter | 8.7% | 10.9%(-2.20)#75 | 14.8%(-6.10)#9,295 |
| 76. | Sprague | 8.7% | 10.9%(-2.20)#76 | 14.8%(-6.10)#9,304 |
| 77. | Osceola | 8.6% | 10.9%(-2.30)#77 | 14.8%(-6.20)#9,389 |
| 78. | Cedar Rapids | 8.5% | 10.9%(-2.40)#78 | 14.8%(-6.30)#9,476 |
| 79. | Mason City | 8.5% | 10.9%(-2.40)#79 | 14.8%(-6.30)#9,500 |
| 80. | Merna | 8.3% | 10.9%(-2.60)#80 | 14.8%(-6.50)#9,637 |
| 81. | Dannebrog | 8.3% | 10.9%(-2.60)#81 | 14.8%(-6.50)#9,645 |
| 82. | Winslow | 8.3% | 10.9%(-2.60)#82 | 14.8%(-6.50)#9,656 |
| 83. | Norman | 8.3% | 10.9%(-2.60)#83 | 14.8%(-6.50)#9,668 |
| 84. | Mullen | 8.2% | 10.9%(-2.70)#84 | 14.8%(-6.60)#9,759 |
| 85. | Snyder | 8.2% | 10.9%(-2.70)#85 | 14.8%(-6.60)#9,763 |
| 86. | Campbell | 8.2% | 10.9%(-2.70)#86 | 14.8%(-6.60)#9,764 |
| 87. | Kearney | 8.1% | 10.9%(-2.80)#87 | 14.8%(-6.70)#9,779 |
| 88. | Holdrege | 8.1% | 10.9%(-2.80)#88 | 14.8%(-6.70)#9,800 |
| 89. | Waverly | 8.1% | 10.9%(-2.80)#89 | 14.8%(-6.70)#9,803 |
| 90. | Chapman | 8.1% | 10.9%(-2.80)#90 | 14.8%(-6.70)#9,858 |
| 91. | Kimball | 8.0% | 10.9%(-2.90)#91 | 14.8%(-6.80)#9,916 |
| 92. | Blair | 7.9% | 10.9%(-3.00)#92 | 14.8%(-6.90)#9,992 |
| 93. | Greeley Center | 7.8% | 10.9%(-3.10)#93 | 14.8%(-7.00)#10,138 |
| 94. | Bruning | 7.7% | 10.9%(-3.20)#94 | 14.8%(-7.10)#10,233 |
| 95. | Filley | 7.7% | 10.9%(-3.20)#95 | 14.8%(-7.10)#10,248 |
| 96. | Fairmont | 7.6% | 10.9%(-3.30)#96 | 14.8%(-7.20)#10,325 |
| 97. | Scottsbluff | 7.5% | 10.9%(-3.40)#97 | 14.8%(-7.30)#10,360 |
| 98. | Pickrell | 7.5% | 10.9%(-3.40)#98 | 14.8%(-7.30)#10,448 |
| 99. | Elsie | 7.5% | 10.9%(-3.40)#99 | 14.8%(-7.30)#10,454 |
| 100. | St Paul | 7.4% | 10.9%(-3.50)#100 | 14.8%(-7.40)#10,502 |
Common Questions
What are the Top 10 Cities with the Highest Percentage of Families with Income Above $200,000 in Nebraska?
Top 10 Cities with the Highest Percentage of Families with Income Above $200,000 in Nebraska are:
#1
100.0%
#2
100.0%
#3
50.0%
#4
47.2%
#5
41.7%
#6
30.6%
#7
25.9%
#8
25.0%
#9
25.0%
#10
25.0%
What city has the Highest Percentage of Families with Income Above $200,000 in Nebraska?
Keystone has the Highest Percentage of Families with Income Above $200,000 in Nebraska with 100.0%.
What is the Percentage of Families with Income Above $200,000 in the State of Nebraska?
Percentage of Families with Income Above $200,000 in Nebraska is 10.9%.
What is the Percentage of Families with Income Above $200,000 in the United States?
Percentage of Families with Income Above $200,000 in the United States is 14.8%.