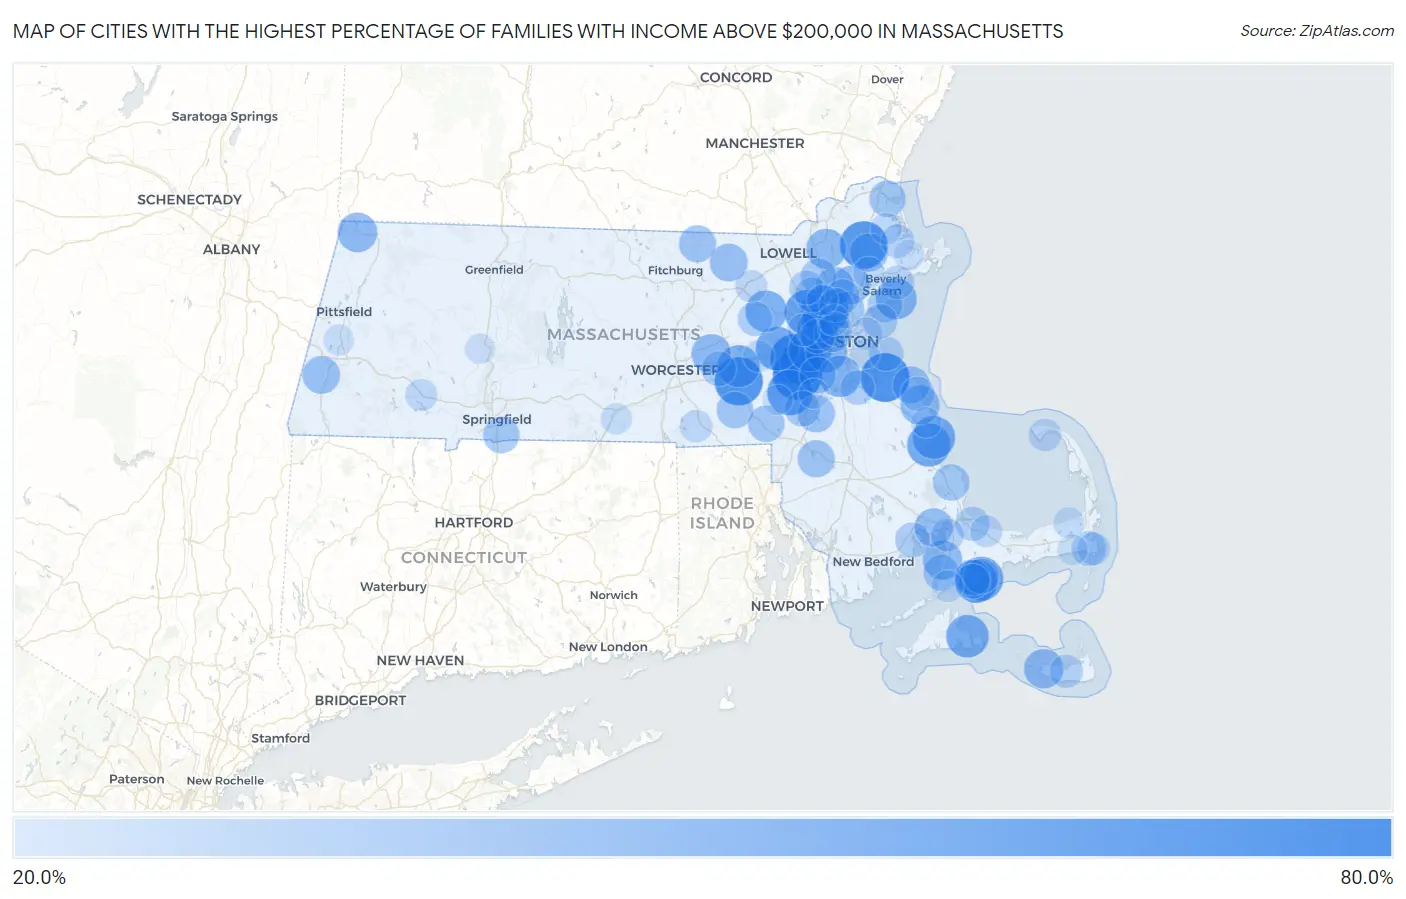
Cities with the Highest Percentage of Families with Income Above $200,000 in Massachusetts
RELATED REPORTS & OPTIONS
Family Income | $200k+
Massachusetts
Compare Cities
Map of Cities with the Highest Percentage of Families with Income Above $200,000 in Massachusetts
0.0%
80.0%
Cities with the Highest Percentage of Families with Income Above $200,000 in Massachusetts
| City | Families with Income > $200k | vs State | vs National | |
| 1. | Wellesley | 70.9% | 25.6%(+45.3)#1 | 14.8%(+56.1)#168 |
| 2. | Dover | 70.9% | 25.6%(+45.3)#2 | 14.8%(+56.1)#169 |
| 3. | Hingham | 69.2% | 25.6%(+43.6)#3 | 14.8%(+54.4)#191 |
| 4. | Hopkinton | 67.8% | 25.6%(+42.2)#4 | 14.8%(+53.0)#216 |
| 5. | Boxford | 66.4% | 25.6%(+40.8)#5 | 14.8%(+51.6)#235 |
| 6. | Winchester | 64.6% | 25.6%(+39.0)#6 | 14.8%(+49.8)#274 |
| 7. | Lexington | 61.4% | 25.6%(+35.8)#7 | 14.8%(+46.6)#359 |
| 8. | Needham | 61.3% | 25.6%(+35.7)#8 | 14.8%(+46.5)#367 |
| 9. | Medfield | 61.3% | 25.6%(+35.7)#9 | 14.8%(+46.5)#369 |
| 10. | Popponesset | 57.7% | 25.6%(+32.1)#10 | 14.8%(+42.9)#481 |
| 11. | Cochituate | 56.6% | 25.6%(+31.0)#11 | 14.8%(+41.8)#524 |
| 12. | Green Harbor | 56.2% | 25.6%(+30.6)#12 | 14.8%(+41.4)#543 |
| 13. | New Seabury | 56.2% | 25.6%(+30.6)#13 | 14.8%(+41.4)#544 |
| 14. | South Duxbury | 55.8% | 25.6%(+30.2)#14 | 14.8%(+41.0)#552 |
| 15. | Newton | 55.5% | 25.6%(+29.9)#15 | 14.8%(+40.7)#561 |
| 16. | Duxbury | 54.8% | 25.6%(+29.2)#16 | 14.8%(+40.0)#587 |
| 17. | Edgartown | 54.4% | 25.6%(+28.8)#17 | 14.8%(+39.6)#604 |
| 18. | Cordaville | 52.8% | 25.6%(+27.2)#18 | 14.8%(+38.0)#674 |
| 19. | Brookline | 51.8% | 25.6%(+26.2)#19 | 14.8%(+37.0)#711 |
| 20. | West Concord | 51.7% | 25.6%(+26.1)#20 | 14.8%(+36.9)#718 |
| 21. | Milton | 51.3% | 25.6%(+25.7)#21 | 14.8%(+36.5)#738 |
| 22. | Belmont | 50.9% | 25.6%(+25.3)#22 | 14.8%(+36.1)#752 |
| 23. | Marblehead | 50.0% | 25.6%(+24.4)#23 | 14.8%(+35.2)#779 |
| 24. | Andover | 47.8% | 25.6%(+22.2)#24 | 14.8%(+33.0)#889 |
| 25. | Williamstown | 46.8% | 25.6%(+21.2)#25 | 14.8%(+32.0)#945 |
| 26. | Northborough | 46.6% | 25.6%(+21.0)#26 | 14.8%(+31.8)#959 |
| 27. | Madaket | 46.5% | 25.6%(+20.9)#27 | 14.8%(+31.7)#972 |
| 28. | Marshfield Hills | 46.4% | 25.6%(+20.8)#28 | 14.8%(+31.6)#977 |
| 29. | North Falmouth | 46.3% | 25.6%(+20.7)#29 | 14.8%(+31.5)#980 |
| 30. | Lynnfield | 44.0% | 25.6%(+18.4)#30 | 14.8%(+29.2)#1,102 |
| 31. | Onset | 43.9% | 25.6%(+18.3)#31 | 14.8%(+29.1)#1,109 |
| 32. | Reading | 43.6% | 25.6%(+18.0)#32 | 14.8%(+28.8)#1,128 |
| 33. | Arlington | 43.5% | 25.6%(+17.9)#33 | 14.8%(+28.7)#1,136 |
| 34. | Topsfield | 43.2% | 25.6%(+17.6)#34 | 14.8%(+28.4)#1,163 |
| 35. | Groton | 42.9% | 25.6%(+17.3)#35 | 14.8%(+28.1)#1,179 |
| 36. | Housatonic | 42.1% | 25.6%(+16.5)#36 | 14.8%(+27.3)#1,250 |
| 37. | Sharon | 41.4% | 25.6%(+15.8)#37 | 14.8%(+26.6)#1,296 |
| 38. | North Scituate | 41.4% | 25.6%(+15.8)#38 | 14.8%(+26.6)#1,297 |
| 39. | Norton Center | 41.1% | 25.6%(+15.5)#39 | 14.8%(+26.3)#1,318 |
| 40. | Townsend | 40.5% | 25.6%(+14.9)#40 | 14.8%(+25.7)#1,371 |
| 41. | Cambridge | 40.2% | 25.6%(+14.6)#41 | 14.8%(+25.4)#1,387 |
| 42. | Hopedale | 40.0% | 25.6%(+14.4)#42 | 14.8%(+25.2)#1,405 |
| 43. | Franklin Town | 39.6% | 25.6%(+14.0)#43 | 14.8%(+24.8)#1,444 |
| 44. | Melrose | 39.3% | 25.6%(+13.7)#44 | 14.8%(+24.5)#1,476 |
| 45. | Dedham | 39.3% | 25.6%(+13.7)#45 | 14.8%(+24.5)#1,477 |
| 46. | Newburyport | 39.3% | 25.6%(+13.7)#46 | 14.8%(+24.5)#1,479 |
| 47. | The Pinehills | 39.3% | 25.6%(+13.7)#47 | 14.8%(+24.5)#1,483 |
| 48. | Longmeadow | 39.0% | 25.6%(+13.4)#48 | 14.8%(+24.2)#1,498 |
| 49. | West Falmouth | 38.3% | 25.6%(+12.7)#49 | 14.8%(+23.5)#1,560 |
| 50. | Seabrook | 37.8% | 25.6%(+12.2)#50 | 14.8%(+23.0)#1,598 |
| 51. | Wilmington | 37.7% | 25.6%(+12.1)#51 | 14.8%(+22.9)#1,602 |
| 52. | Walpole | 37.2% | 25.6%(+11.6)#52 | 14.8%(+22.4)#1,638 |
| 53. | Popponesset Island | 36.7% | 25.6%(+11.1)#53 | 14.8%(+21.9)#1,692 |
| 54. | Burlington | 35.8% | 25.6%(+10.2)#54 | 14.8%(+21.0)#1,761 |
| 55. | Monomoscoy Island | 35.7% | 25.6%(+10.1)#55 | 14.8%(+20.9)#1,775 |
| 56. | Marion Center | 35.6% | 25.6%(+10.0)#56 | 14.8%(+20.8)#1,784 |
| 57. | Swampscott | 35.5% | 25.6%(+9.90)#57 | 14.8%(+20.7)#1,788 |
| 58. | Westborough | 35.5% | 25.6%(+9.90)#58 | 14.8%(+20.7)#1,791 |
| 59. | Hull | 34.9% | 25.6%(+9.30)#59 | 14.8%(+20.1)#1,852 |
| 60. | Watertown Town | 34.8% | 25.6%(+9.20)#60 | 14.8%(+20.0)#1,858 |
| 61. | Nahant | 34.8% | 25.6%(+9.20)#61 | 14.8%(+20.0)#1,859 |
| 62. | West Chatham | 34.8% | 25.6%(+9.20)#62 | 14.8%(+20.0)#1,860 |
| 63. | Maynard | 34.6% | 25.6%(+9.00)#63 | 14.8%(+19.8)#1,876 |
| 64. | Wakefield | 34.3% | 25.6%(+8.70)#64 | 14.8%(+19.5)#1,909 |
| 65. | Scituate | 34.3% | 25.6%(+8.70)#65 | 14.8%(+19.5)#1,910 |
| 66. | Sandwich | 34.3% | 25.6%(+8.70)#66 | 14.8%(+19.5)#1,911 |
| 67. | Braintree Town | 34.2% | 25.6%(+8.60)#67 | 14.8%(+19.4)#1,919 |
| 68. | Stoneham | 33.7% | 25.6%(+8.10)#68 | 14.8%(+18.9)#1,968 |
| 69. | Pinehurst | 33.4% | 25.6%(+7.80)#69 | 14.8%(+18.6)#1,993 |
| 70. | Somerville | 33.3% | 25.6%(+7.70)#70 | 14.8%(+18.5)#1,995 |
| 71. | Beverly | 32.5% | 25.6%(+6.90)#71 | 14.8%(+17.7)#2,088 |
| 72. | Nantucket | 32.3% | 25.6%(+6.70)#72 | 14.8%(+17.5)#2,119 |
| 73. | Cedar Crest | 32.3% | 25.6%(+6.70)#73 | 14.8%(+17.5)#2,123 |
| 74. | Ipswich | 32.1% | 25.6%(+6.50)#74 | 14.8%(+17.3)#2,139 |
| 75. | Monument Beach | 31.5% | 25.6%(+5.90)#75 | 14.8%(+16.7)#2,204 |
| 76. | Chatham | 30.8% | 25.6%(+5.20)#76 | 14.8%(+16.0)#2,274 |
| 77. | Waltham | 30.6% | 25.6%(+5.00)#77 | 14.8%(+15.8)#2,291 |
| 78. | Provincetown | 30.5% | 25.6%(+4.90)#78 | 14.8%(+15.7)#2,309 |
| 79. | East Douglas | 30.2% | 25.6%(+4.60)#79 | 14.8%(+15.4)#2,347 |
| 80. | Winthrop Town | 30.1% | 25.6%(+4.50)#80 | 14.8%(+15.3)#2,356 |
| 81. | Littleton Common | 29.1% | 25.6%(+3.50)#81 | 14.8%(+14.3)#2,490 |
| 82. | Blandford | 29.1% | 25.6%(+3.50)#82 | 14.8%(+14.3)#2,492 |
| 83. | East Sandwich | 29.0% | 25.6%(+3.40)#83 | 14.8%(+14.2)#2,501 |
| 84. | Amherst | 28.5% | 25.6%(+2.90)#84 | 14.8%(+13.7)#2,579 |
| 85. | Rowley | 28.1% | 25.6%(+2.50)#85 | 14.8%(+13.3)#2,640 |
| 86. | Framingham | 28.0% | 25.6%(+2.40)#86 | 14.8%(+13.2)#2,649 |
| 87. | Medford | 28.0% | 25.6%(+2.40)#87 | 14.8%(+13.2)#2,650 |
| 88. | Falmouth | 28.0% | 25.6%(+2.40)#88 | 14.8%(+13.2)#2,657 |
| 89. | Danvers | 27.7% | 25.6%(+2.10)#89 | 14.8%(+12.9)#2,705 |
| 90. | Sturbridge | 27.3% | 25.6%(+1.70)#90 | 14.8%(+12.5)#2,769 |
| 91. | Woburn | 26.8% | 25.6%(+1.20)#91 | 14.8%(+12.0)#2,836 |
| 92. | Brewster | 26.5% | 25.6%(+0.900)#92 | 14.8%(+11.7)#2,879 |
| 93. | Lenox | 26.2% | 25.6%(+0.600)#93 | 14.8%(+11.4)#2,917 |
| 94. | Essex | 26.2% | 25.6%(+0.600)#94 | 14.8%(+11.4)#2,919 |
| 95. | Marshfield | 25.7% | 25.6%(+0.100)#95 | 14.8%(+10.9)#3,001 |
| 96. | Millis Clicquot | 25.4% | 25.6%(-0.200)#96 | 14.8%(+10.6)#3,044 |
| 97. | Harwich Port | 25.3% | 25.6%(-0.300)#97 | 14.8%(+10.5)#3,059 |
| 98. | Northampton | 25.2% | 25.6%(-0.400)#98 | 14.8%(+10.4)#3,068 |
| 99. | Norwood | 25.1% | 25.6%(-0.500)#99 | 14.8%(+10.3)#3,088 |
| 100. | Boston | 24.5% | 25.6%(-1.10)#100 | 14.8%(+9.70)#3,194 |
Common Questions
What are the Top 10 Cities with the Highest Percentage of Families with Income Above $200,000 in Massachusetts?
Top 10 Cities with the Highest Percentage of Families with Income Above $200,000 in Massachusetts are:
#1
70.9%
#2
70.9%
#3
69.2%
#4
67.8%
#5
66.4%
#6
64.6%
#7
61.4%
#8
61.3%
#9
61.3%
#10
57.7%
What city has the Highest Percentage of Families with Income Above $200,000 in Massachusetts?
Wellesley has the Highest Percentage of Families with Income Above $200,000 in Massachusetts with 70.9%.
What is the Percentage of Families with Income Above $200,000 in the State of Massachusetts?
Percentage of Families with Income Above $200,000 in Massachusetts is 25.6%.
What is the Percentage of Families with Income Above $200,000 in the United States?
Percentage of Families with Income Above $200,000 in the United States is 14.8%.