Woodside, CA Map & Demographics
Woodside Map
Woodside Overview
$146,296
PER CAPITA INCOME
$250,001
AVG FAMILY INCOME
$250,001
AVG HOUSEHOLD INCOME
51.2%
WAGE / INCOME GAP [ % ]
48.8¢/ $1
WAGE / INCOME GAP [ $ ]
0.49
INEQUALITY / GINI INDEX
5,256
TOTAL POPULATION
2,403
MALE POPULATION
2,853
FEMALE POPULATION
84.23
MALES / 100 FEMALES
118.73
FEMALES / 100 MALES
46.4
MEDIAN AGE
3.3
AVG FAMILY SIZE
3.1
AVG HOUSEHOLD SIZE
2,518
LABOR FORCE [ PEOPLE ]
60.1%
PERCENT IN LABOR FORCE
4.5%
UNEMPLOYMENT RATE
Woodside Area Codes
Income in Woodside
Income Overview in Woodside
Per Capita Income in Woodside is $146,296, while median incomes of families and households are $250,001 and $250,001 respectively.
| Characteristic | Number | Measure |
| Per Capita Income | 5,256 | $146,296 |
| Median Family Income | 1,417 | $250,001 |
| Mean Family Income | 1,417 | $463,570 |
| Median Household Income | 1,696 | $250,001 |
| Mean Household Income | 1,696 | $445,543 |
| Income Deficit | 1,417 | $0 |
| Wage / Income Gap (%) | 5,256 | 51.18% |
| Wage / Income Gap ($) | 5,256 | 48.82¢ per $1 |
| Gini / Inequality Index | 5,256 | 0.49 |
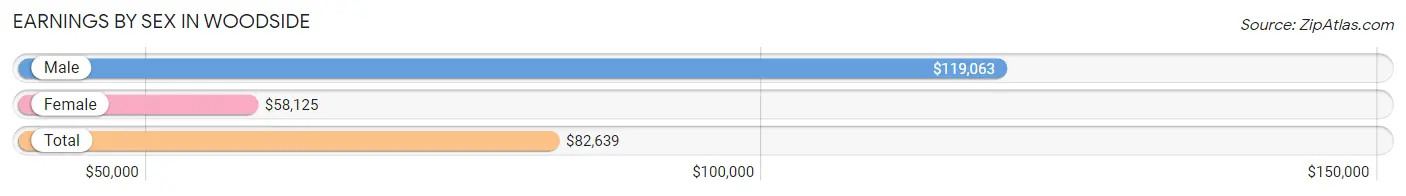
Earnings by Sex in Woodside
Average Earnings in Woodside are $82,639, $119,063 for men and $58,125 for women, a difference of 51.2%.
| Sex | Number | Average Earnings |
| Male | 1,366 (50.2%) | $119,063 |
| Female | 1,356 (49.8%) | $58,125 |
| Total | 2,722 (100.0%) | $82,639 |
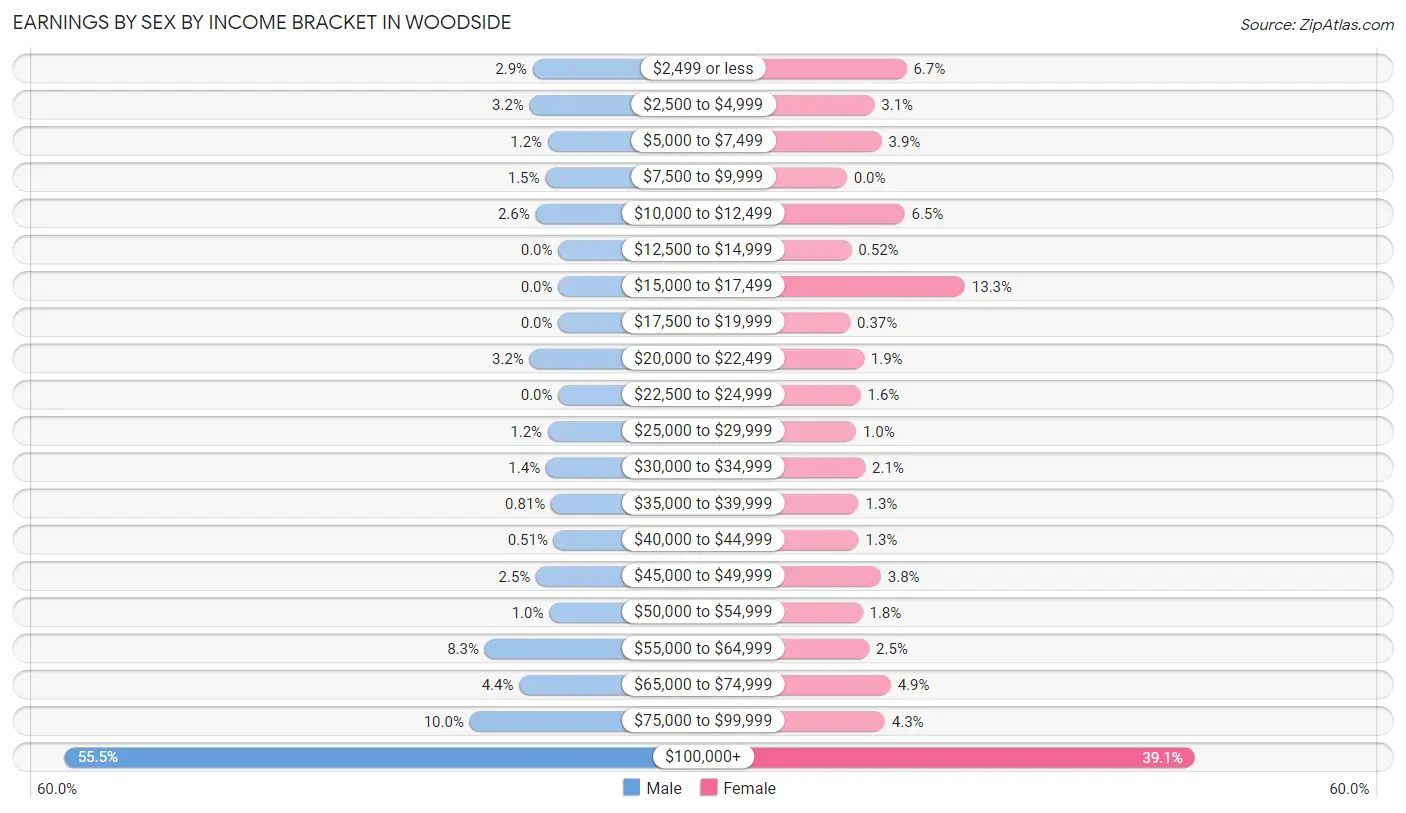
Earnings by Sex by Income Bracket in Woodside
The most common earnings brackets in Woodside are $100,000+ for men (758 | 55.5%) and $100,000+ for women (530 | 39.1%).
| Income | Male | Female |
| $2,499 or less | 39 (2.9%) | 91 (6.7%) |
| $2,500 to $4,999 | 44 (3.2%) | 42 (3.1%) |
| $5,000 to $7,499 | 16 (1.2%) | 53 (3.9%) |
| $7,500 to $9,999 | 20 (1.5%) | 0 (0.0%) |
| $10,000 to $12,499 | 35 (2.6%) | 88 (6.5%) |
| $12,500 to $14,999 | 0 (0.0%) | 7 (0.5%) |
| $15,000 to $17,499 | 0 (0.0%) | 180 (13.3%) |
| $17,500 to $19,999 | 0 (0.0%) | 5 (0.4%) |
| $20,000 to $22,499 | 44 (3.2%) | 26 (1.9%) |
| $22,500 to $24,999 | 0 (0.0%) | 21 (1.5%) |
| $25,000 to $29,999 | 16 (1.2%) | 14 (1.0%) |
| $30,000 to $34,999 | 19 (1.4%) | 28 (2.1%) |
| $35,000 to $39,999 | 11 (0.8%) | 18 (1.3%) |
| $40,000 to $44,999 | 7 (0.5%) | 18 (1.3%) |
| $45,000 to $49,999 | 34 (2.5%) | 52 (3.8%) |
| $50,000 to $54,999 | 14 (1.0%) | 24 (1.8%) |
| $55,000 to $64,999 | 113 (8.3%) | 34 (2.5%) |
| $65,000 to $74,999 | 60 (4.4%) | 67 (4.9%) |
| $75,000 to $99,999 | 136 (10.0%) | 58 (4.3%) |
| $100,000+ | 758 (55.5%) | 530 (39.1%) |
| Total | 1,366 (100.0%) | 1,356 (100.0%) |
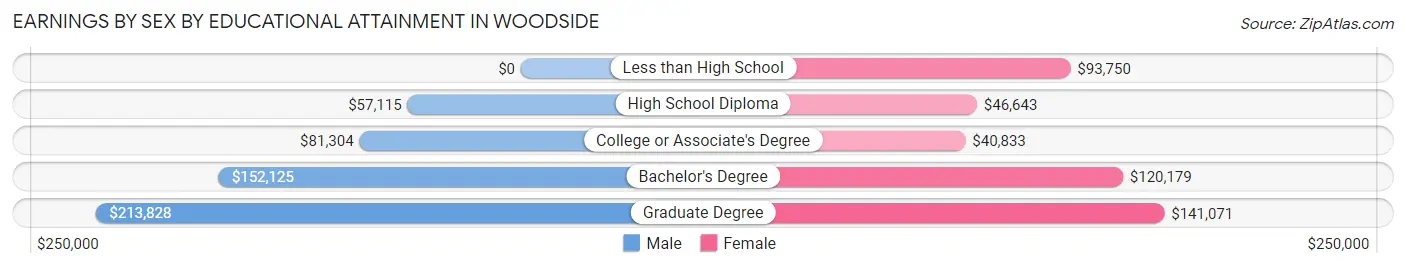
Earnings by Sex by Educational Attainment in Woodside
Average earnings in Woodside are $150,000 for men and $102,917 for women, a difference of 31.4%. Men with an educational attainment of graduate degree enjoy the highest average annual earnings of $213,828, while those with high school diploma education earn the least with $57,115. Women with an educational attainment of graduate degree earn the most with the average annual earnings of $141,071, while those with college or associate's degree education have the smallest earnings of $40,833.
| Educational Attainment | Male Income | Female Income |
| Less than High School | - | - |
| High School Diploma | $57,115 | $46,643 |
| College or Associate's Degree | $81,304 | $40,833 |
| Bachelor's Degree | $152,125 | $120,179 |
| Graduate Degree | $213,828 | $141,071 |
| Total | $150,000 | $102,917 |
Family Income in Woodside
Family Income Brackets in Woodside
According to the Woodside family income data, there are 1,027 families falling into the $200,000+ income range, which is the most common income bracket and makes up 72.5% of all families.
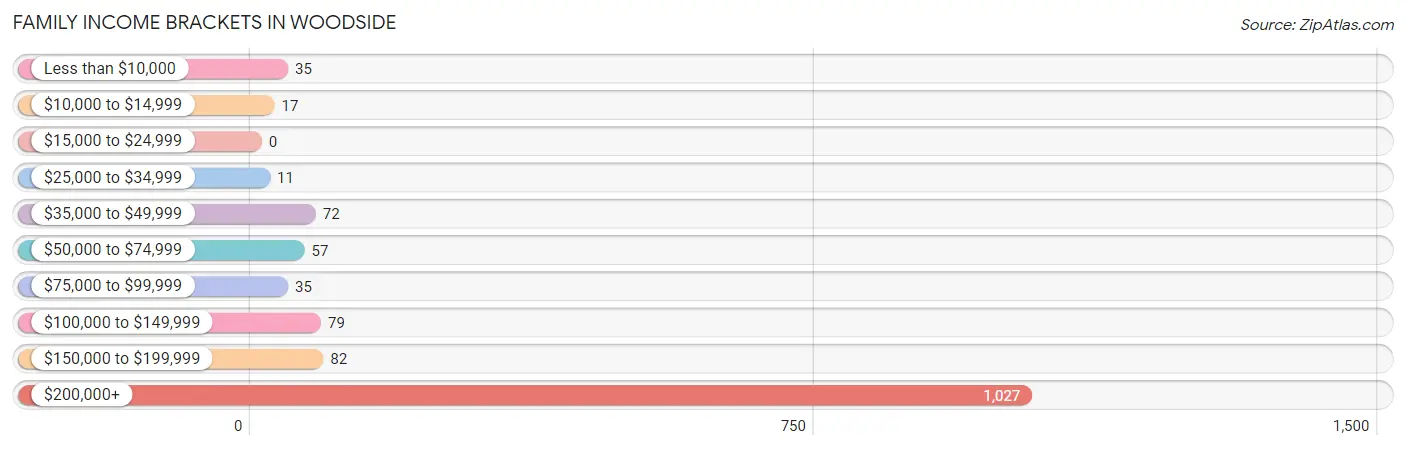
| Income Bracket | # Families | % Families |
| Less than $10,000 | 35 | 2.5% |
| $10,000 to $14,999 | 17 | 1.2% |
| $15,000 to $24,999 | 0 | 0.0% |
| $25,000 to $34,999 | 11 | 0.8% |
| $35,000 to $49,999 | 72 | 5.1% |
| $50,000 to $74,999 | 57 | 4.0% |
| $75,000 to $99,999 | 35 | 2.5% |
| $100,000 to $149,999 | 79 | 5.6% |
| $150,000 to $199,999 | 82 | 5.8% |
| $200,000+ | 1,027 | 72.5% |
Family Income by Famaliy Size in Woodside
3-person families (316 | 22.3%) account for the highest median family income in Woodside with $250,001 per family, while 2-person families (618 | 43.6%) have the highest median income of $123,269 per family member.
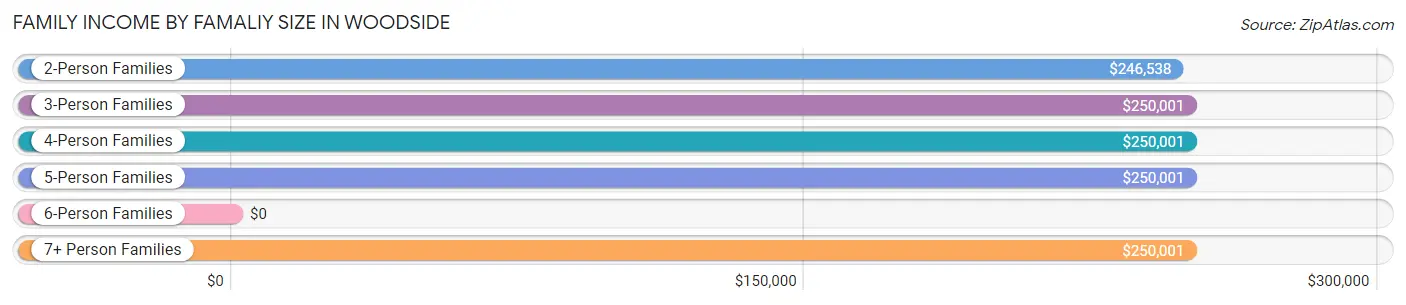
| Income Bracket | # Families | Median Income |
| 2-Person Families | 618 (43.6%) | $246,538 |
| 3-Person Families | 316 (22.3%) | $250,001 |
| 4-Person Families | 334 (23.6%) | $250,001 |
| 5-Person Families | 126 (8.9%) | $250,001 |
| 6-Person Families | 10 (0.7%) | $0 |
| 7+ Person Families | 13 (0.9%) | $250,001 |
| Total | 1,417 (100.0%) | $250,001 |
Family Income by Number of Earners in Woodside
The median family income in Woodside is $250,001, with families comprising 2 earners (620) having the highest median family income of $250,001, while families with no earners (231) have the lowest median family income of $181,172, accounting for 43.8% and 16.3% of families, respectively.
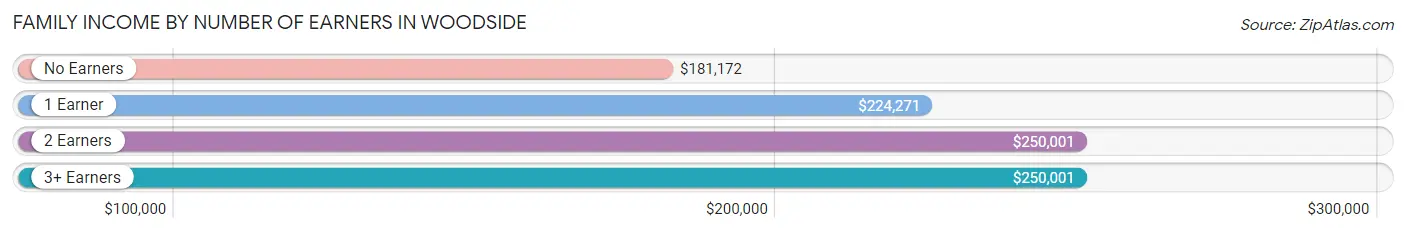
| Number of Earners | # Families | Median Income |
| No Earners | 231 (16.3%) | $181,172 |
| 1 Earner | 437 (30.8%) | $224,271 |
| 2 Earners | 620 (43.8%) | $250,001 |
| 3+ Earners | 129 (9.1%) | $250,001 |
| Total | 1,417 (100.0%) | $250,001 |
Household Income in Woodside
Household Income Brackets in Woodside
With 1,170 households falling in the category, the $200,000+ income range is the most frequent in Woodside, accounting for 69.0% of all households. In contrast, only 3 households (0.2%) fall into the $25,000 to $34,999 income bracket, making it the least populous group.
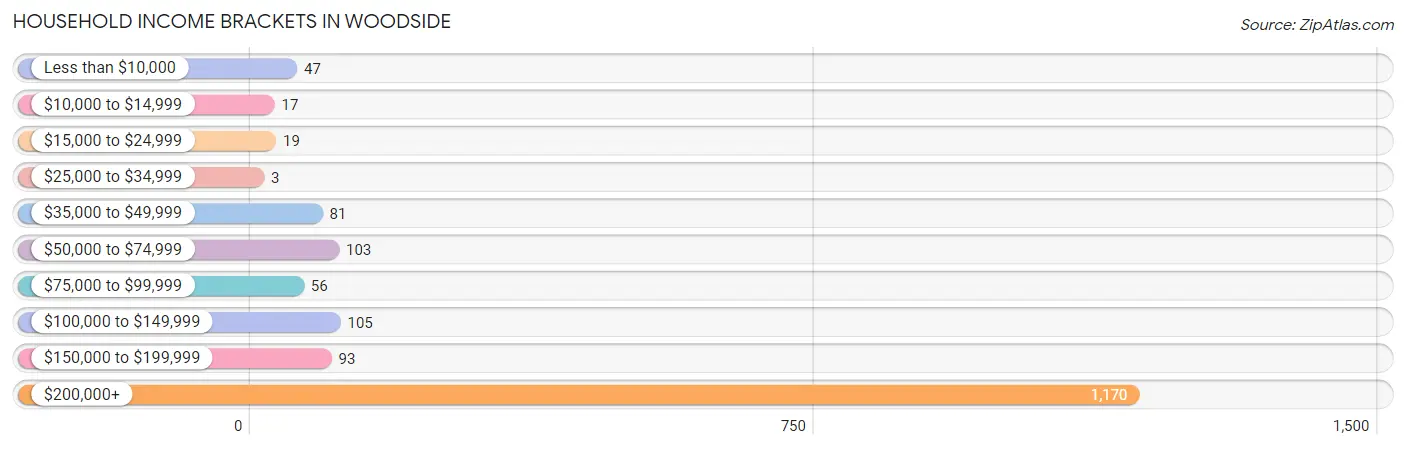
| Income Bracket | # Households | % Households |
| Less than $10,000 | 47 | 2.8% |
| $10,000 to $14,999 | 17 | 1.0% |
| $15,000 to $24,999 | 19 | 1.1% |
| $25,000 to $34,999 | 3 | 0.2% |
| $35,000 to $49,999 | 81 | 4.8% |
| $50,000 to $74,999 | 103 | 6.1% |
| $75,000 to $99,999 | 56 | 3.3% |
| $100,000 to $149,999 | 105 | 6.2% |
| $150,000 to $199,999 | 93 | 5.5% |
| $200,000+ | 1,170 | 69.0% |
Household Income by Householder Age in Woodside
The median household income in Woodside is $250,001, with the highest median household income of $250,001 found in the 25 to 44 years age bracket for the primary householder. A total of 265 households (15.6%) fall into this category. Meanwhile, the 15 to 24 years age bracket for the primary householder has the lowest median household income of $0, with 6 households (0.4%) in this group.
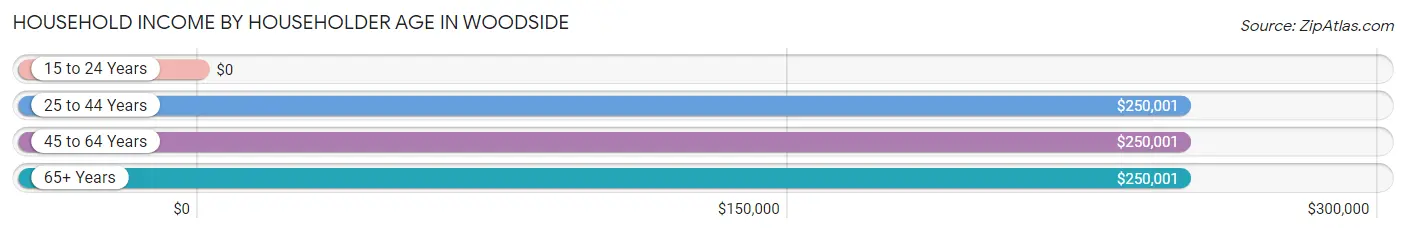
| Income Bracket | # Households | Median Income |
| 15 to 24 Years | 6 (0.4%) | $0 |
| 25 to 44 Years | 265 (15.6%) | $250,001 |
| 45 to 64 Years | 801 (47.2%) | $250,001 |
| 65+ Years | 624 (36.8%) | $250,001 |
| Total | 1,696 (100.0%) | $250,001 |
Poverty in Woodside
Income Below Poverty by Sex and Age in Woodside
With 3.8% poverty level for males and 6.8% for females among the residents of Woodside, 12 to 14 year old males and 12 to 14 year old females are the most vulnerable to poverty, with 11 males (13.3%) and 40 females (21.0%) in their respective age groups living below the poverty level.
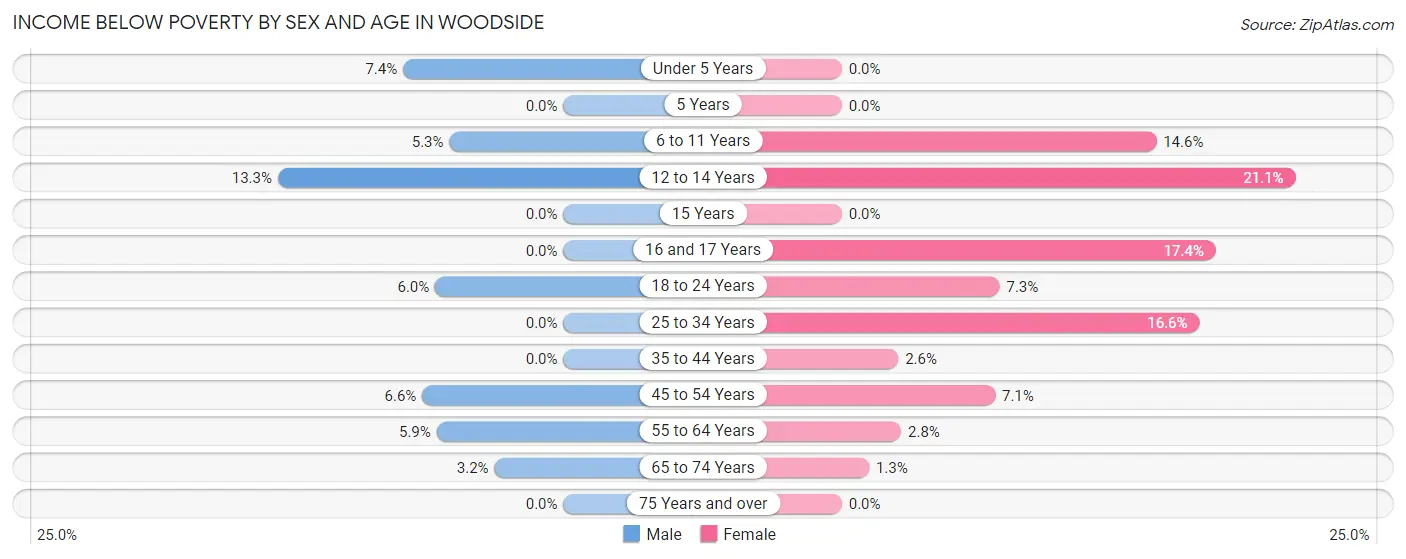
| Age Bracket | Male | Female |
| Under 5 Years | 9 (7.4%) | 0 (0.0%) |
| 5 Years | 0 (0.0%) | 0 (0.0%) |
| 6 to 11 Years | 11 (5.3%) | 27 (14.6%) |
| 12 to 14 Years | 11 (13.3%) | 40 (21.0%) |
| 15 Years | 0 (0.0%) | 0 (0.0%) |
| 16 and 17 Years | 0 (0.0%) | 17 (17.3%) |
| 18 to 24 Years | 5 (5.9%) | 24 (7.3%) |
| 25 to 34 Years | 0 (0.0%) | 35 (16.6%) |
| 35 to 44 Years | 0 (0.0%) | 6 (2.6%) |
| 45 to 54 Years | 19 (6.6%) | 30 (7.1%) |
| 55 to 64 Years | 26 (5.9%) | 12 (2.8%) |
| 65 to 74 Years | 11 (3.2%) | 4 (1.3%) |
| 75 Years and over | 0 (0.0%) | 0 (0.0%) |
| Total | 92 (3.8%) | 195 (6.8%) |
Income Above Poverty by Sex and Age in Woodside
According to the poverty statistics in Woodside, males aged 5 years and females aged under 5 years are the age groups that are most secure financially, with 100.0% of males and 100.0% of females in these age groups living above the poverty line.
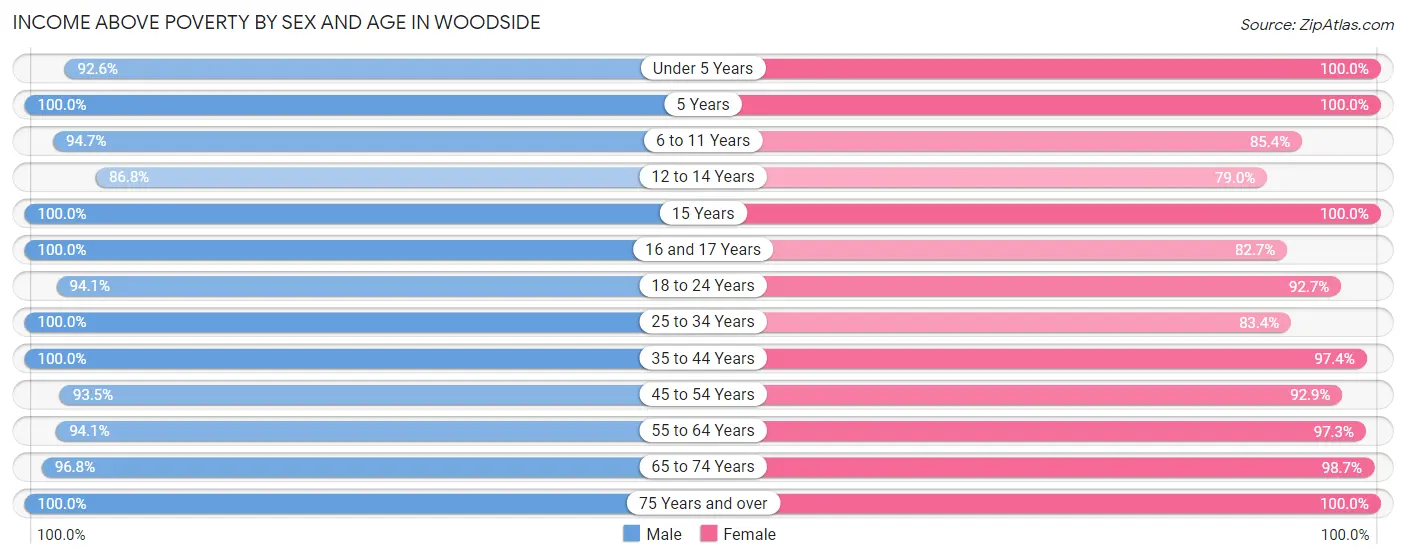
| Age Bracket | Male | Female |
| Under 5 Years | 112 (92.6%) | 93 (100.0%) |
| 5 Years | 20 (100.0%) | 13 (100.0%) |
| 6 to 11 Years | 197 (94.7%) | 158 (85.4%) |
| 12 to 14 Years | 72 (86.8%) | 150 (78.9%) |
| 15 Years | 51 (100.0%) | 91 (100.0%) |
| 16 and 17 Years | 85 (100.0%) | 81 (82.7%) |
| 18 to 24 Years | 79 (94.1%) | 304 (92.7%) |
| 25 to 34 Years | 222 (100.0%) | 176 (83.4%) |
| 35 to 44 Years | 241 (100.0%) | 223 (97.4%) |
| 45 to 54 Years | 271 (93.4%) | 392 (92.9%) |
| 55 to 64 Years | 416 (94.1%) | 425 (97.3%) |
| 65 to 74 Years | 333 (96.8%) | 313 (98.7%) |
| 75 Years and over | 205 (100.0%) | 235 (100.0%) |
| Total | 2,304 (96.2%) | 2,654 (93.2%) |
Income Below Poverty Among Married-Couple Families in Woodside
The poverty statistics for married-couple families in Woodside show that 2.3% or 29 of the total 1,265 families live below the poverty line. Families with 3 or 4 children have the highest poverty rate of 13.8%, comprising of 13 families. On the other hand, families with 5 or more children have the lowest poverty rate of 0.0%, which includes 0 families.
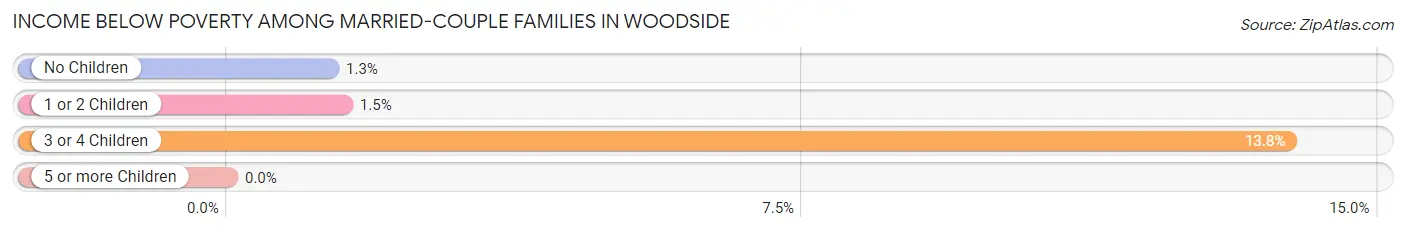
| Children | Above Poverty | Below Poverty |
| No Children | 749 (98.7%) | 10 (1.3%) |
| 1 or 2 Children | 395 (98.5%) | 6 (1.5%) |
| 3 or 4 Children | 81 (86.2%) | 13 (13.8%) |
| 5 or more Children | 11 (100.0%) | 0 (0.0%) |
| Total | 1,236 (97.7%) | 29 (2.3%) |
Income Below Poverty Among Single-Parent Households in Woodside
According to the poverty data in Woodside, 9.1% or 5 single-father households and 18.6% or 18 single-mother households are living below the poverty line. Among single-father households, those with 3 or 4 children have the highest poverty rate, with 5 households (100.0%) experiencing poverty. Likewise, among single-mother households, those with 1 or 2 children have the highest poverty rate, with 18 households (28.1%) falling below the poverty line.
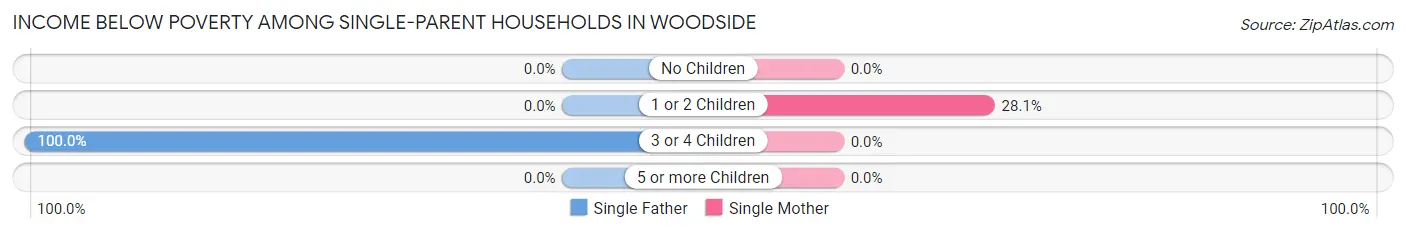
| Children | Single Father | Single Mother |
| No Children | 0 (0.0%) | 0 (0.0%) |
| 1 or 2 Children | 0 (0.0%) | 18 (28.1%) |
| 3 or 4 Children | 5 (100.0%) | 0 (0.0%) |
| 5 or more Children | 0 (0.0%) | 0 (0.0%) |
| Total | 5 (9.1%) | 18 (18.6%) |
Income Below Poverty Among Married-Couple vs Single-Parent Households in Woodside
The poverty data for Woodside shows that 29 of the married-couple family households (2.3%) and 23 of the single-parent households (15.1%) are living below the poverty level. Within the married-couple family households, those with 3 or 4 children have the highest poverty rate, with 13 households (13.8%) falling below the poverty line. Among the single-parent households, those with 3 or 4 children have the highest poverty rate, with 5 household (100.0%) living below poverty.
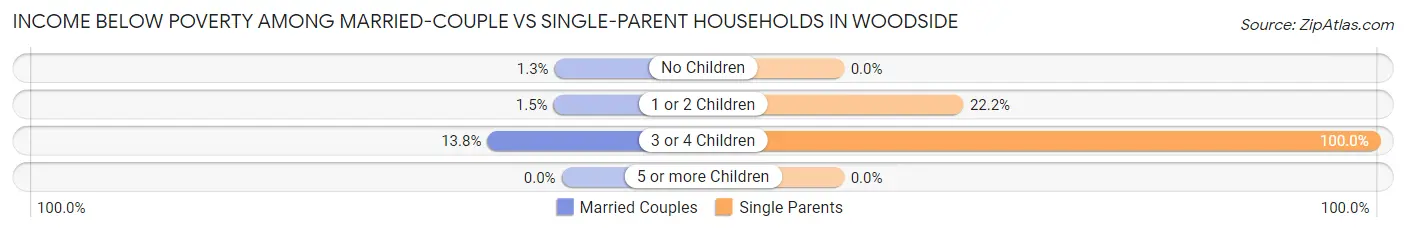
| Children | Married-Couple Families | Single-Parent Households |
| No Children | 10 (1.3%) | 0 (0.0%) |
| 1 or 2 Children | 6 (1.5%) | 18 (22.2%) |
| 3 or 4 Children | 13 (13.8%) | 5 (100.0%) |
| 5 or more Children | 0 (0.0%) | 0 (0.0%) |
| Total | 29 (2.3%) | 23 (15.1%) |
Race in Woodside
The most populous races in Woodside are White / Caucasian (4,410 | 83.9%), Two or more Races (374 | 7.1%), and Asian (350 | 6.7%).
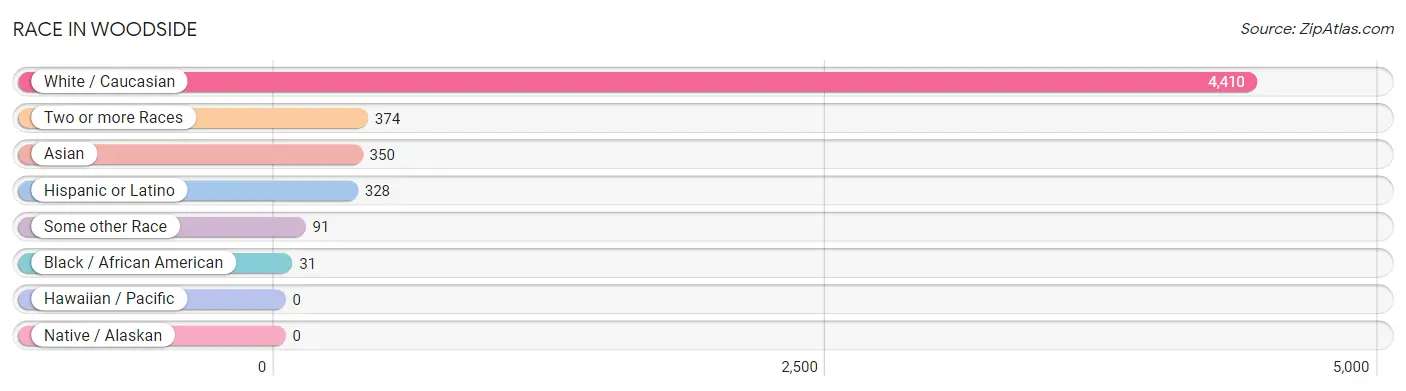
| Race | # Population | % Population |
| Asian | 350 | 6.7% |
| Black / African American | 31 | 0.6% |
| Hawaiian / Pacific | 0 | 0.0% |
| Hispanic or Latino | 328 | 6.2% |
| Native / Alaskan | 0 | 0.0% |
| White / Caucasian | 4,410 | 83.9% |
| Two or more Races | 374 | 7.1% |
| Some other Race | 91 | 1.7% |
| Total | 5,256 | 100.0% |
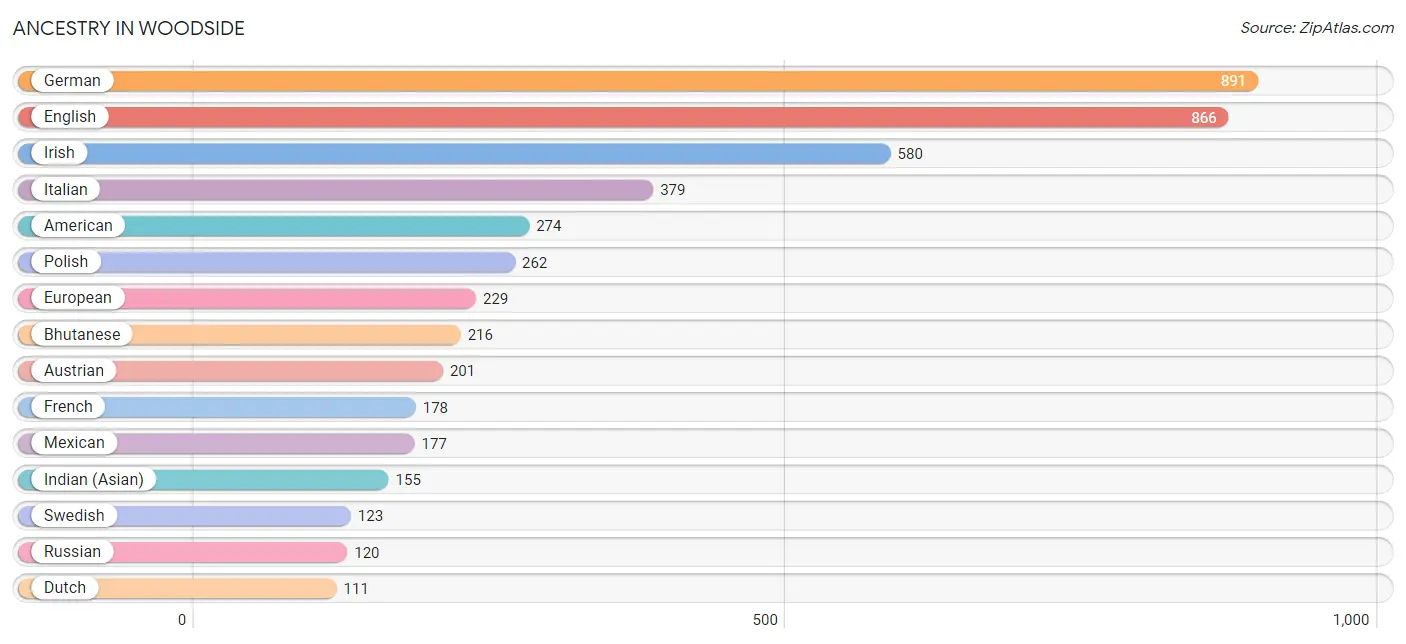
Ancestry in Woodside
The most populous ancestries reported in Woodside are German (891 | 17.0%), English (866 | 16.5%), Irish (580 | 11.0%), Italian (379 | 7.2%), and American (274 | 5.2%), together accounting for 56.9% of all Woodside residents.
| Ancestry | # Population | % Population |
| American | 274 | 5.2% |
| Arab | 6 | 0.1% |
| Argentinean | 3 | 0.1% |
| Australian | 10 | 0.2% |
| Austrian | 201 | 3.8% |
| Belgian | 10 | 0.2% |
| Bhutanese | 216 | 4.1% |
| British | 42 | 0.8% |
| Bulgarian | 3 | 0.1% |
| Burmese | 40 | 0.8% |
| Canadian | 12 | 0.2% |
| Cherokee | 4 | 0.1% |
| Colombian | 10 | 0.2% |
| Croatian | 5 | 0.1% |
| Czech | 13 | 0.3% |
| Danish | 66 | 1.3% |
| Dutch | 111 | 2.1% |
| Eastern European | 62 | 1.2% |
| English | 866 | 16.5% |
| European | 229 | 4.4% |
| Filipino | 48 | 0.9% |
| Finnish | 28 | 0.5% |
| French | 178 | 3.4% |
| French Canadian | 22 | 0.4% |
| German | 891 | 17.0% |
| Greek | 22 | 0.4% |
| Hungarian | 11 | 0.2% |
| Indian (Asian) | 155 | 2.9% |
| Iranian | 100 | 1.9% |
| Irish | 580 | 11.0% |
| Italian | 379 | 7.2% |
| Jordanian | 6 | 0.1% |
| Korean | 21 | 0.4% |
| Lithuanian | 7 | 0.1% |
| Mexican | 177 | 3.4% |
| New Zealander | 6 | 0.1% |
| Northern European | 91 | 1.7% |
| Norwegian | 59 | 1.1% |
| Polish | 262 | 5.0% |
| Portuguese | 28 | 0.5% |
| Pueblo | 23 | 0.4% |
| Puerto Rican | 52 | 1.0% |
| Russian | 120 | 2.3% |
| Scandinavian | 16 | 0.3% |
| Scotch-Irish | 55 | 1.1% |
| Scottish | 102 | 1.9% |
| Serbian | 5 | 0.1% |
| Slovak | 6 | 0.1% |
| South African | 7 | 0.1% |
| South American | 13 | 0.3% |
| Spaniard | 11 | 0.2% |
| Spanish | 55 | 1.1% |
| Subsaharan African | 15 | 0.3% |
| Swedish | 123 | 2.3% |
| Swiss | 33 | 0.6% |
| Thai | 104 | 2.0% |
| Turkish | 2 | 0.0% |
| Ukrainian | 17 | 0.3% |
| Vietnamese | 37 | 0.7% |
| Welsh | 39 | 0.7% |
| Yaqui | 12 | 0.2% | View All 61 Rows |
Immigrants in Woodside
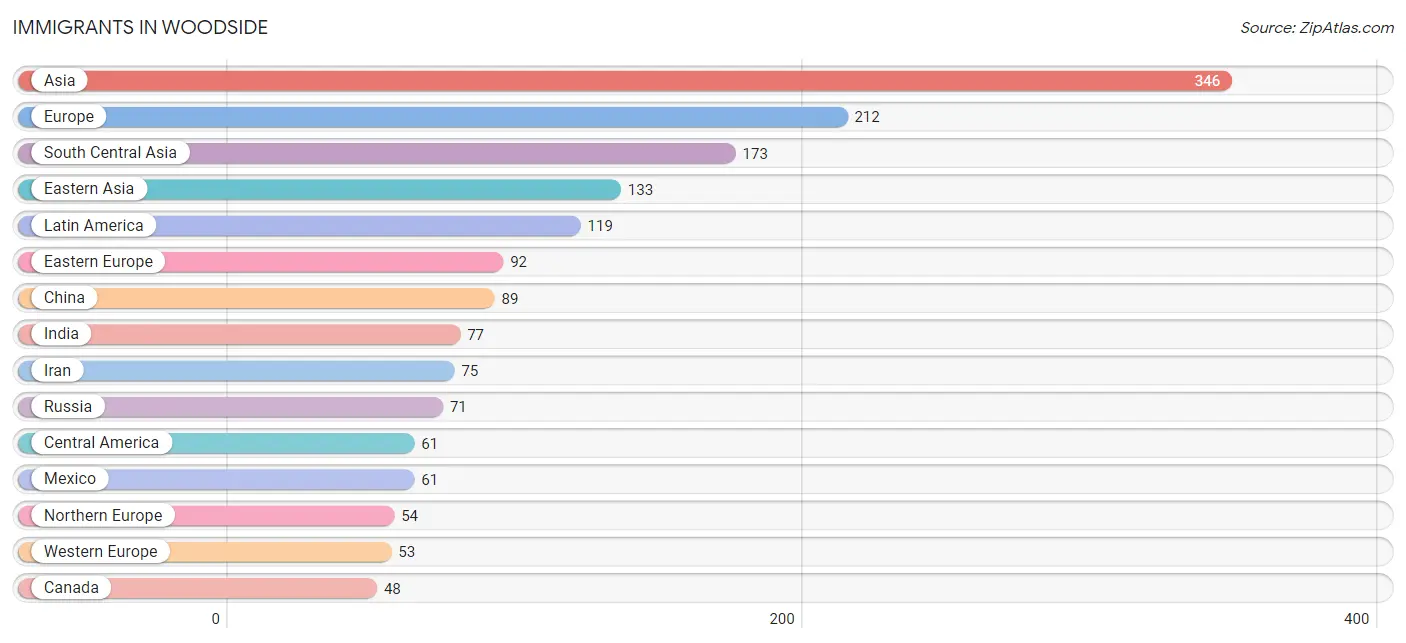
The most numerous immigrant groups reported in Woodside came from Asia (346 | 6.6%), Europe (212 | 4.0%), South Central Asia (173 | 3.3%), Eastern Asia (133 | 2.5%), and Latin America (119 | 2.3%), together accounting for 18.7% of all Woodside residents.
| Immigration Origin | # Population | % Population |
| Africa | 7 | 0.1% |
| Argentina | 5 | 0.1% |
| Asia | 346 | 6.6% |
| Australia | 6 | 0.1% |
| Bangladesh | 21 | 0.4% |
| Belgium | 10 | 0.2% |
| Brazil | 24 | 0.5% |
| Bulgaria | 3 | 0.1% |
| Canada | 48 | 0.9% |
| Caribbean | 19 | 0.4% |
| Central America | 61 | 1.2% |
| China | 89 | 1.7% |
| Colombia | 10 | 0.2% |
| Eastern Asia | 133 | 2.5% |
| Eastern Europe | 92 | 1.8% |
| Europe | 212 | 4.0% |
| France | 11 | 0.2% |
| Germany | 32 | 0.6% |
| India | 77 | 1.5% |
| Iran | 75 | 1.4% |
| Israel | 17 | 0.3% |
| Italy | 4 | 0.1% |
| Jamaica | 8 | 0.2% |
| Japan | 35 | 0.7% |
| Korea | 9 | 0.2% |
| Latin America | 119 | 2.3% |
| Mexico | 61 | 1.2% |
| Northern Europe | 54 | 1.0% |
| Oceania | 30 | 0.6% |
| Philippines | 4 | 0.1% |
| Poland | 18 | 0.3% |
| Russia | 71 | 1.3% |
| Scotland | 8 | 0.2% |
| South Africa | 7 | 0.1% |
| South America | 39 | 0.7% |
| South Central Asia | 173 | 3.3% |
| South Eastern Asia | 23 | 0.4% |
| Southern Europe | 13 | 0.3% |
| Spain | 9 | 0.2% |
| Sweden | 22 | 0.4% |
| Taiwan | 23 | 0.4% |
| Vietnam | 19 | 0.4% |
| Western Asia | 17 | 0.3% |
| Western Europe | 53 | 1.0% | View All 44 Rows |
Sex and Age in Woodside
Sex and Age in Woodside
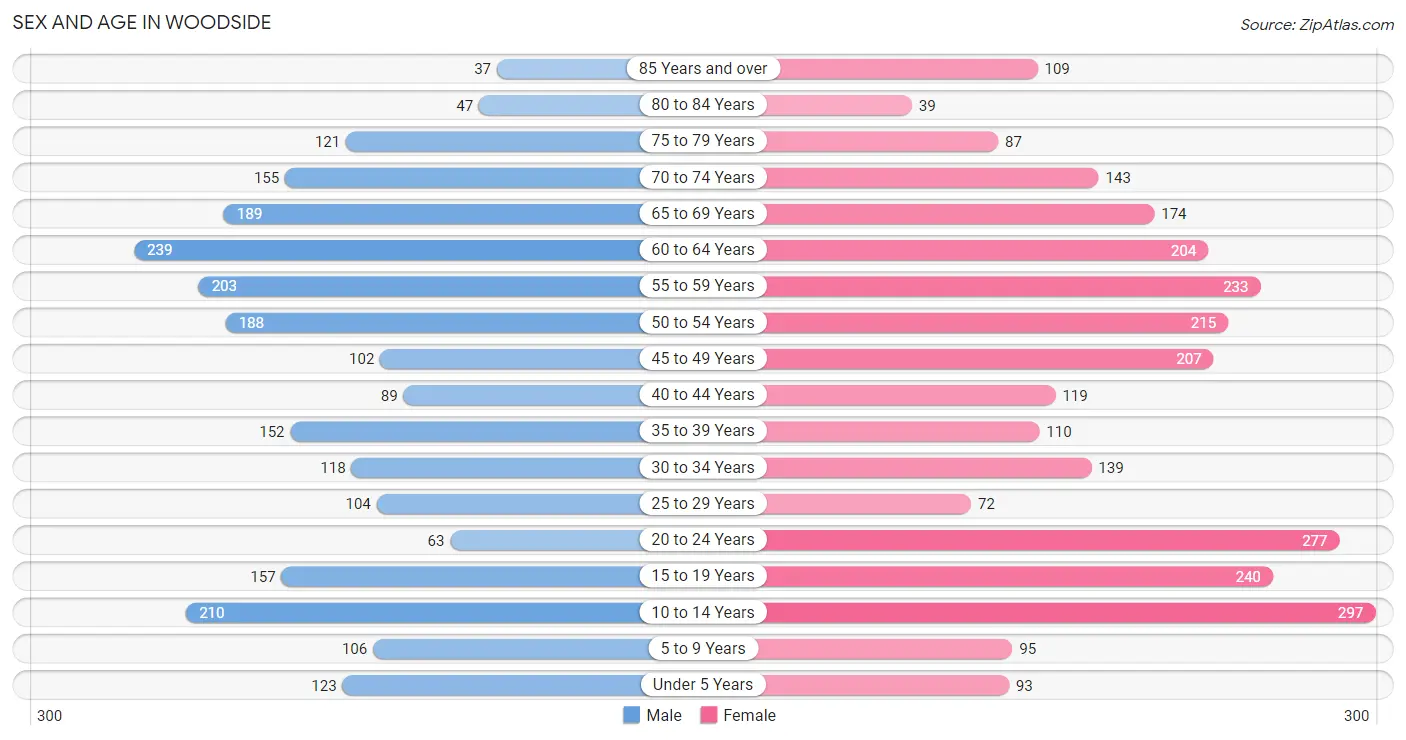
The most populous age groups in Woodside are 60 to 64 Years (239 | 10.0%) for men and 10 to 14 Years (297 | 10.4%) for women.
| Age Bracket | Male | Female |
| Under 5 Years | 123 (5.1%) | 93 (3.3%) |
| 5 to 9 Years | 106 (4.4%) | 95 (3.3%) |
| 10 to 14 Years | 210 (8.7%) | 297 (10.4%) |
| 15 to 19 Years | 157 (6.5%) | 240 (8.4%) |
| 20 to 24 Years | 63 (2.6%) | 277 (9.7%) |
| 25 to 29 Years | 104 (4.3%) | 72 (2.5%) |
| 30 to 34 Years | 118 (4.9%) | 139 (4.9%) |
| 35 to 39 Years | 152 (6.3%) | 110 (3.9%) |
| 40 to 44 Years | 89 (3.7%) | 119 (4.2%) |
| 45 to 49 Years | 102 (4.2%) | 207 (7.3%) |
| 50 to 54 Years | 188 (7.8%) | 215 (7.5%) |
| 55 to 59 Years | 203 (8.5%) | 233 (8.2%) |
| 60 to 64 Years | 239 (10.0%) | 204 (7.1%) |
| 65 to 69 Years | 189 (7.9%) | 174 (6.1%) |
| 70 to 74 Years | 155 (6.5%) | 143 (5.0%) |
| 75 to 79 Years | 121 (5.0%) | 87 (3.0%) |
| 80 to 84 Years | 47 (2.0%) | 39 (1.4%) |
| 85 Years and over | 37 (1.5%) | 109 (3.8%) |
| Total | 2,403 (100.0%) | 2,853 (100.0%) |
Families and Households in Woodside
Median Family Size in Woodside
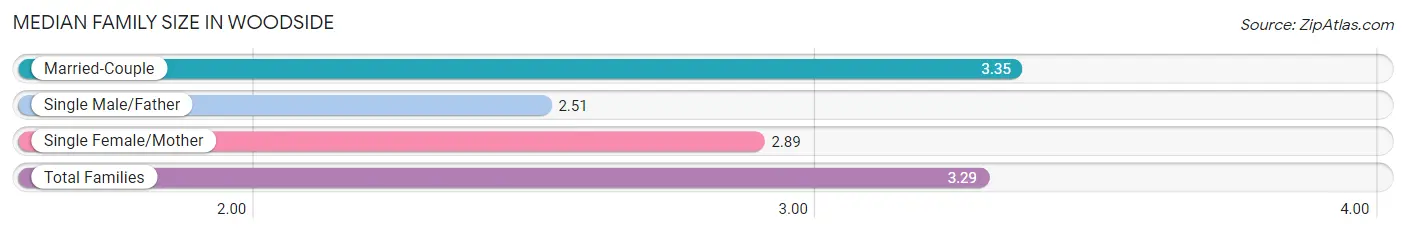
The median family size in Woodside is 3.29 persons per family, with married-couple families (1,265 | 89.3%) accounting for the largest median family size of 3.35 persons per family. On the other hand, single male/father families (55 | 3.9%) represent the smallest median family size with 2.51 persons per family.
| Family Type | # Families | Family Size |
| Married-Couple | 1,265 (89.3%) | 3.35 |
| Single Male/Father | 55 (3.9%) | 2.51 |
| Single Female/Mother | 97 (6.9%) | 2.89 |
| Total Families | 1,417 (100.0%) | 3.29 |
Median Household Size in Woodside
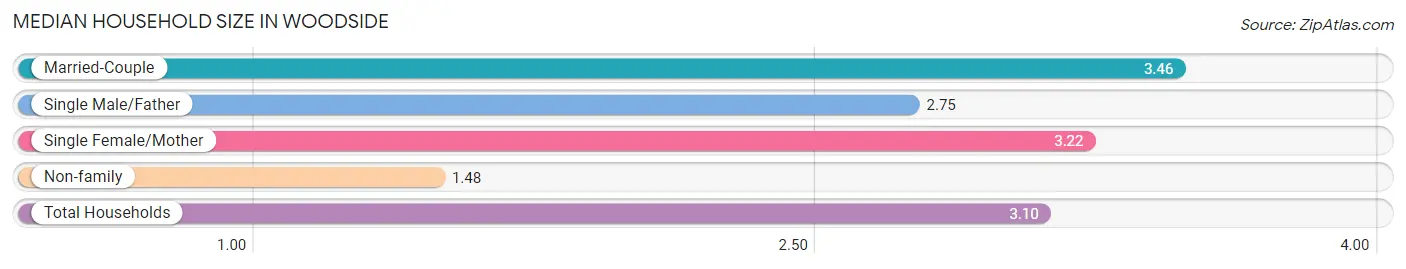
The median household size in Woodside is 3.10 persons per household, with married-couple households (1,265 | 74.6%) accounting for the largest median household size of 3.46 persons per household. non-family households (279 | 16.5%) represent the smallest median household size with 1.48 persons per household.
| Household Type | # Households | Household Size |
| Married-Couple | 1,265 (74.6%) | 3.46 |
| Single Male/Father | 55 (3.2%) | 2.75 |
| Single Female/Mother | 97 (5.7%) | 3.22 |
| Non-family | 279 (16.5%) | 1.48 |
| Total Households | 1,696 (100.0%) | 3.10 |
Household Size by Marriage Status in Woodside
Out of a total of 1,696 households in Woodside, 1,417 (83.6%) are family households, while 279 (16.5%) are nonfamily households. The most numerous type of family households are 2-person households, comprising 540, and the most common type of nonfamily households are 1-person households, comprising 203.
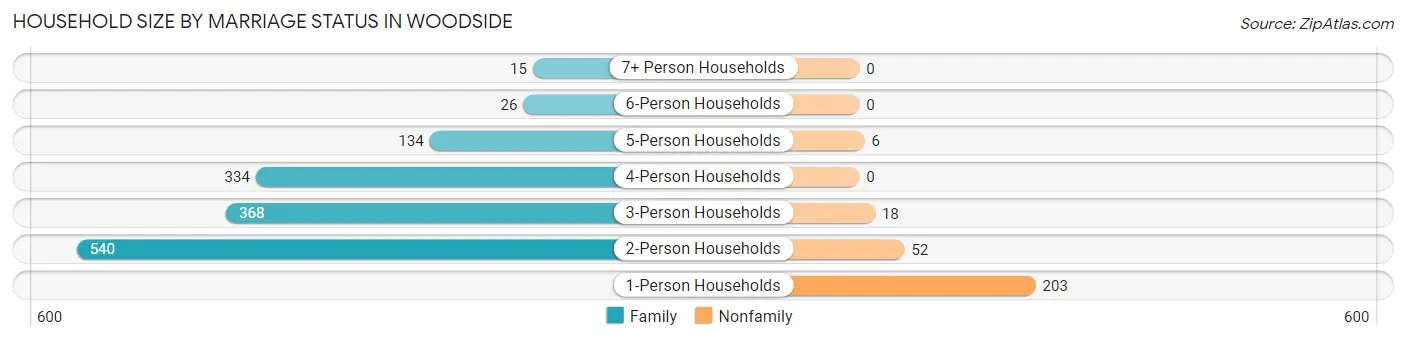
| Household Size | Family Households | Nonfamily Households |
| 1-Person Households | - | 203 (12.0%) |
| 2-Person Households | 540 (31.8%) | 52 (3.1%) |
| 3-Person Households | 368 (21.7%) | 18 (1.1%) |
| 4-Person Households | 334 (19.7%) | 0 (0.0%) |
| 5-Person Households | 134 (7.9%) | 6 (0.4%) |
| 6-Person Households | 26 (1.5%) | 0 (0.0%) |
| 7+ Person Households | 15 (0.9%) | 0 (0.0%) |
| Total | 1,417 (83.6%) | 279 (16.5%) |
Female Fertility in Woodside
Fertility by Age in Woodside
Average fertility rate in Woodside is 45.0 births per 1,000 women. Women in the age bracket of 35 to 50 years have the highest fertility rate with 86.0 births per 1,000 women. Women in the age bracket of 35 to 50 years acount for 76.4% of all women with births.
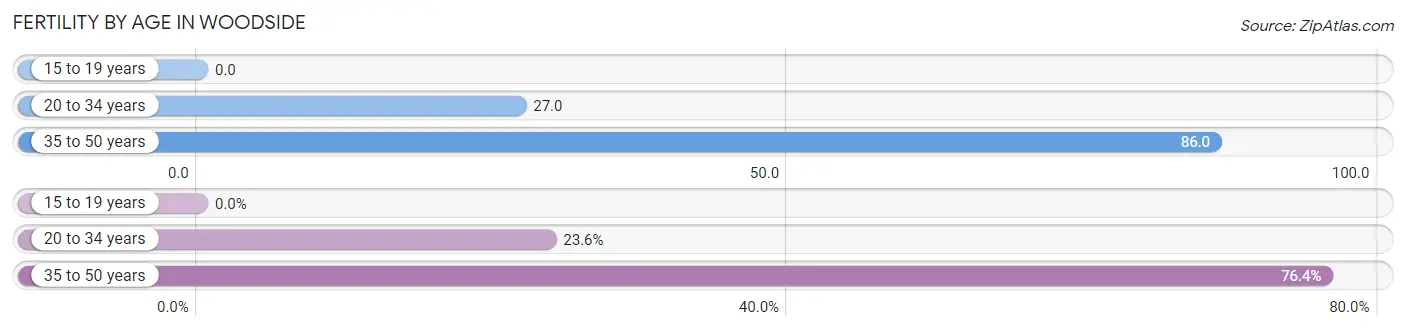
| Age Bracket | Women with Births | Births / 1,000 Women |
| 15 to 19 years | 0 (0.0%) | 0.0 |
| 20 to 34 years | 13 (23.6%) | 27.0 |
| 35 to 50 years | 42 (76.4%) | 86.0 |
| Total | 55 (100.0%) | 45.0 |
Fertility by Age by Marriage Status in Woodside
76.4% of women with births (55) in Woodside are married. The highest percentage of unmarried women with births falls into 35 to 50 years age bracket with 30.9% of them unmarried at the time of birth, while the lowest percentage of unmarried women with births belong to 20 to 34 years age bracket with 0.0% of them unmarried.
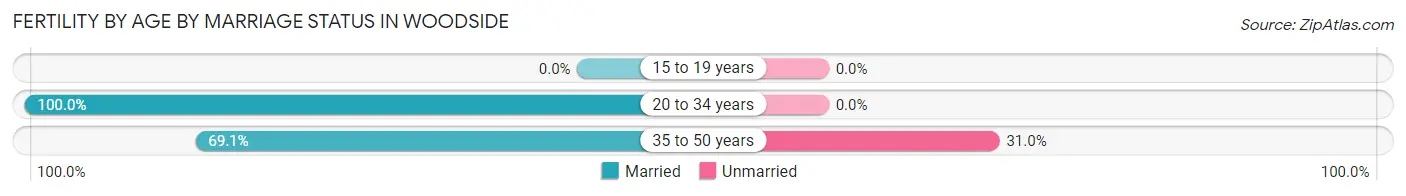
| Age Bracket | Married | Unmarried |
| 15 to 19 years | 0 (0.0%) | 0 (0.0%) |
| 20 to 34 years | 13 (100.0%) | 0 (0.0%) |
| 35 to 50 years | 29 (69.1%) | 13 (30.9%) |
| Total | 42 (76.4%) | 13 (23.6%) |
Fertility by Education in Woodside
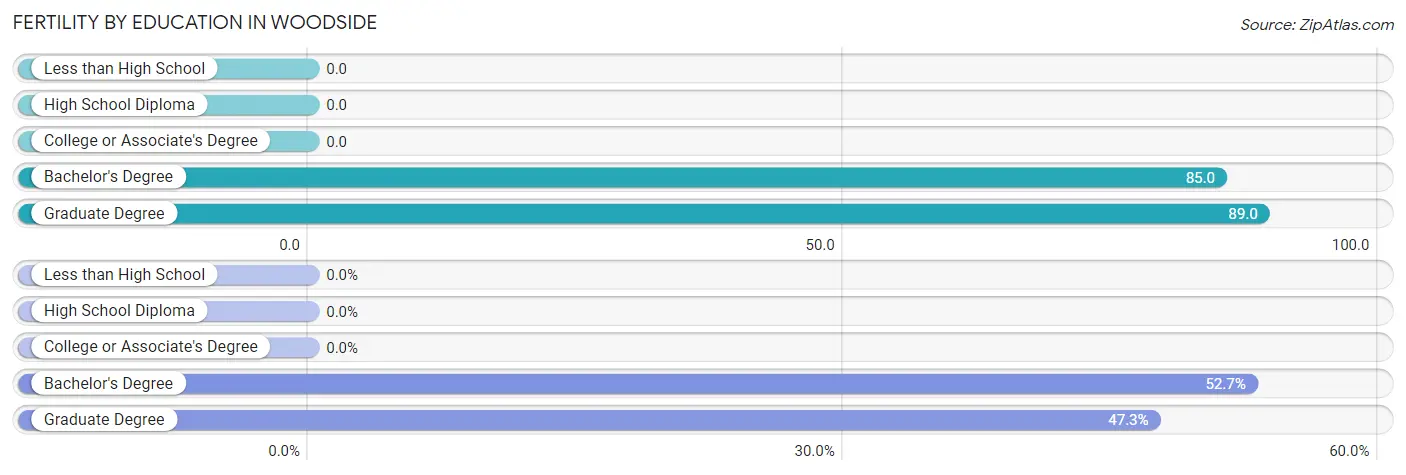
| Educational Attainment | Women with Births | Births / 1,000 Women |
| Less than High School | 0 (0.0%) | 0.0 |
| High School Diploma | 0 (0.0%) | 0.0 |
| College or Associate's Degree | 0 (0.0%) | 0.0 |
| Bachelor's Degree | 29 (52.7%) | 85.0 |
| Graduate Degree | 26 (47.3%) | 89.0 |
| Total | 55 (100.0%) | 45.0 |
Fertility by Education by Marriage Status in Woodside
23.6% of women with births in Woodside are unmarried. Women with the educational attainment of bachelor's degree are most likely to be married with 100.0% of them married at childbirth, while women with the educational attainment of graduate degree are least likely to be married with 50.0% of them unmarried at childbirth.
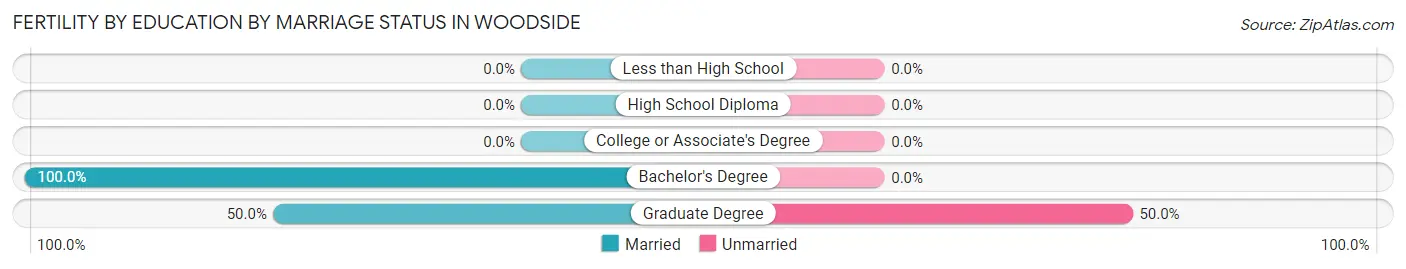
| Educational Attainment | Married | Unmarried |
| Less than High School | 0 (0.0%) | 0 (0.0%) |
| High School Diploma | 0 (0.0%) | 0 (0.0%) |
| College or Associate's Degree | 0 (0.0%) | 0 (0.0%) |
| Bachelor's Degree | 29 (100.0%) | 0 (0.0%) |
| Graduate Degree | 13 (50.0%) | 13 (50.0%) |
| Total | 42 (76.4%) | 13 (23.6%) |
Employment Characteristics in Woodside
Employment by Class of Employer in Woodside
Among the 2,394 employed individuals in Woodside, private company employees (1,519 | 63.4%), self-employed (not incorporated) (276 | 11.5%), and not-for-profit organizations (261 | 10.9%) make up the most common classes of employment.
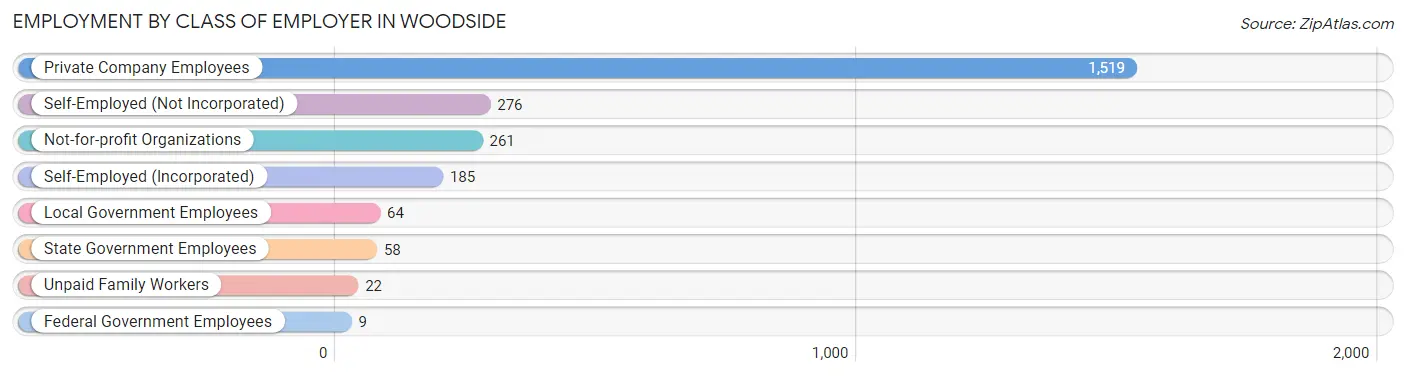
| Employer Class | # Employees | % Employees |
| Private Company Employees | 1,519 | 63.4% |
| Self-Employed (Incorporated) | 185 | 7.7% |
| Self-Employed (Not Incorporated) | 276 | 11.5% |
| Not-for-profit Organizations | 261 | 10.9% |
| Local Government Employees | 64 | 2.7% |
| State Government Employees | 58 | 2.4% |
| Federal Government Employees | 9 | 0.4% |
| Unpaid Family Workers | 22 | 0.9% |
| Total | 2,394 | 100.0% |
Employment Status by Age in Woodside
According to the labor force statistics for Woodside, out of the total population over 16 years of age (4,190), 60.1% or 2,518 individuals are in the labor force, with 4.5% or 113 of them unemployed. The age group with the highest labor force participation rate is 25 to 29 years, with 100.0% or 176 individuals in the labor force. Within the labor force, the 75 years and over age range has the highest percentage of unemployed individuals, with 16.4% or 9 of them being unemployed.
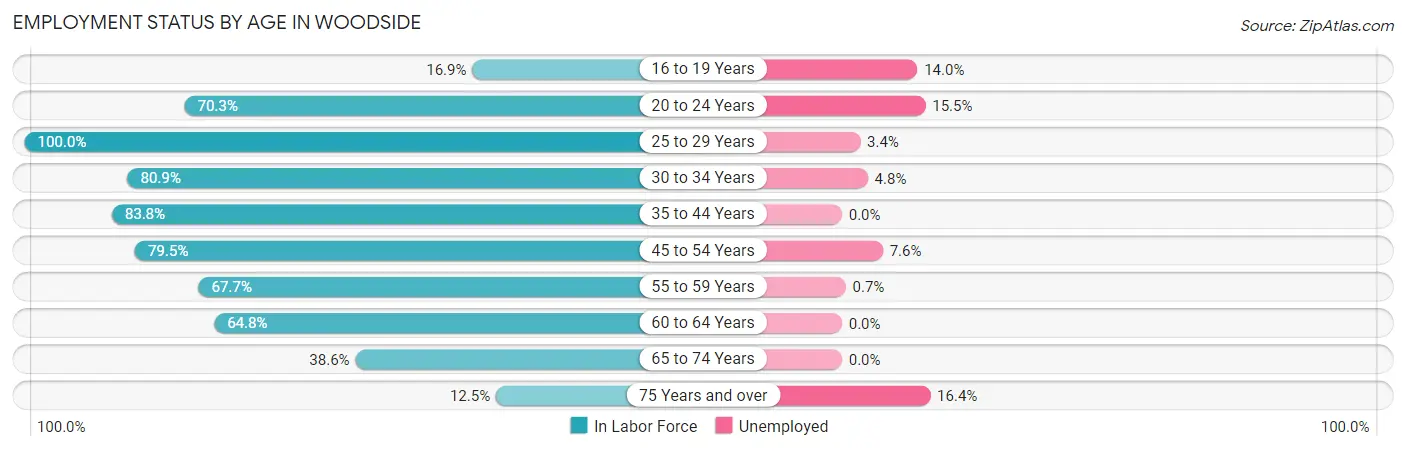
| Age Bracket | In Labor Force | Unemployed |
| 16 to 19 Years | 43 (16.9%) | 6 (14.0%) |
| 20 to 24 Years | 239 (70.3%) | 37 (15.5%) |
| 25 to 29 Years | 176 (100.0%) | 6 (3.4%) |
| 30 to 34 Years | 208 (80.9%) | 10 (4.8%) |
| 35 to 44 Years | 394 (83.8%) | 0 (0.0%) |
| 45 to 54 Years | 566 (79.5%) | 43 (7.6%) |
| 55 to 59 Years | 295 (67.7%) | 2 (0.7%) |
| 60 to 64 Years | 287 (64.8%) | 0 (0.0%) |
| 65 to 74 Years | 255 (38.6%) | 0 (0.0%) |
| 75 Years and over | 55 (12.5%) | 9 (16.4%) |
| Total | 2,518 (60.1%) | 113 (4.5%) |
Employment Status by Educational Attainment in Woodside
According to labor force statistics for Woodside, 77.2% of individuals (1,925) out of the total population between 25 and 64 years of age (2,494) are in the labor force, with 3.2% or 62 of them being unemployed. The group with the highest labor force participation rate are those with the educational attainment of less than high school, with 100.0% or 38 individuals in the labor force. Within the labor force, individuals with high school diploma education have the highest percentage of unemployment, with 19.5% or 36 of them being unemployed.
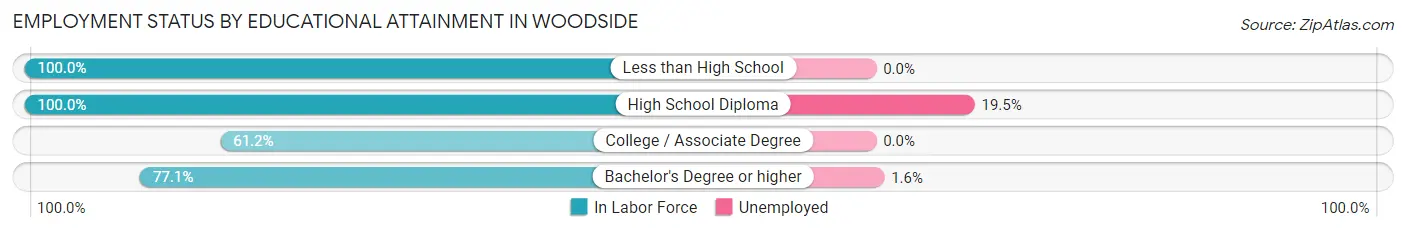
| Educational Attainment | In Labor Force | Unemployed |
| Less than High School | 38 (100.0%) | 0 (0.0%) |
| High School Diploma | 185 (100.0%) | 36 (19.5%) |
| College / Associate Degree | 186 (61.2%) | 0 (0.0%) |
| Bachelor's Degree or higher | 1,517 (77.1%) | 31 (1.6%) |
| Total | 1,925 (77.2%) | 80 (3.2%) |
Employment Occupations by Sex in Woodside
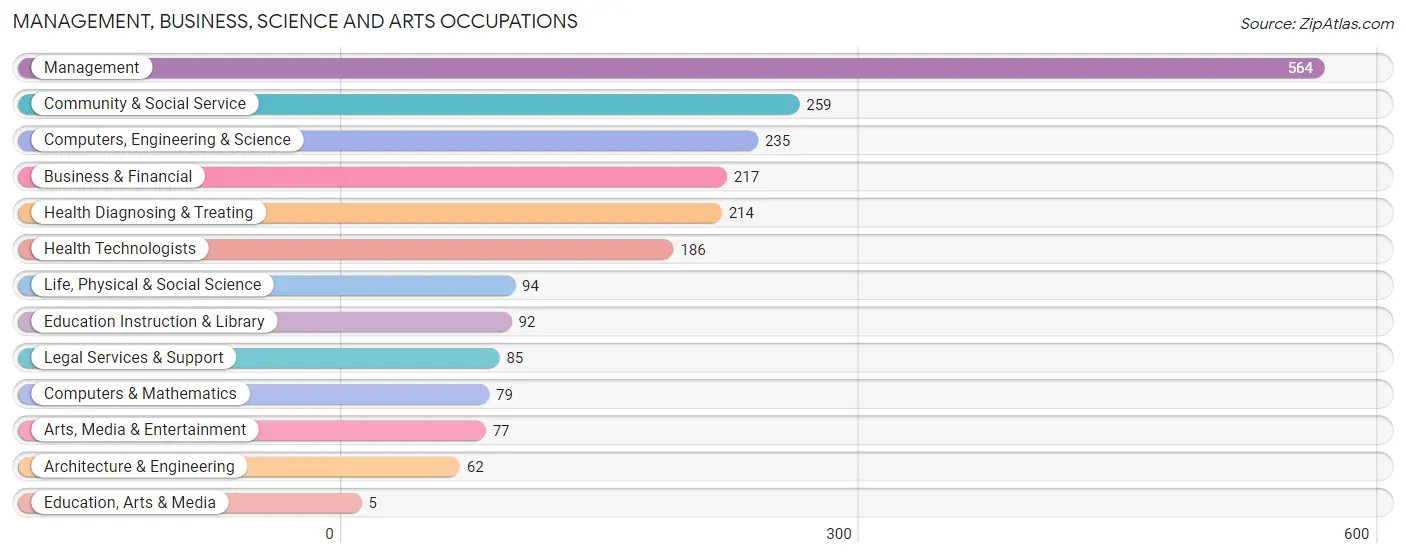
Management, Business, Science and Arts Occupations
The most common Management, Business, Science and Arts occupations in Woodside are Management (564 | 23.4%), Community & Social Service (259 | 10.8%), Computers, Engineering & Science (235 | 9.8%), Business & Financial (217 | 9.0%), and Health Diagnosing & Treating (214 | 8.9%).
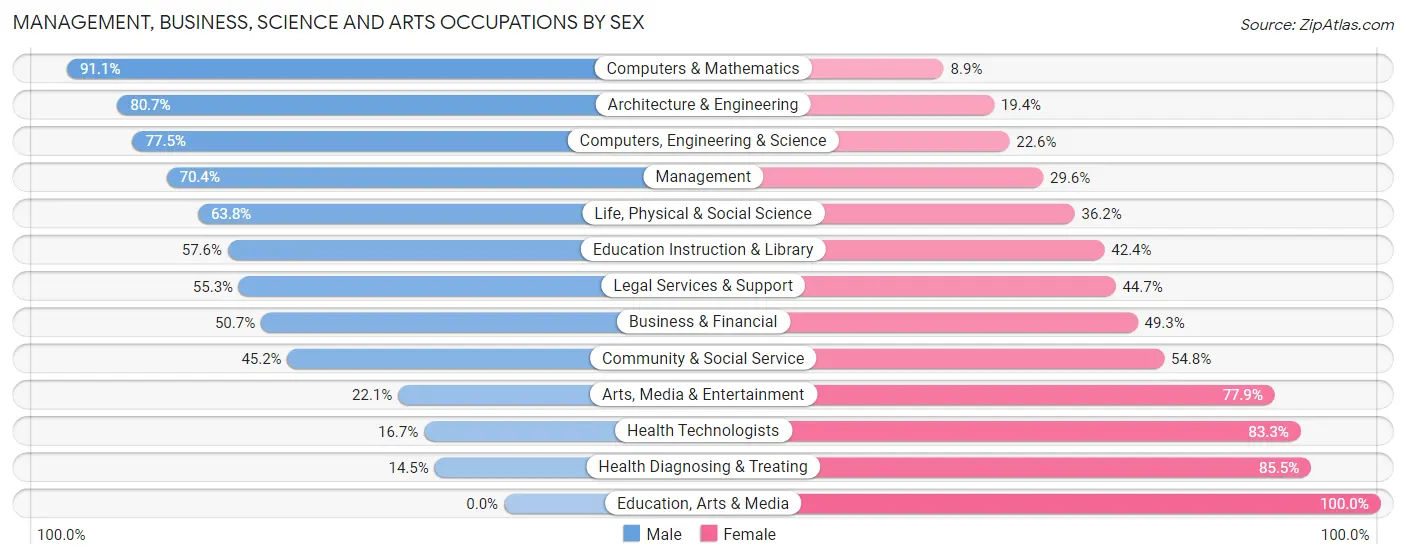
Management, Business, Science and Arts Occupations by Sex
Within the Management, Business, Science and Arts occupations in Woodside, the most male-oriented occupations are Computers & Mathematics (91.1%), Architecture & Engineering (80.6%), and Computers, Engineering & Science (77.4%), while the most female-oriented occupations are Education, Arts & Media (100.0%), Health Diagnosing & Treating (85.5%), and Health Technologists (83.3%).
| Occupation | Male | Female |
| Management | 397 (70.4%) | 167 (29.6%) |
| Business & Financial | 110 (50.7%) | 107 (49.3%) |
| Computers, Engineering & Science | 182 (77.4%) | 53 (22.6%) |
| Computers & Mathematics | 72 (91.1%) | 7 (8.9%) |
| Architecture & Engineering | 50 (80.6%) | 12 (19.4%) |
| Life, Physical & Social Science | 60 (63.8%) | 34 (36.2%) |
| Community & Social Service | 117 (45.2%) | 142 (54.8%) |
| Education, Arts & Media | 0 (0.0%) | 5 (100.0%) |
| Legal Services & Support | 47 (55.3%) | 38 (44.7%) |
| Education Instruction & Library | 53 (57.6%) | 39 (42.4%) |
| Arts, Media & Entertainment | 17 (22.1%) | 60 (77.9%) |
| Health Diagnosing & Treating | 31 (14.5%) | 183 (85.5%) |
| Health Technologists | 31 (16.7%) | 155 (83.3%) |
| Total (Category) | 837 (56.2%) | 652 (43.8%) |
| Total (Overall) | 1,281 (53.3%) | 1,124 (46.7%) |
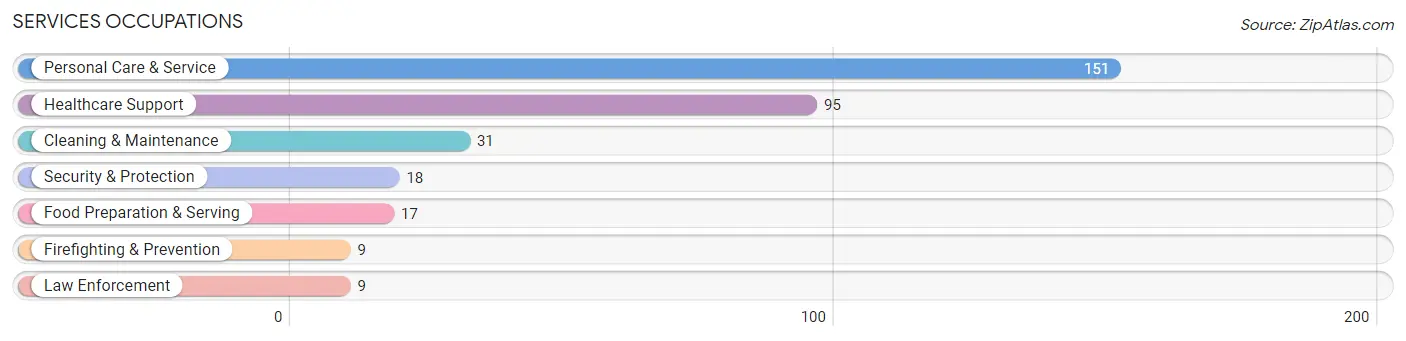
Services Occupations
The most common Services occupations in Woodside are Personal Care & Service (151 | 6.3%), Healthcare Support (95 | 4.0%), Cleaning & Maintenance (31 | 1.3%), Security & Protection (18 | 0.7%), and Food Preparation & Serving (17 | 0.7%).
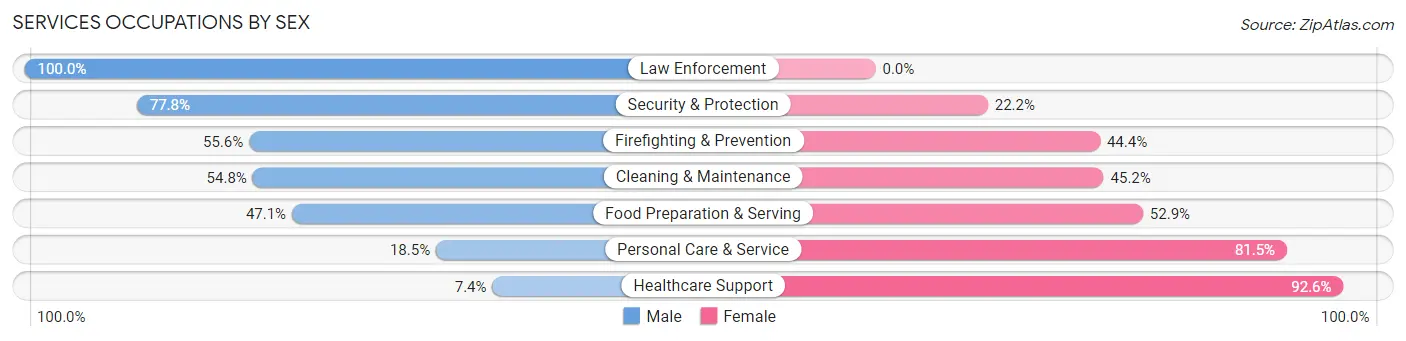
Services Occupations by Sex
Within the Services occupations in Woodside, the most male-oriented occupations are Law Enforcement (100.0%), Security & Protection (77.8%), and Firefighting & Prevention (55.6%), while the most female-oriented occupations are Healthcare Support (92.6%), Personal Care & Service (81.5%), and Food Preparation & Serving (52.9%).
| Occupation | Male | Female |
| Healthcare Support | 7 (7.4%) | 88 (92.6%) |
| Security & Protection | 14 (77.8%) | 4 (22.2%) |
| Firefighting & Prevention | 5 (55.6%) | 4 (44.4%) |
| Law Enforcement | 9 (100.0%) | 0 (0.0%) |
| Food Preparation & Serving | 8 (47.1%) | 9 (52.9%) |
| Cleaning & Maintenance | 17 (54.8%) | 14 (45.2%) |
| Personal Care & Service | 28 (18.5%) | 123 (81.5%) |
| Total (Category) | 74 (23.7%) | 238 (76.3%) |
| Total (Overall) | 1,281 (53.3%) | 1,124 (46.7%) |
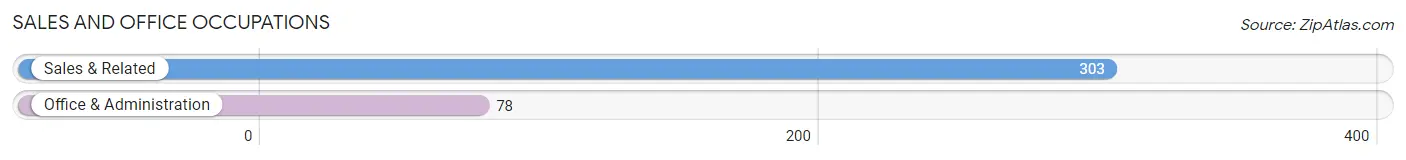
Sales and Office Occupations
The most common Sales and Office occupations in Woodside are Sales & Related (303 | 12.6%), and Office & Administration (78 | 3.2%).
Sales and Office Occupations by Sex
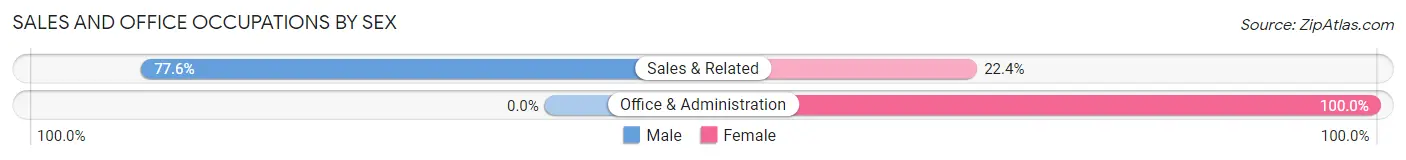
| Occupation | Male | Female |
| Sales & Related | 235 (77.6%) | 68 (22.4%) |
| Office & Administration | 0 (0.0%) | 78 (100.0%) |
| Total (Category) | 235 (61.7%) | 146 (38.3%) |
| Total (Overall) | 1,281 (53.3%) | 1,124 (46.7%) |
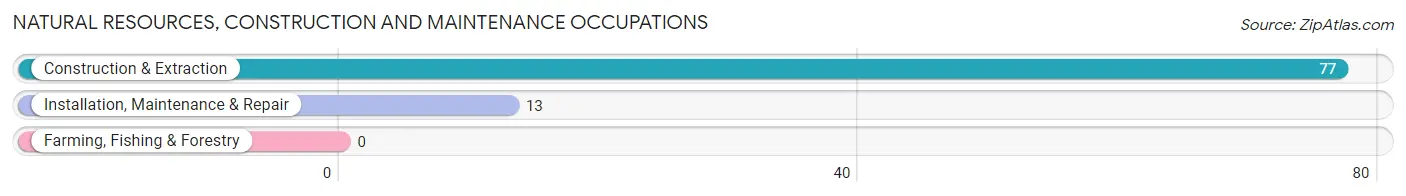
Natural Resources, Construction and Maintenance Occupations
The most common Natural Resources, Construction and Maintenance occupations in Woodside are Construction & Extraction (77 | 3.2%), and Installation, Maintenance & Repair (13 | 0.5%).
Natural Resources, Construction and Maintenance Occupations by Sex
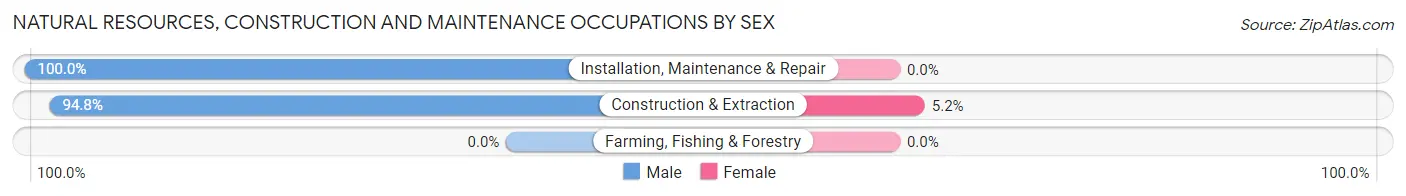
| Occupation | Male | Female |
| Farming, Fishing & Forestry | 0 (0.0%) | 0 (0.0%) |
| Construction & Extraction | 73 (94.8%) | 4 (5.2%) |
| Installation, Maintenance & Repair | 13 (100.0%) | 0 (0.0%) |
| Total (Category) | 86 (95.6%) | 4 (4.4%) |
| Total (Overall) | 1,281 (53.3%) | 1,124 (46.7%) |
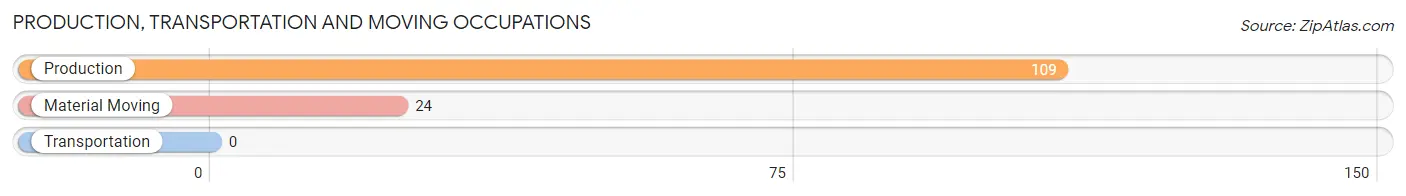
Production, Transportation and Moving Occupations
The most common Production, Transportation and Moving occupations in Woodside are Production (109 | 4.5%), and Material Moving (24 | 1.0%).
Production, Transportation and Moving Occupations by Sex
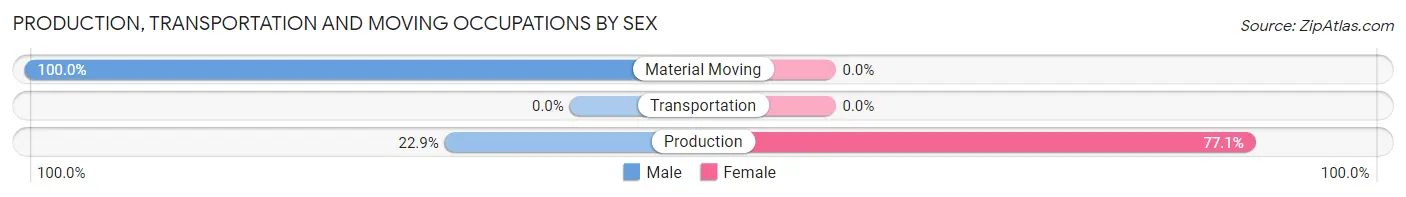
| Occupation | Male | Female |
| Production | 25 (22.9%) | 84 (77.1%) |
| Transportation | 0 (0.0%) | 0 (0.0%) |
| Material Moving | 24 (100.0%) | 0 (0.0%) |
| Total (Category) | 49 (36.8%) | 84 (63.2%) |
| Total (Overall) | 1,281 (53.3%) | 1,124 (46.7%) |
Employment Industries by Sex in Woodside
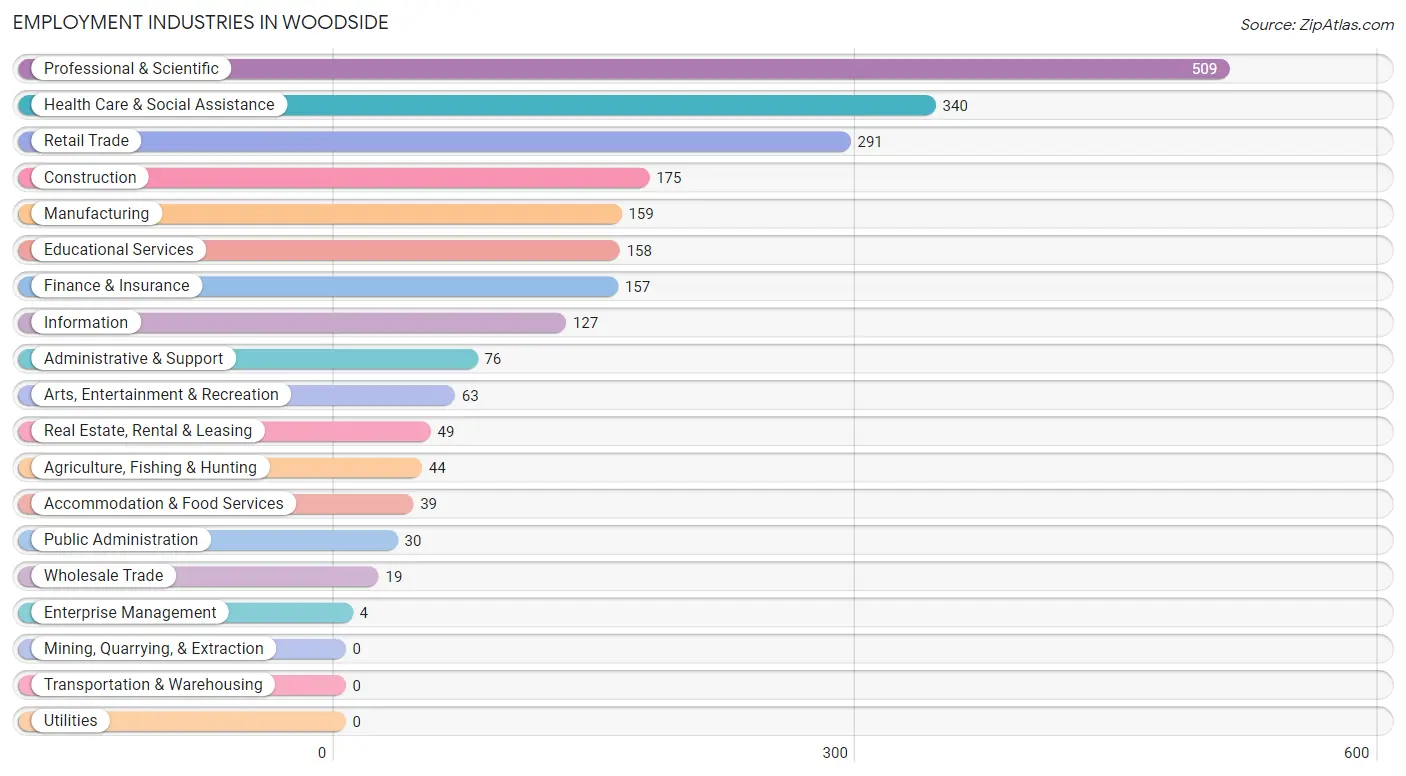
Employment Industries in Woodside
The major employment industries in Woodside include Professional & Scientific (509 | 21.2%), Health Care & Social Assistance (340 | 14.1%), Retail Trade (291 | 12.1%), Construction (175 | 7.3%), and Manufacturing (159 | 6.6%).
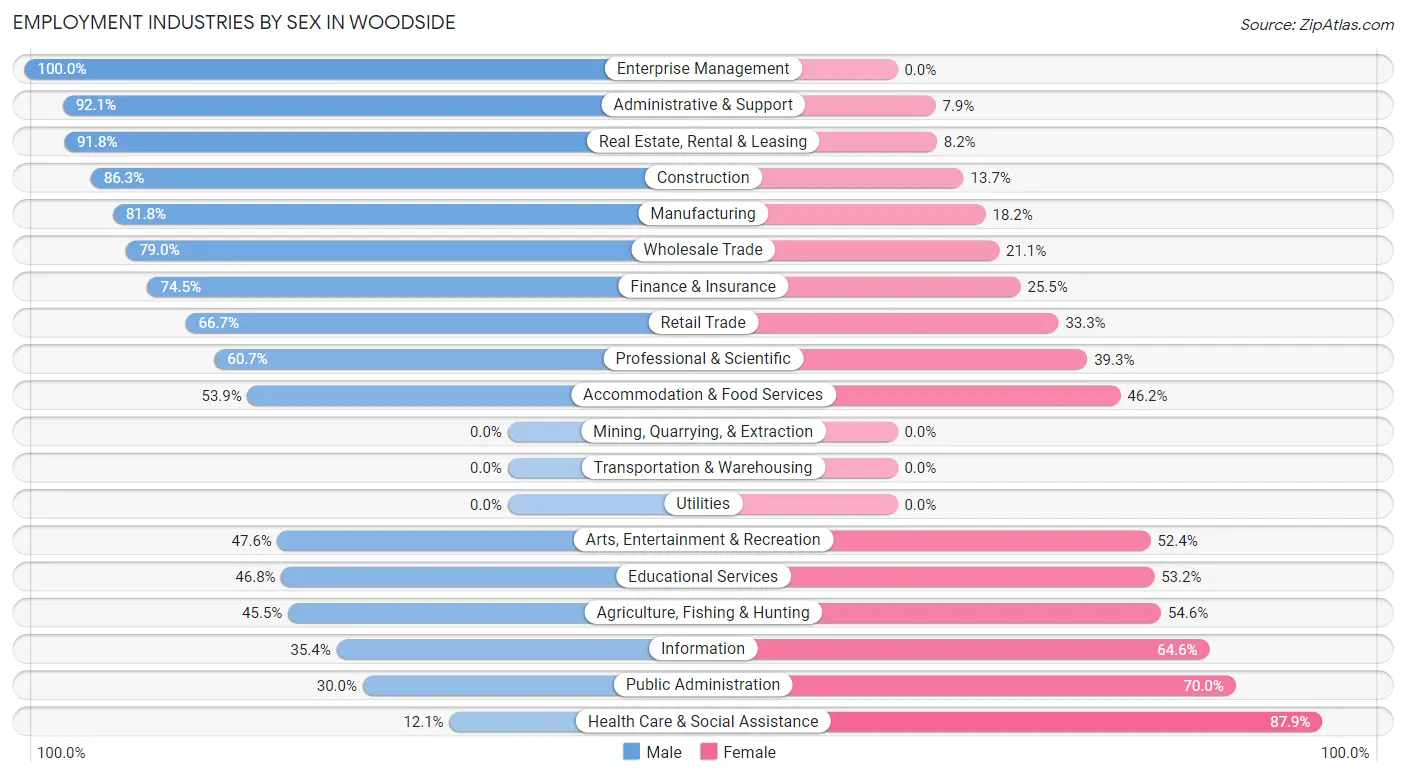
Employment Industries by Sex in Woodside
The Woodside industries that see more men than women are Enterprise Management (100.0%), Administrative & Support (92.1%), and Real Estate, Rental & Leasing (91.8%), whereas the industries that tend to have a higher number of women are Health Care & Social Assistance (87.9%), Public Administration (70.0%), and Information (64.6%).
| Industry | Male | Female |
| Agriculture, Fishing & Hunting | 20 (45.5%) | 24 (54.5%) |
| Mining, Quarrying, & Extraction | 0 (0.0%) | 0 (0.0%) |
| Construction | 151 (86.3%) | 24 (13.7%) |
| Manufacturing | 130 (81.8%) | 29 (18.2%) |
| Wholesale Trade | 15 (78.9%) | 4 (21.0%) |
| Retail Trade | 194 (66.7%) | 97 (33.3%) |
| Transportation & Warehousing | 0 (0.0%) | 0 (0.0%) |
| Utilities | 0 (0.0%) | 0 (0.0%) |
| Information | 45 (35.4%) | 82 (64.6%) |
| Finance & Insurance | 117 (74.5%) | 40 (25.5%) |
| Real Estate, Rental & Leasing | 45 (91.8%) | 4 (8.2%) |
| Professional & Scientific | 309 (60.7%) | 200 (39.3%) |
| Enterprise Management | 4 (100.0%) | 0 (0.0%) |
| Administrative & Support | 70 (92.1%) | 6 (7.9%) |
| Educational Services | 74 (46.8%) | 84 (53.2%) |
| Health Care & Social Assistance | 41 (12.1%) | 299 (87.9%) |
| Arts, Entertainment & Recreation | 30 (47.6%) | 33 (52.4%) |
| Accommodation & Food Services | 21 (53.8%) | 18 (46.2%) |
| Public Administration | 9 (30.0%) | 21 (70.0%) |
| Total | 1,281 (53.3%) | 1,124 (46.7%) |
Education in Woodside
School Enrollment in Woodside
The most common levels of schooling among the 1,319 students in Woodside are middle school (397 | 30.1%), high school (369 | 28.0%), and elementary school (190 | 14.4%).
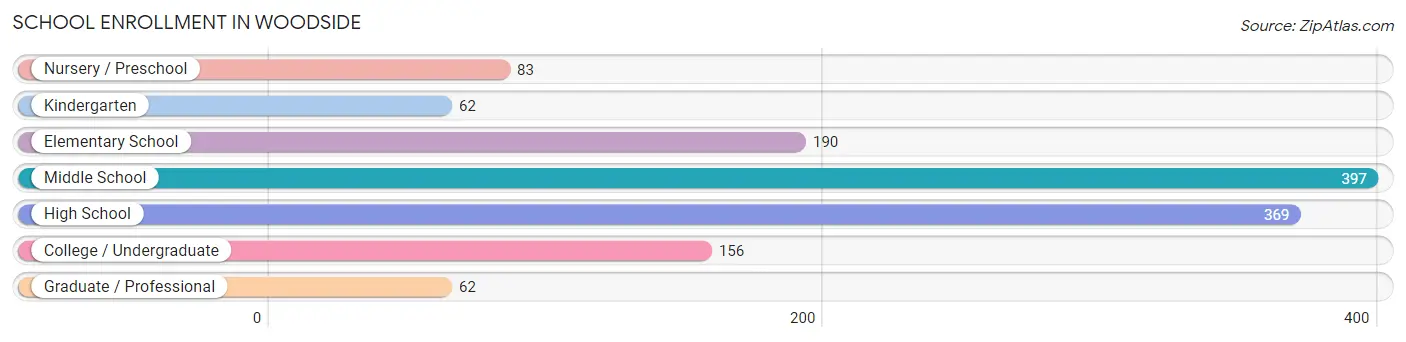
| School Level | # Students | % Students |
| Nursery / Preschool | 83 | 6.3% |
| Kindergarten | 62 | 4.7% |
| Elementary School | 190 | 14.4% |
| Middle School | 397 | 30.1% |
| High School | 369 | 28.0% |
| College / Undergraduate | 156 | 11.8% |
| Graduate / Professional | 62 | 4.7% |
| Total | 1,319 | 100.0% |
School Enrollment by Age by Funding Source in Woodside
Out of a total of 1,319 students who are enrolled in schools in Woodside, 406 (30.8%) attend a private institution, while the remaining 913 (69.2%) are enrolled in public schools. The age group of 3 to 4 year olds has the highest likelihood of being enrolled in private schools, with 45 (69.2% in the age bracket) enrolled. Conversely, the age group of 10 to 14 year olds has the lowest likelihood of being enrolled in a private school, with 392 (77.9% in the age bracket) attending a public institution.
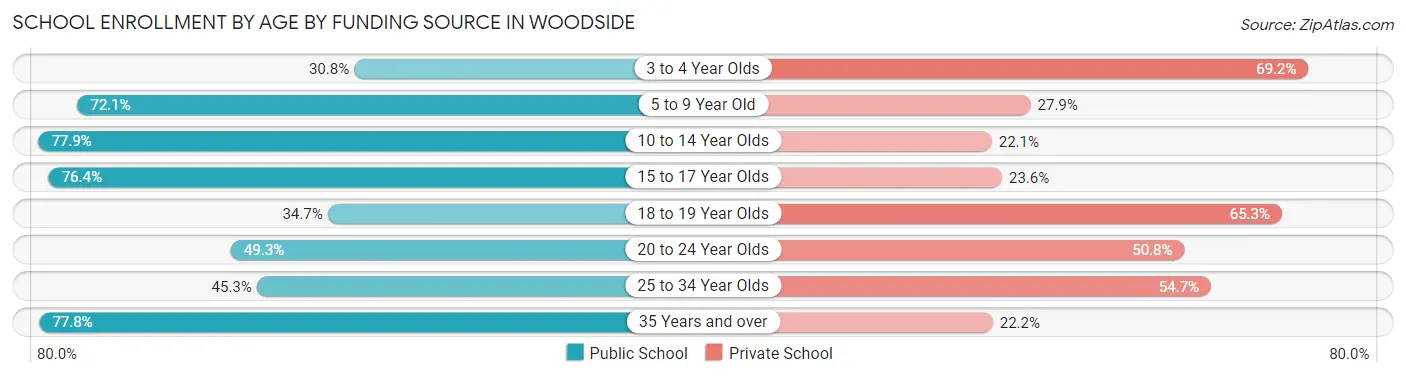
| Age Bracket | Public School | Private School |
| 3 to 4 Year Olds | 20 (30.8%) | 45 (69.2%) |
| 5 to 9 Year Old | 145 (72.1%) | 56 (27.9%) |
| 10 to 14 Year Olds | 392 (77.9%) | 111 (22.1%) |
| 15 to 17 Year Olds | 246 (76.4%) | 76 (23.6%) |
| 18 to 19 Year Olds | 25 (34.7%) | 47 (65.3%) |
| 20 to 24 Year Olds | 33 (49.2%) | 34 (50.7%) |
| 25 to 34 Year Olds | 24 (45.3%) | 29 (54.7%) |
| 35 Years and over | 28 (77.8%) | 8 (22.2%) |
| Total | 913 (69.2%) | 406 (30.8%) |
Educational Attainment by Field of Study in Woodside
Social sciences (402 | 13.6%), engineering (401 | 13.5%), business (353 | 11.9%), bio, nature & agricultural (289 | 9.8%), and literature & languages (280 | 9.5%) are the most common fields of study among 2,962 individuals in Woodside who have obtained a bachelor's degree or higher.
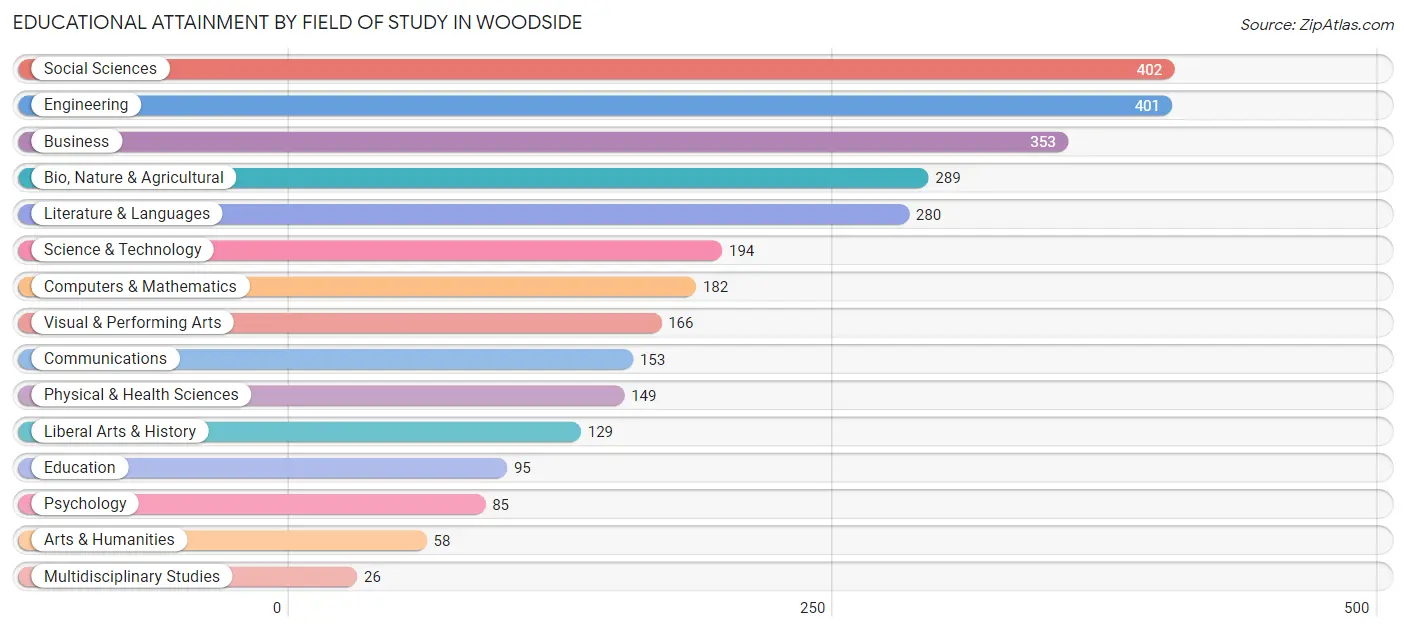
| Field of Study | # Graduates | % Graduates |
| Computers & Mathematics | 182 | 6.1% |
| Bio, Nature & Agricultural | 289 | 9.8% |
| Physical & Health Sciences | 149 | 5.0% |
| Psychology | 85 | 2.9% |
| Social Sciences | 402 | 13.6% |
| Engineering | 401 | 13.5% |
| Multidisciplinary Studies | 26 | 0.9% |
| Science & Technology | 194 | 6.6% |
| Business | 353 | 11.9% |
| Education | 95 | 3.2% |
| Literature & Languages | 280 | 9.5% |
| Liberal Arts & History | 129 | 4.4% |
| Visual & Performing Arts | 166 | 5.6% |
| Communications | 153 | 5.2% |
| Arts & Humanities | 58 | 2.0% |
| Total | 2,962 | 100.0% |
Transportation & Commute in Woodside
Vehicle Availability by Sex in Woodside
The most prevalent vehicle ownership categories in Woodside are males with 2 vehicles (376, accounting for 29.4%) and females with 2 vehicles (342, making up 33.7%).
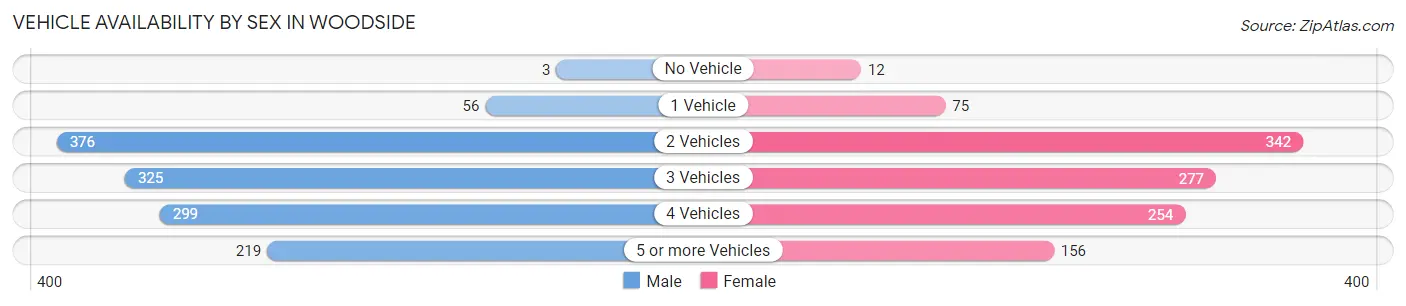
| Vehicles Available | Male | Female |
| No Vehicle | 3 (0.2%) | 12 (1.1%) |
| 1 Vehicle | 56 (4.4%) | 75 (6.7%) |
| 2 Vehicles | 376 (29.4%) | 342 (30.6%) |
| 3 Vehicles | 325 (25.4%) | 277 (24.8%) |
| 4 Vehicles | 299 (23.4%) | 254 (22.8%) |
| 5 or more Vehicles | 219 (17.1%) | 156 (14.0%) |
| Total | 1,278 (100.0%) | 1,116 (100.0%) |
Commute Time in Woodside
The most frequently occuring commute durations in Woodside are 20 to 24 minutes (338 commuters, 19.4%), 15 to 19 minutes (303 commuters, 17.4%), and 30 to 34 minutes (302 commuters, 17.3%).
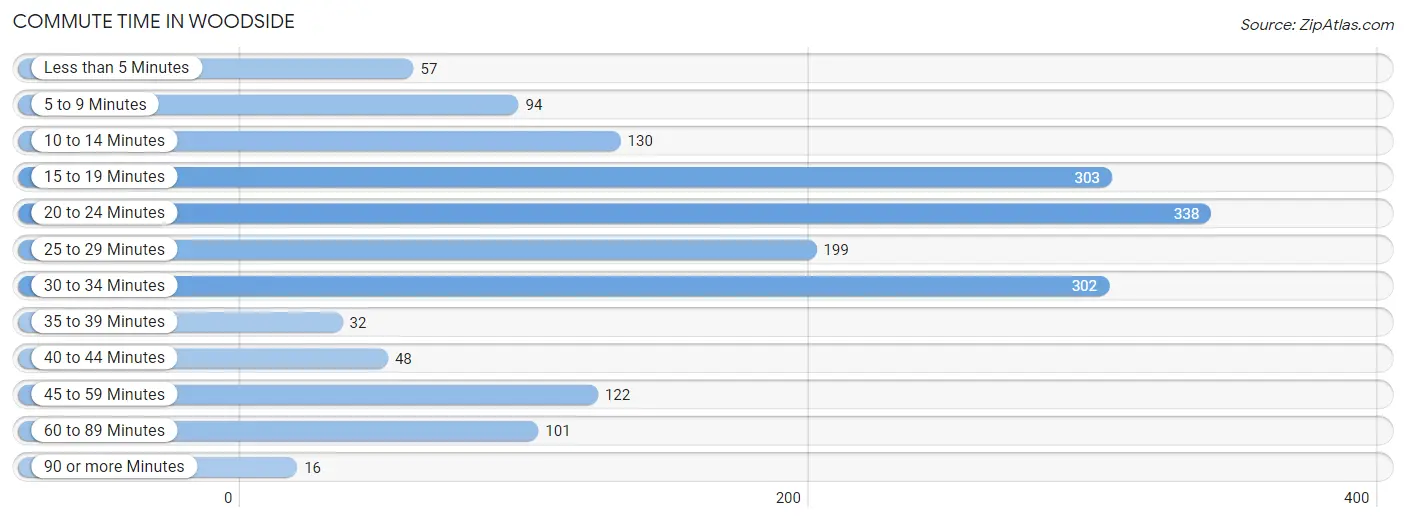
| Commute Time | # Commuters | % Commuters |
| Less than 5 Minutes | 57 | 3.3% |
| 5 to 9 Minutes | 94 | 5.4% |
| 10 to 14 Minutes | 130 | 7.5% |
| 15 to 19 Minutes | 303 | 17.4% |
| 20 to 24 Minutes | 338 | 19.4% |
| 25 to 29 Minutes | 199 | 11.4% |
| 30 to 34 Minutes | 302 | 17.3% |
| 35 to 39 Minutes | 32 | 1.8% |
| 40 to 44 Minutes | 48 | 2.8% |
| 45 to 59 Minutes | 122 | 7.0% |
| 60 to 89 Minutes | 101 | 5.8% |
| 90 or more Minutes | 16 | 0.9% |
Commute Time by Sex in Woodside
The most common commute times in Woodside are 30 to 34 minutes (225 commuters, 23.0%) for males and 20 to 24 minutes (129 commuters, 16.9%) for females.
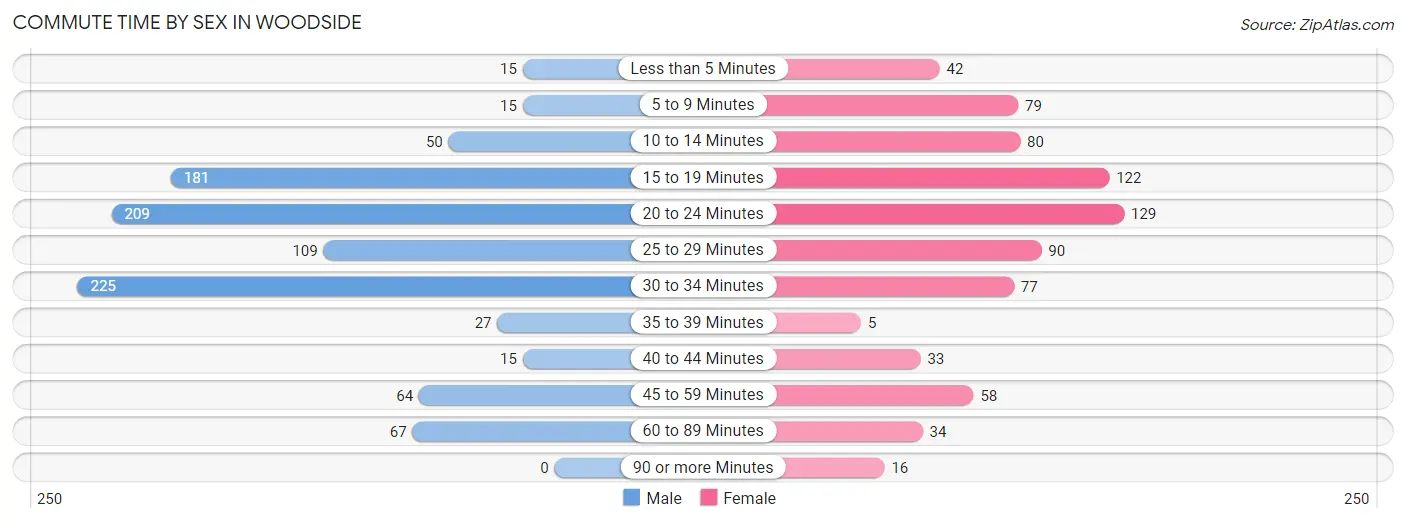
| Commute Time | Male | Female |
| Less than 5 Minutes | 15 (1.5%) | 42 (5.5%) |
| 5 to 9 Minutes | 15 (1.5%) | 79 (10.3%) |
| 10 to 14 Minutes | 50 (5.1%) | 80 (10.5%) |
| 15 to 19 Minutes | 181 (18.5%) | 122 (16.0%) |
| 20 to 24 Minutes | 209 (21.4%) | 129 (16.9%) |
| 25 to 29 Minutes | 109 (11.2%) | 90 (11.8%) |
| 30 to 34 Minutes | 225 (23.0%) | 77 (10.1%) |
| 35 to 39 Minutes | 27 (2.8%) | 5 (0.6%) |
| 40 to 44 Minutes | 15 (1.5%) | 33 (4.3%) |
| 45 to 59 Minutes | 64 (6.6%) | 58 (7.6%) |
| 60 to 89 Minutes | 67 (6.9%) | 34 (4.4%) |
| 90 or more Minutes | 0 (0.0%) | 16 (2.1%) |
Time of Departure to Work by Sex in Woodside
The most frequent times of departure to work in Woodside are 8:00 AM to 8:29 AM (212, 21.7%) for males and 8:30 AM to 8:59 AM (129, 16.9%) for females.
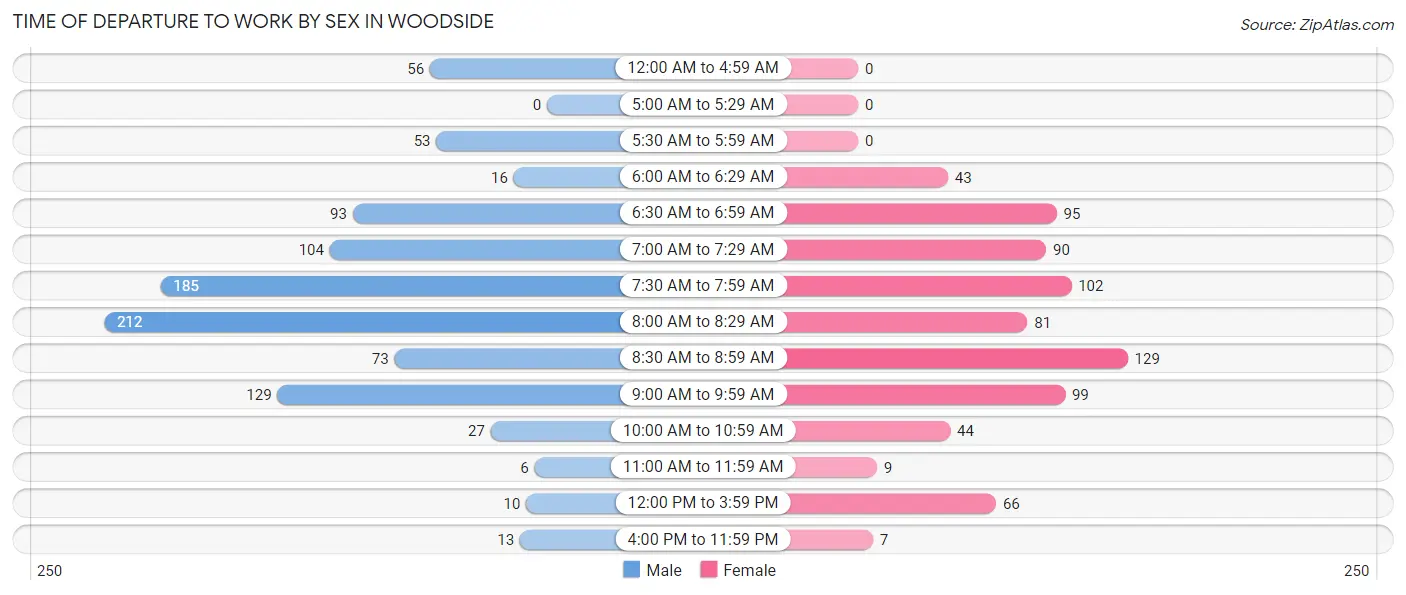
| Time of Departure | Male | Female |
| 12:00 AM to 4:59 AM | 56 (5.7%) | 0 (0.0%) |
| 5:00 AM to 5:29 AM | 0 (0.0%) | 0 (0.0%) |
| 5:30 AM to 5:59 AM | 53 (5.4%) | 0 (0.0%) |
| 6:00 AM to 6:29 AM | 16 (1.6%) | 43 (5.6%) |
| 6:30 AM to 6:59 AM | 93 (9.5%) | 95 (12.4%) |
| 7:00 AM to 7:29 AM | 104 (10.6%) | 90 (11.8%) |
| 7:30 AM to 7:59 AM | 185 (18.9%) | 102 (13.3%) |
| 8:00 AM to 8:29 AM | 212 (21.7%) | 81 (10.6%) |
| 8:30 AM to 8:59 AM | 73 (7.5%) | 129 (16.9%) |
| 9:00 AM to 9:59 AM | 129 (13.2%) | 99 (12.9%) |
| 10:00 AM to 10:59 AM | 27 (2.8%) | 44 (5.8%) |
| 11:00 AM to 11:59 AM | 6 (0.6%) | 9 (1.2%) |
| 12:00 PM to 3:59 PM | 10 (1.0%) | 66 (8.6%) |
| 4:00 PM to 11:59 PM | 13 (1.3%) | 7 (0.9%) |
| Total | 977 (100.0%) | 765 (100.0%) |
Housing Occupancy in Woodside
Occupancy by Ownership in Woodside
Of the total 1,696 dwellings in Woodside, owner-occupied units account for 1,421 (83.8%), while renter-occupied units make up 275 (16.2%).
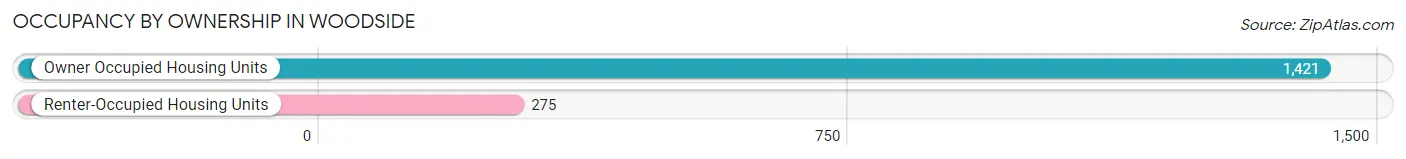
| Occupancy | # Housing Units | % Housing Units |
| Owner Occupied Housing Units | 1,421 | 83.8% |
| Renter-Occupied Housing Units | 275 | 16.2% |
| Total Occupied Housing Units | 1,696 | 100.0% |
Occupancy by Household Size in Woodside
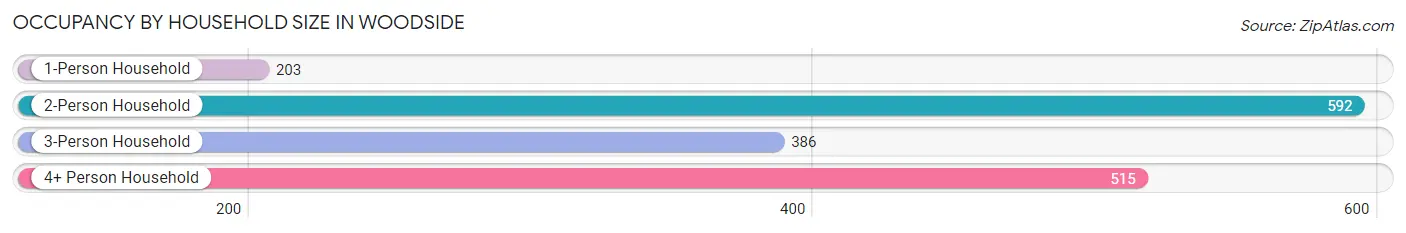
| Household Size | # Housing Units | % Housing Units |
| 1-Person Household | 203 | 12.0% |
| 2-Person Household | 592 | 34.9% |
| 3-Person Household | 386 | 22.8% |
| 4+ Person Household | 515 | 30.4% |
| Total Housing Units | 1,696 | 100.0% |
Occupancy by Ownership by Household Size in Woodside
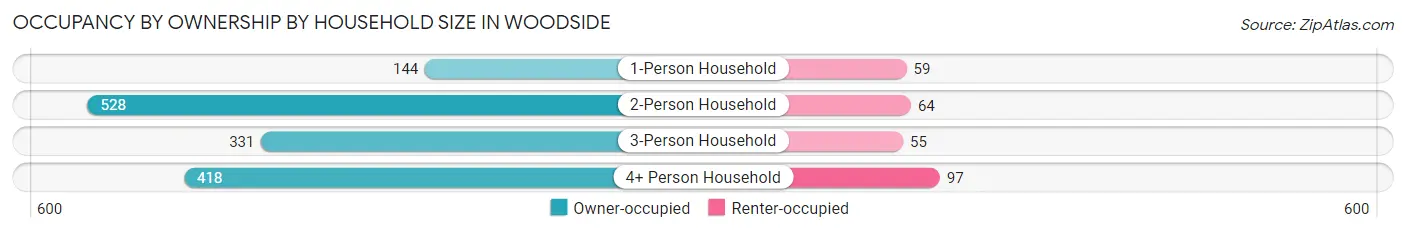
| Household Size | Owner-occupied | Renter-occupied |
| 1-Person Household | 144 (70.9%) | 59 (29.1%) |
| 2-Person Household | 528 (89.2%) | 64 (10.8%) |
| 3-Person Household | 331 (85.8%) | 55 (14.2%) |
| 4+ Person Household | 418 (81.2%) | 97 (18.8%) |
| Total Housing Units | 1,421 (83.8%) | 275 (16.2%) |
Occupancy by Educational Attainment in Woodside
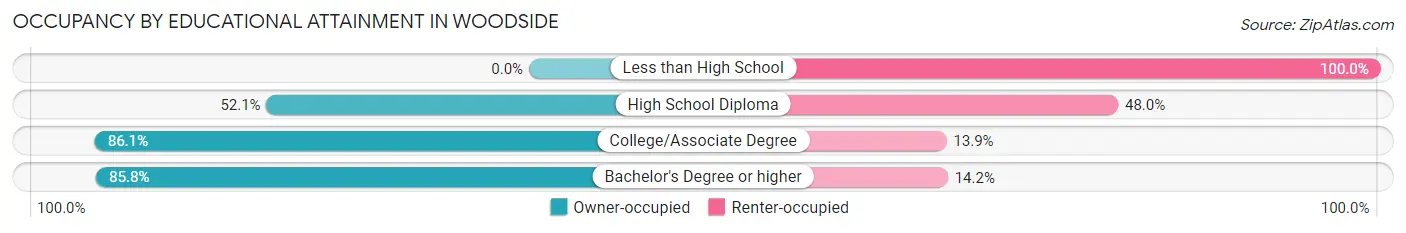
| Household Size | Owner-occupied | Renter-occupied |
| Less than High School | 0 (0.0%) | 12 (100.0%) |
| High School Diploma | 38 (52.0%) | 35 (47.9%) |
| College/Associate Degree | 210 (86.1%) | 34 (13.9%) |
| Bachelor's Degree or higher | 1,173 (85.8%) | 194 (14.2%) |
Occupancy by Age of Householder in Woodside
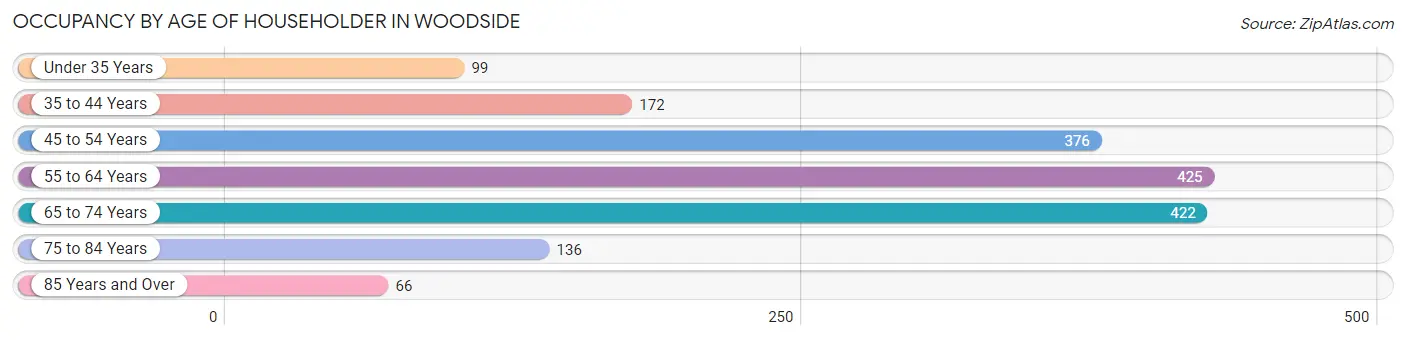
| Age Bracket | # Households | % Households |
| Under 35 Years | 99 | 5.8% |
| 35 to 44 Years | 172 | 10.1% |
| 45 to 54 Years | 376 | 22.2% |
| 55 to 64 Years | 425 | 25.1% |
| 65 to 74 Years | 422 | 24.9% |
| 75 to 84 Years | 136 | 8.0% |
| 85 Years and Over | 66 | 3.9% |
| Total | 1,696 | 100.0% |
Housing Finances in Woodside
Median Income by Occupancy in Woodside
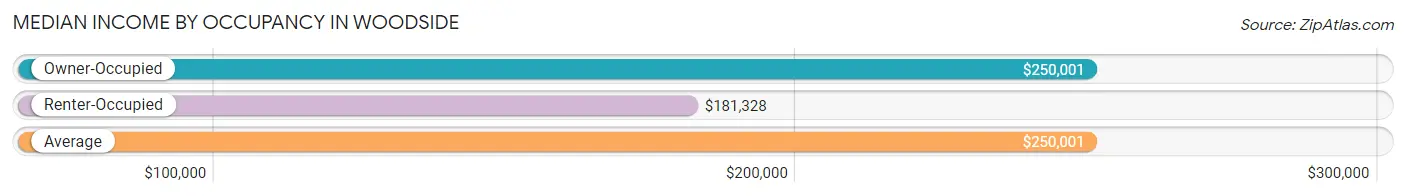
| Occupancy Type | # Households | Median Income |
| Owner-Occupied | 1,421 (83.8%) | $250,001 |
| Renter-Occupied | 275 (16.2%) | $181,328 |
| Average | 1,696 (100.0%) | $250,001 |
Occupancy by Householder Income Bracket in Woodside
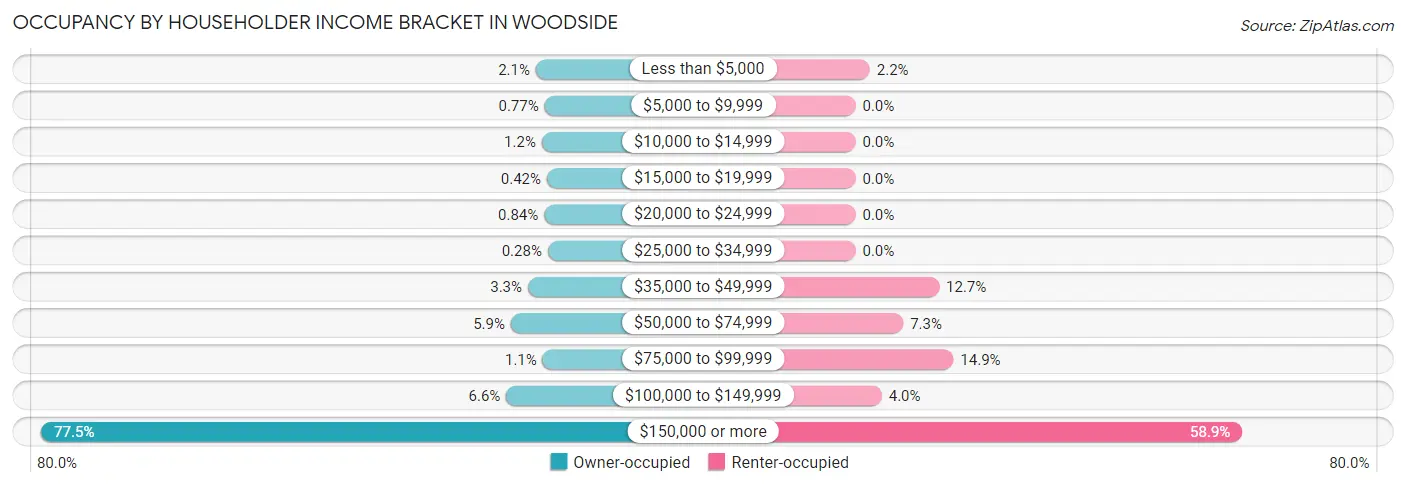
| Income Bracket | Owner-occupied | Renter-occupied |
| Less than $5,000 | 30 (2.1%) | 6 (2.2%) |
| $5,000 to $9,999 | 11 (0.8%) | 0 (0.0%) |
| $10,000 to $14,999 | 17 (1.2%) | 0 (0.0%) |
| $15,000 to $19,999 | 6 (0.4%) | 0 (0.0%) |
| $20,000 to $24,999 | 12 (0.8%) | 0 (0.0%) |
| $25,000 to $34,999 | 4 (0.3%) | 0 (0.0%) |
| $35,000 to $49,999 | 47 (3.3%) | 35 (12.7%) |
| $50,000 to $74,999 | 84 (5.9%) | 20 (7.3%) |
| $75,000 to $99,999 | 15 (1.1%) | 41 (14.9%) |
| $100,000 to $149,999 | 94 (6.6%) | 11 (4.0%) |
| $150,000 or more | 1,101 (77.5%) | 162 (58.9%) |
| Total | 1,421 (100.0%) | 275 (100.0%) |
Monthly Housing Cost Tiers in Woodside
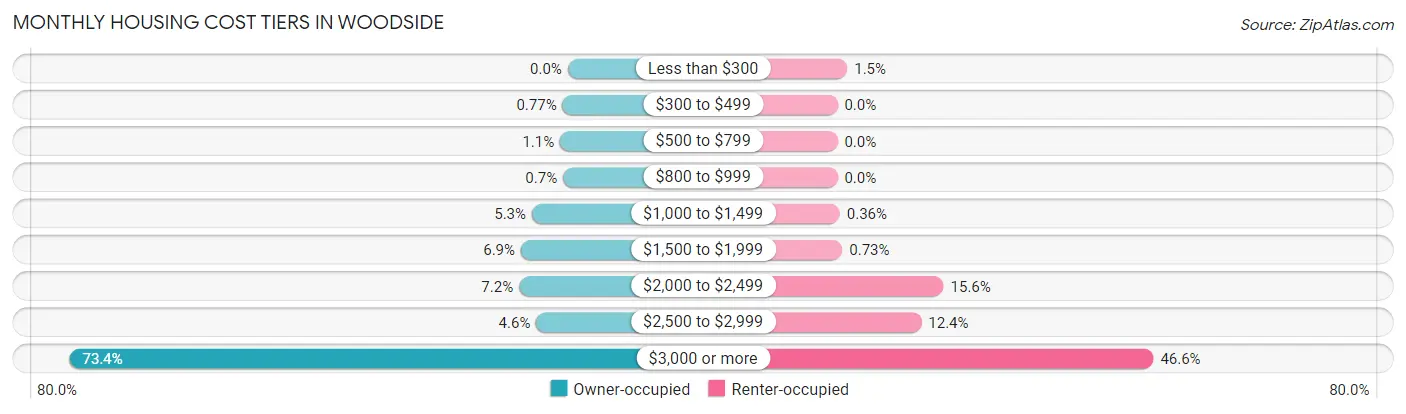
| Monthly Cost | Owner-occupied | Renter-occupied |
| Less than $300 | 0 (0.0%) | 4 (1.5%) |
| $300 to $499 | 11 (0.8%) | 0 (0.0%) |
| $500 to $799 | 16 (1.1%) | 0 (0.0%) |
| $800 to $999 | 10 (0.7%) | 0 (0.0%) |
| $1,000 to $1,499 | 75 (5.3%) | 1 (0.4%) |
| $1,500 to $1,999 | 98 (6.9%) | 2 (0.7%) |
| $2,000 to $2,499 | 102 (7.2%) | 43 (15.6%) |
| $2,500 to $2,999 | 66 (4.6%) | 34 (12.4%) |
| $3,000 or more | 1,043 (73.4%) | 128 (46.6%) |
| Total | 1,421 (100.0%) | 275 (100.0%) |
Physical Housing Characteristics in Woodside
Housing Structures in Woodside
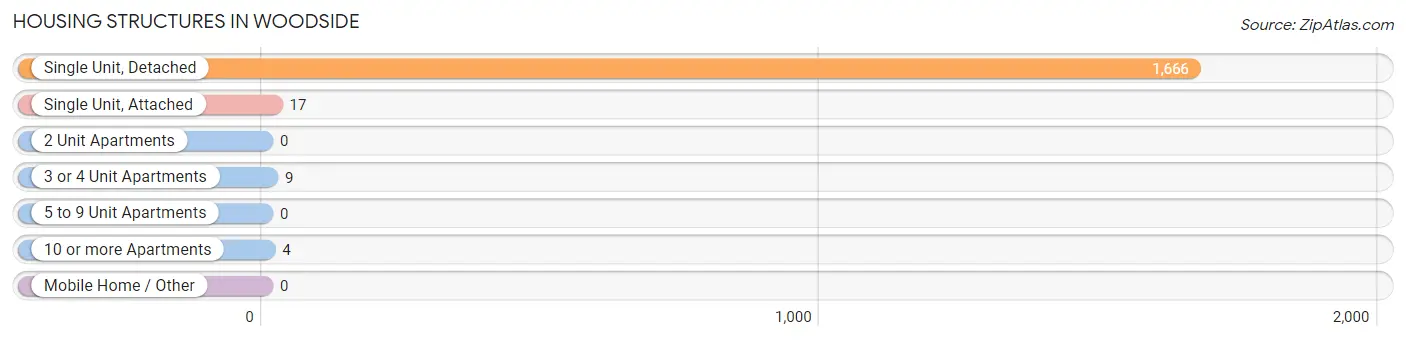
| Structure Type | # Housing Units | % Housing Units |
| Single Unit, Detached | 1,666 | 98.2% |
| Single Unit, Attached | 17 | 1.0% |
| 2 Unit Apartments | 0 | 0.0% |
| 3 or 4 Unit Apartments | 9 | 0.5% |
| 5 to 9 Unit Apartments | 0 | 0.0% |
| 10 or more Apartments | 4 | 0.2% |
| Mobile Home / Other | 0 | 0.0% |
| Total | 1,696 | 100.0% |
Housing Structures by Occupancy in Woodside
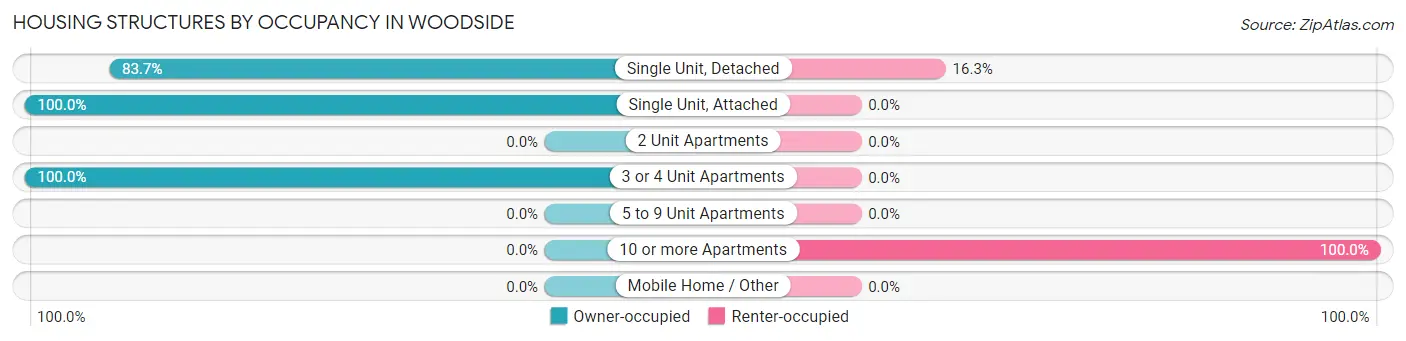
| Structure Type | Owner-occupied | Renter-occupied |
| Single Unit, Detached | 1,395 (83.7%) | 271 (16.3%) |
| Single Unit, Attached | 17 (100.0%) | 0 (0.0%) |
| 2 Unit Apartments | 0 (0.0%) | 0 (0.0%) |
| 3 or 4 Unit Apartments | 9 (100.0%) | 0 (0.0%) |
| 5 to 9 Unit Apartments | 0 (0.0%) | 0 (0.0%) |
| 10 or more Apartments | 0 (0.0%) | 4 (100.0%) |
| Mobile Home / Other | 0 (0.0%) | 0 (0.0%) |
| Total | 1,421 (83.8%) | 275 (16.2%) |
Housing Structures by Number of Rooms in Woodside
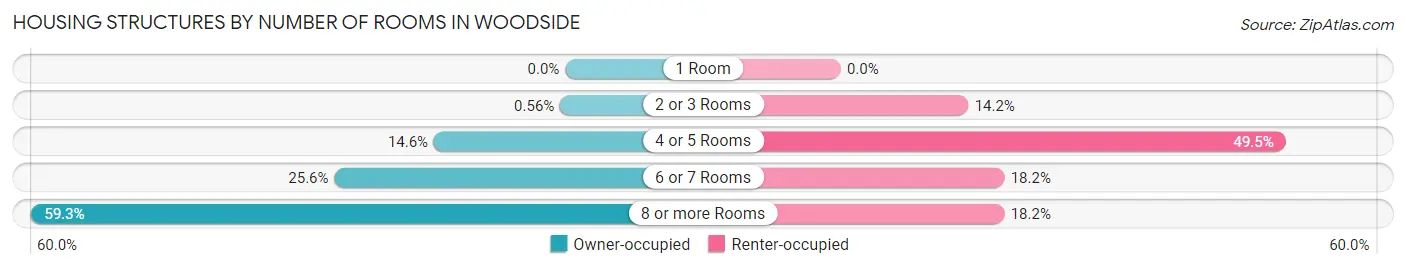
| Number of Rooms | Owner-occupied | Renter-occupied |
| 1 Room | 0 (0.0%) | 0 (0.0%) |
| 2 or 3 Rooms | 8 (0.6%) | 39 (14.2%) |
| 4 or 5 Rooms | 207 (14.6%) | 136 (49.4%) |
| 6 or 7 Rooms | 364 (25.6%) | 50 (18.2%) |
| 8 or more Rooms | 842 (59.3%) | 50 (18.2%) |
| Total | 1,421 (100.0%) | 275 (100.0%) |
Housing Structure by Heating Type in Woodside
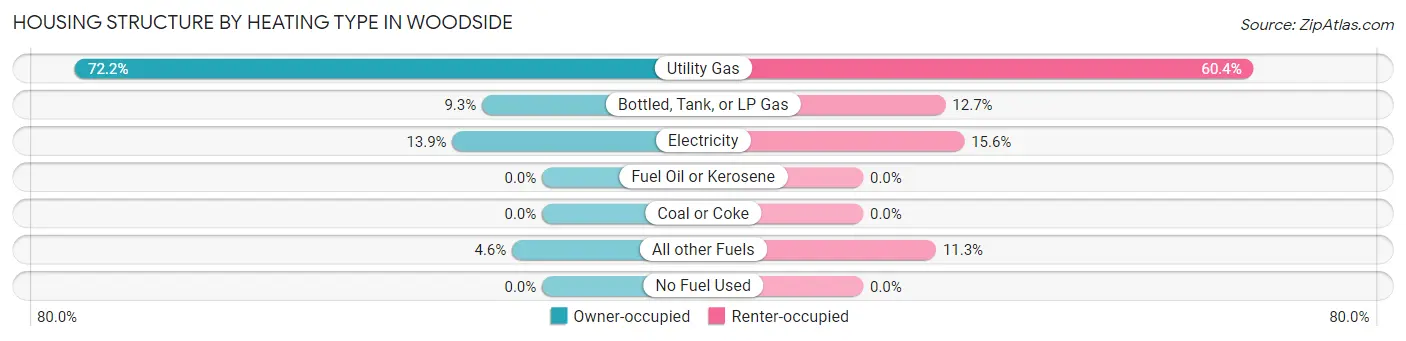
| Heating Type | Owner-occupied | Renter-occupied |
| Utility Gas | 1,026 (72.2%) | 166 (60.4%) |
| Bottled, Tank, or LP Gas | 132 (9.3%) | 35 (12.7%) |
| Electricity | 197 (13.9%) | 43 (15.6%) |
| Fuel Oil or Kerosene | 0 (0.0%) | 0 (0.0%) |
| Coal or Coke | 0 (0.0%) | 0 (0.0%) |
| All other Fuels | 66 (4.6%) | 31 (11.3%) |
| No Fuel Used | 0 (0.0%) | 0 (0.0%) |
| Total | 1,421 (100.0%) | 275 (100.0%) |
Household Vehicle Usage in Woodside
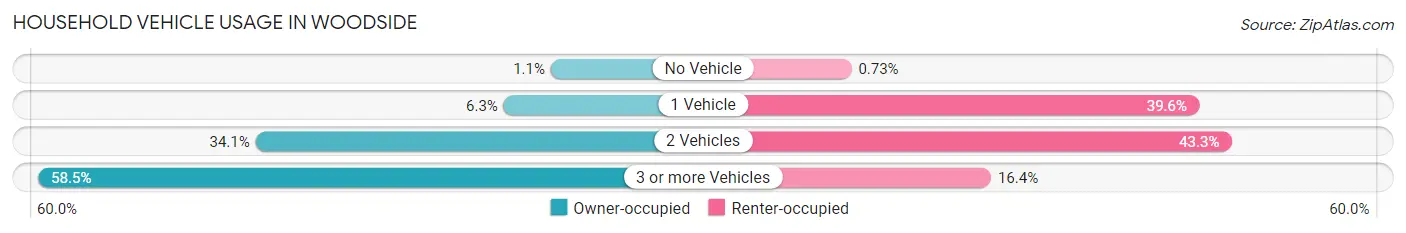
| Vehicles per Household | Owner-occupied | Renter-occupied |
| No Vehicle | 15 (1.1%) | 2 (0.7%) |
| 1 Vehicle | 90 (6.3%) | 109 (39.6%) |
| 2 Vehicles | 485 (34.1%) | 119 (43.3%) |
| 3 or more Vehicles | 831 (58.5%) | 45 (16.4%) |
| Total | 1,421 (100.0%) | 275 (100.0%) |
Real Estate & Mortgages in Woodside
Real Estate and Mortgage Overview in Woodside
| Characteristic | Without Mortgage | With Mortgage |
| Housing Units | 538 | 883 |
| Median Property Value | $2,000,001 | $2,000,001 |
| Median Household Income | $250,001 | $691 |
| Monthly Housing Costs | $1,501 | $845 |
| Real Estate Taxes | $10,001 | $0 |
Property Value by Mortgage Status in Woodside
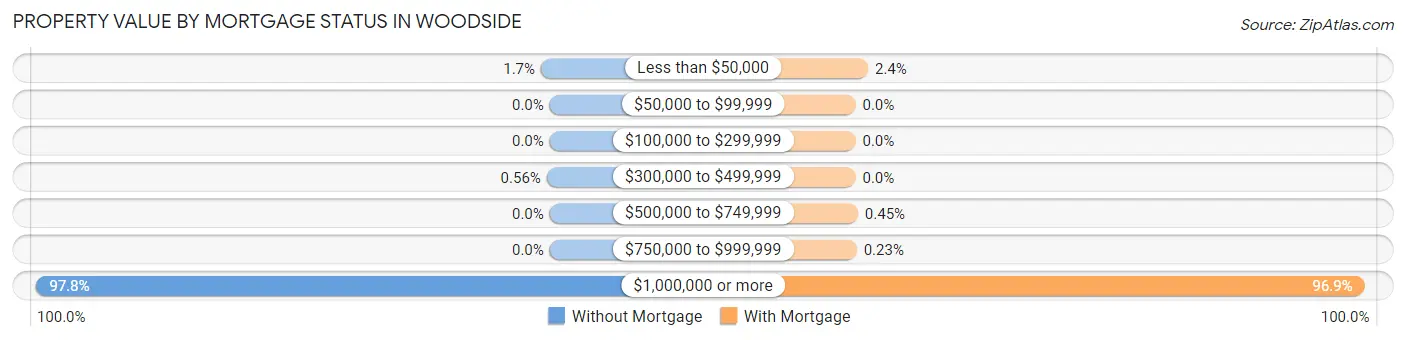
| Property Value | Without Mortgage | With Mortgage |
| Less than $50,000 | 9 (1.7%) | 21 (2.4%) |
| $50,000 to $99,999 | 0 (0.0%) | 0 (0.0%) |
| $100,000 to $299,999 | 0 (0.0%) | 0 (0.0%) |
| $300,000 to $499,999 | 3 (0.6%) | 0 (0.0%) |
| $500,000 to $749,999 | 0 (0.0%) | 4 (0.4%) |
| $750,000 to $999,999 | 0 (0.0%) | 2 (0.2%) |
| $1,000,000 or more | 526 (97.8%) | 856 (96.9%) |
| Total | 538 (100.0%) | 883 (100.0%) |
Household Income by Mortgage Status in Woodside
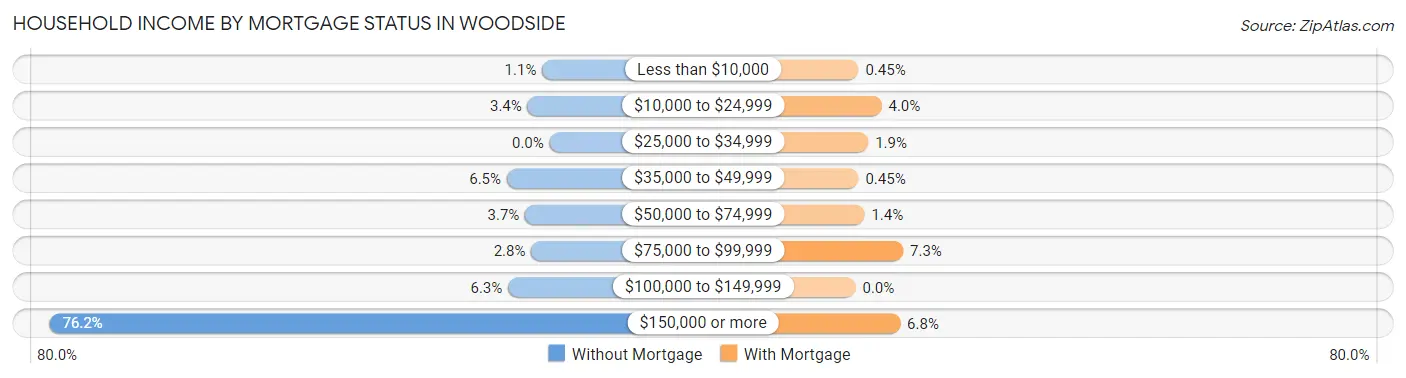
| Household Income | Without Mortgage | With Mortgage |
| Less than $10,000 | 6 (1.1%) | 4 (0.4%) |
| $10,000 to $24,999 | 18 (3.4%) | 35 (4.0%) |
| $25,000 to $34,999 | 0 (0.0%) | 17 (1.9%) |
| $35,000 to $49,999 | 35 (6.5%) | 4 (0.4%) |
| $50,000 to $74,999 | 20 (3.7%) | 12 (1.4%) |
| $75,000 to $99,999 | 15 (2.8%) | 64 (7.2%) |
| $100,000 to $149,999 | 34 (6.3%) | 0 (0.0%) |
| $150,000 or more | 410 (76.2%) | 60 (6.8%) |
| Total | 538 (100.0%) | 883 (100.0%) |
Property Value to Household Income Ratio in Woodside
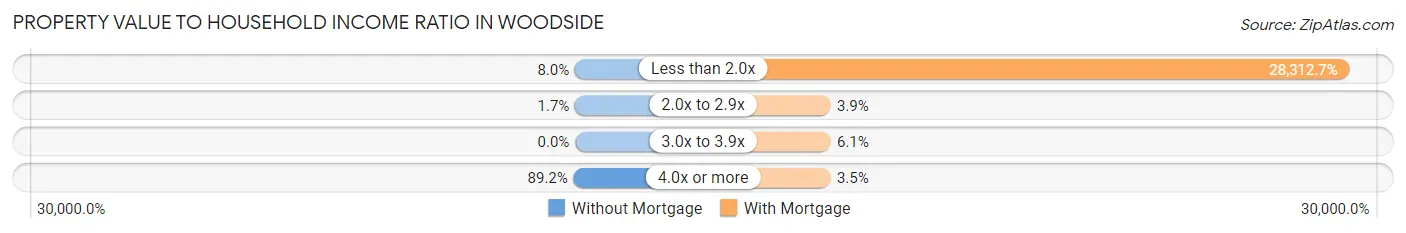
| Value-to-Income Ratio | Without Mortgage | With Mortgage |
| Less than 2.0x | 43 (8.0%) | 250,001 (28,312.7%) |
| 2.0x to 2.9x | 9 (1.7%) | 34 (3.8%) |
| 3.0x to 3.9x | 0 (0.0%) | 54 (6.1%) |
| 4.0x or more | 480 (89.2%) | 31 (3.5%) |
| Total | 538 (100.0%) | 883 (100.0%) |
Real Estate Taxes by Mortgage Status in Woodside
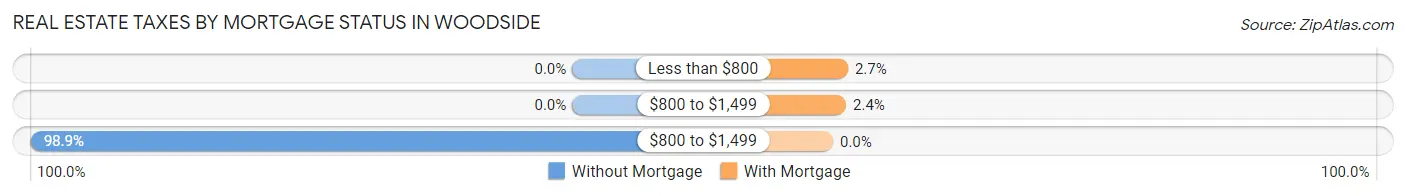
| Property Taxes | Without Mortgage | With Mortgage |
| Less than $800 | 0 (0.0%) | 24 (2.7%) |
| $800 to $1,499 | 0 (0.0%) | 21 (2.4%) |
| $800 to $1,499 | 532 (98.9%) | 0 (0.0%) |
| Total | 538 (100.0%) | 883 (100.0%) |
Health & Disability in Woodside
Health Insurance Coverage by Age in Woodside
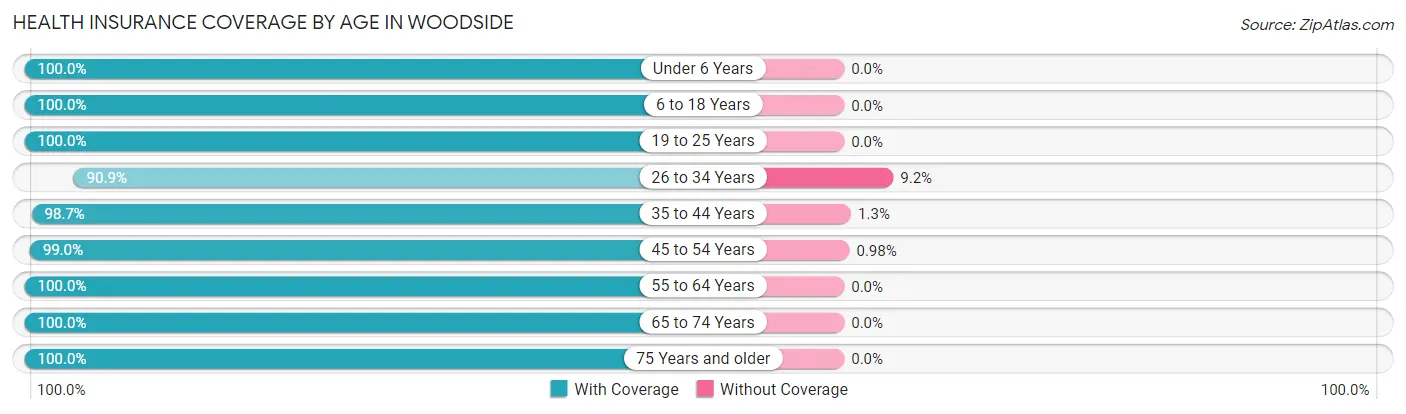
| Age Bracket | With Coverage | Without Coverage |
| Under 6 Years | 249 (100.0%) | 0 (0.0%) |
| 6 to 18 Years | 1,035 (100.0%) | 0 (0.0%) |
| 19 to 25 Years | 384 (100.0%) | 0 (0.0%) |
| 26 to 34 Years | 387 (90.8%) | 39 (9.1%) |
| 35 to 44 Years | 464 (98.7%) | 6 (1.3%) |
| 45 to 54 Years | 705 (99.0%) | 7 (1.0%) |
| 55 to 64 Years | 879 (100.0%) | 0 (0.0%) |
| 65 to 74 Years | 661 (100.0%) | 0 (0.0%) |
| 75 Years and older | 440 (100.0%) | 0 (0.0%) |
| Total | 5,204 (99.0%) | 52 (1.0%) |
Health Insurance Coverage by Citizenship Status in Woodside
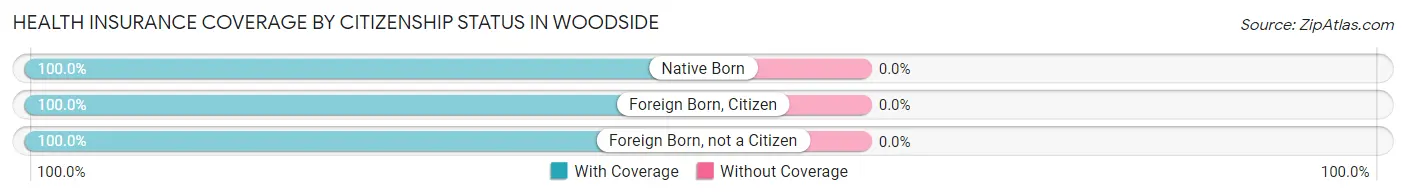
| Citizenship Status | With Coverage | Without Coverage |
| Native Born | 249 (100.0%) | 0 (0.0%) |
| Foreign Born, Citizen | 1,035 (100.0%) | 0 (0.0%) |
| Foreign Born, not a Citizen | 384 (100.0%) | 0 (0.0%) |
Health Insurance Coverage by Household Income in Woodside
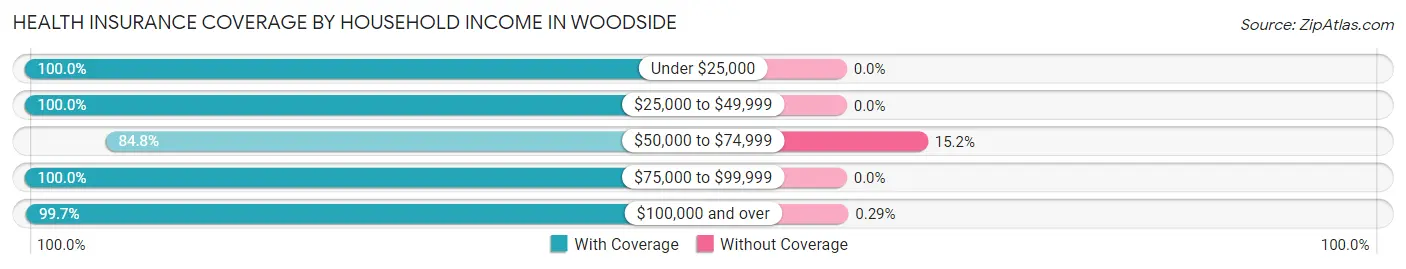
| Household Income | With Coverage | Without Coverage |
| Under $25,000 | 226 (100.0%) | 0 (0.0%) |
| $25,000 to $49,999 | 201 (100.0%) | 0 (0.0%) |
| $50,000 to $74,999 | 218 (84.8%) | 39 (15.2%) |
| $75,000 to $99,999 | 128 (100.0%) | 0 (0.0%) |
| $100,000 and over | 4,431 (99.7%) | 13 (0.3%) |
Public vs Private Health Insurance Coverage by Age in Woodside
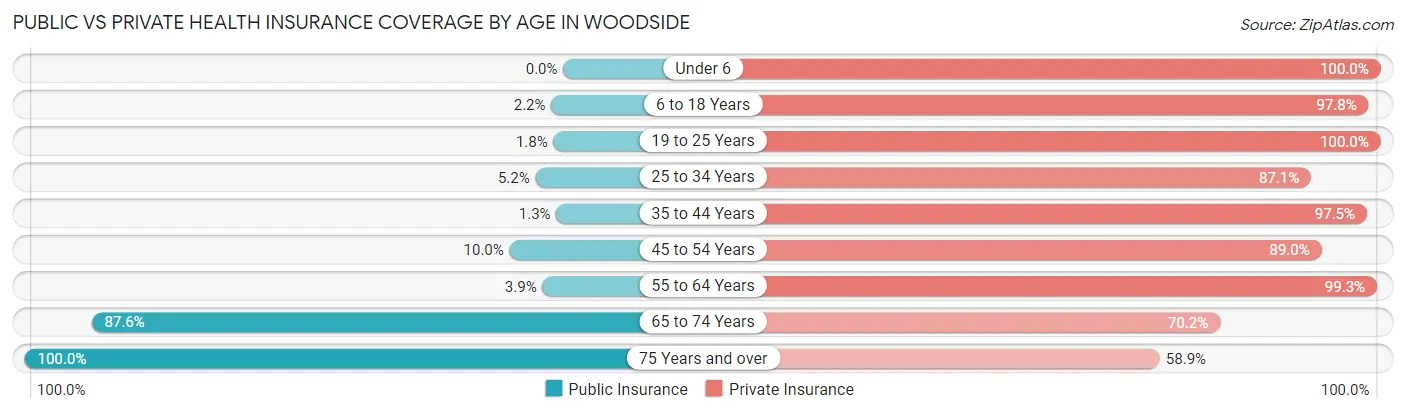
| Age Bracket | Public Insurance | Private Insurance |
| Under 6 | 0 (0.0%) | 249 (100.0%) |
| 6 to 18 Years | 23 (2.2%) | 1,012 (97.8%) |
| 19 to 25 Years | 7 (1.8%) | 384 (100.0%) |
| 25 to 34 Years | 22 (5.2%) | 371 (87.1%) |
| 35 to 44 Years | 6 (1.3%) | 458 (97.5%) |
| 45 to 54 Years | 71 (10.0%) | 634 (89.0%) |
| 55 to 64 Years | 34 (3.9%) | 873 (99.3%) |
| 65 to 74 Years | 579 (87.6%) | 464 (70.2%) |
| 75 Years and over | 440 (100.0%) | 259 (58.9%) |
| Total | 1,182 (22.5%) | 4,704 (89.5%) |
Disability Status by Sex by Age in Woodside
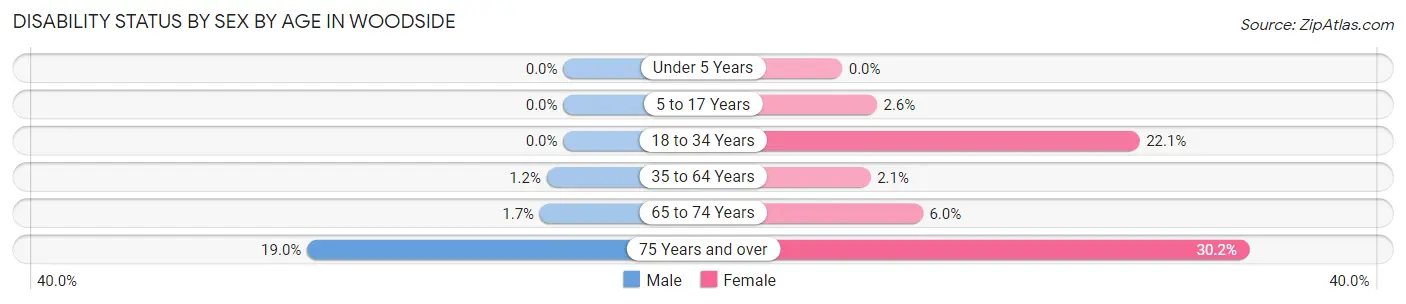
| Age Bracket | Male | Female |
| Under 5 Years | 0 (0.0%) | 0 (0.0%) |
| 5 to 17 Years | 0 (0.0%) | 15 (2.6%) |
| 18 to 34 Years | 0 (0.0%) | 119 (22.1%) |
| 35 to 64 Years | 12 (1.2%) | 23 (2.1%) |
| 65 to 74 Years | 6 (1.7%) | 19 (6.0%) |
| 75 Years and over | 39 (19.0%) | 71 (30.2%) |
Disability Class by Sex by Age in Woodside
Disability Class: Hearing Difficulty
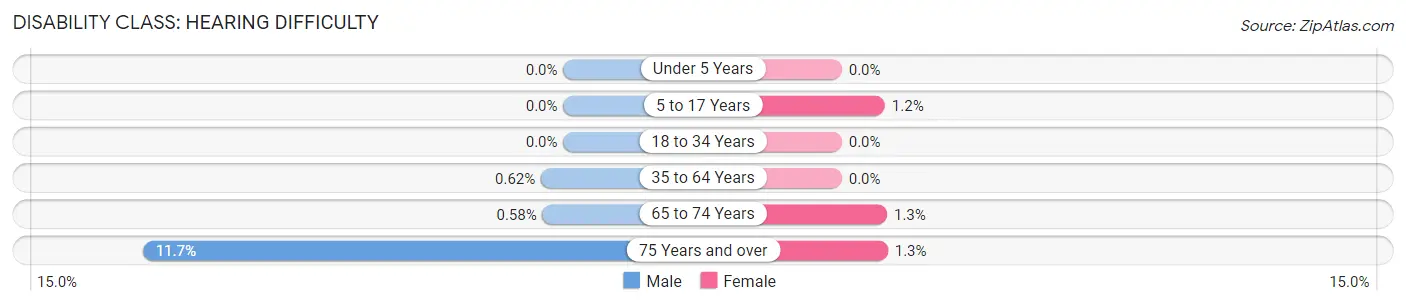
| Age Bracket | Male | Female |
| Under 5 Years | 0 (0.0%) | 0 (0.0%) |
| 5 to 17 Years | 0 (0.0%) | 7 (1.2%) |
| 18 to 34 Years | 0 (0.0%) | 0 (0.0%) |
| 35 to 64 Years | 6 (0.6%) | 0 (0.0%) |
| 65 to 74 Years | 2 (0.6%) | 4 (1.3%) |
| 75 Years and over | 24 (11.7%) | 3 (1.3%) |
Disability Class: Vision Difficulty
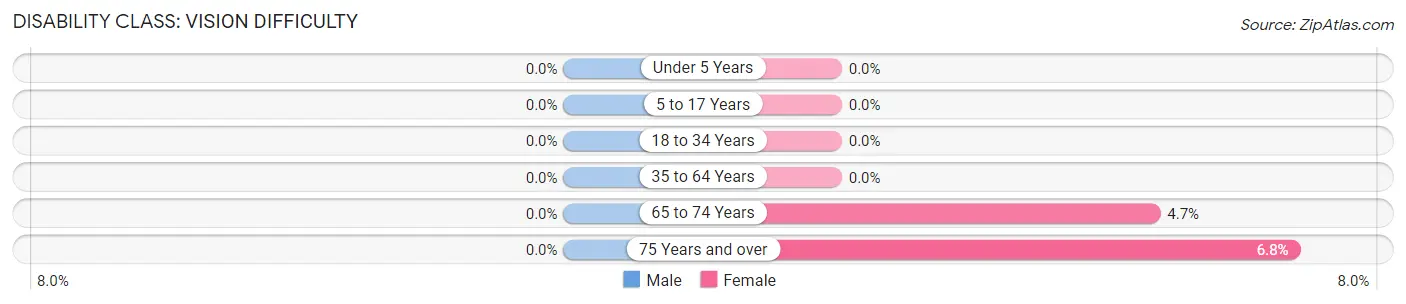
| Age Bracket | Male | Female |
| Under 5 Years | 0 (0.0%) | 0 (0.0%) |
| 5 to 17 Years | 0 (0.0%) | 0 (0.0%) |
| 18 to 34 Years | 0 (0.0%) | 0 (0.0%) |
| 35 to 64 Years | 0 (0.0%) | 0 (0.0%) |
| 65 to 74 Years | 0 (0.0%) | 15 (4.7%) |
| 75 Years and over | 0 (0.0%) | 16 (6.8%) |
Disability Class: Cognitive Difficulty
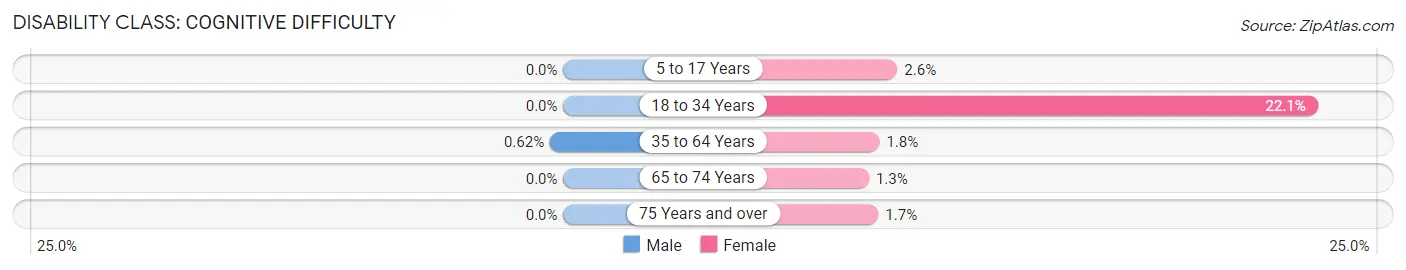
| Age Bracket | Male | Female |
| 5 to 17 Years | 0 (0.0%) | 15 (2.6%) |
| 18 to 34 Years | 0 (0.0%) | 119 (22.1%) |
| 35 to 64 Years | 6 (0.6%) | 19 (1.8%) |
| 65 to 74 Years | 0 (0.0%) | 4 (1.3%) |
| 75 Years and over | 0 (0.0%) | 4 (1.7%) |
Disability Class: Ambulatory Difficulty
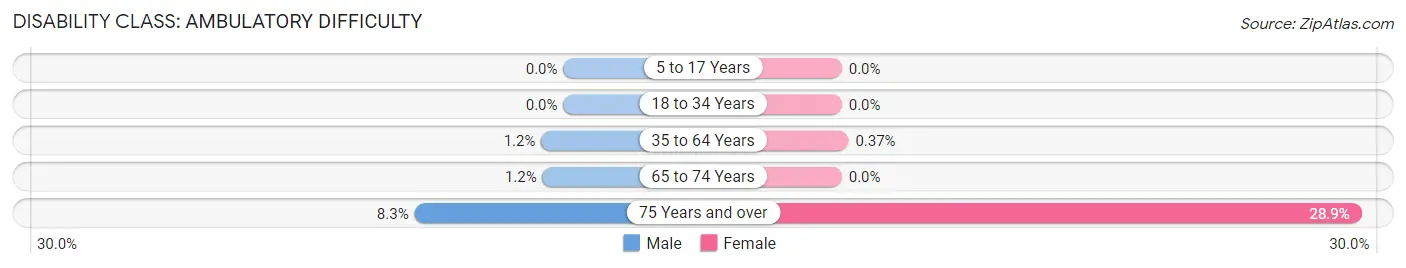
| Age Bracket | Male | Female |
| 5 to 17 Years | 0 (0.0%) | 0 (0.0%) |
| 18 to 34 Years | 0 (0.0%) | 0 (0.0%) |
| 35 to 64 Years | 12 (1.2%) | 4 (0.4%) |
| 65 to 74 Years | 4 (1.2%) | 0 (0.0%) |
| 75 Years and over | 17 (8.3%) | 68 (28.9%) |
Disability Class: Self-Care Difficulty
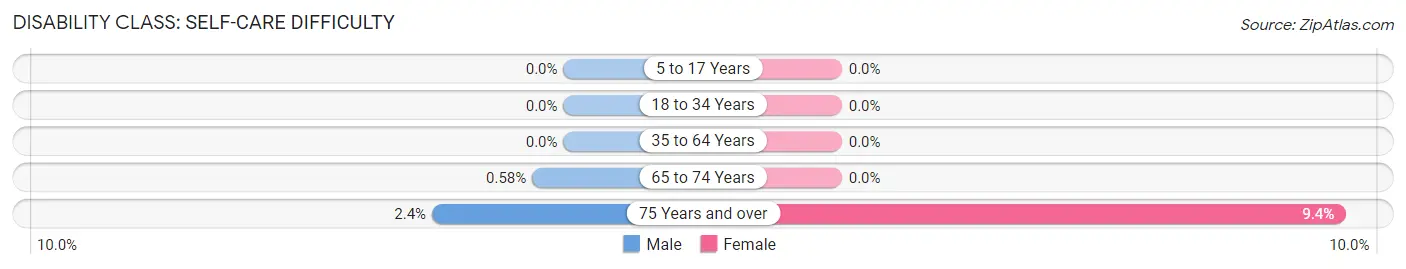
| Age Bracket | Male | Female |
| 5 to 17 Years | 0 (0.0%) | 0 (0.0%) |
| 18 to 34 Years | 0 (0.0%) | 0 (0.0%) |
| 35 to 64 Years | 0 (0.0%) | 0 (0.0%) |
| 65 to 74 Years | 2 (0.6%) | 0 (0.0%) |
| 75 Years and over | 5 (2.4%) | 22 (9.4%) |
Technology Access in Woodside
Computing Device Access in Woodside
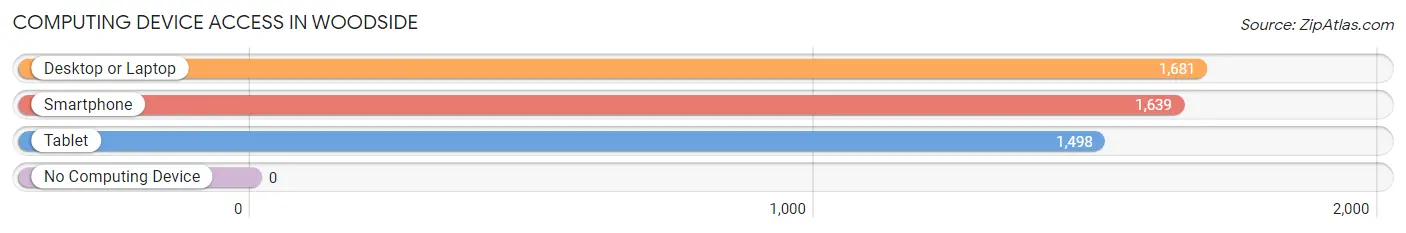
| Device Type | # Households | % Households |
| Desktop or Laptop | 1,681 | 99.1% |
| Smartphone | 1,639 | 96.6% |
| Tablet | 1,498 | 88.3% |
| No Computing Device | 0 | 0.0% |
| Total | 1,696 | 100.0% |
Internet Access in Woodside
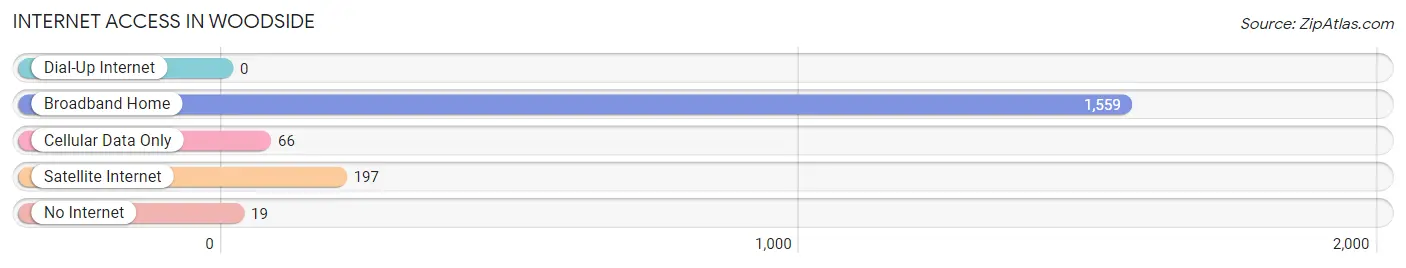
| Internet Type | # Households | % Households |
| Dial-Up Internet | 0 | 0.0% |
| Broadband Home | 1,559 | 91.9% |
| Cellular Data Only | 66 | 3.9% |
| Satellite Internet | 197 | 11.6% |
| No Internet | 19 | 1.1% |
| Total | 1,696 | 100.0% |
Woodside Summary
Woodside, California is a small town located in San Mateo County, California, United States. It is situated in the foothills of the Santa Cruz Mountains, about 20 miles south of San Francisco. The town has a population of about 5,287 people, according to the 2010 census.
Geography
Woodside is located at 37°25'N 122°12'W, at an elevation of about 500 feet. It is situated in the foothills of the Santa Cruz Mountains, about 20 miles south of San Francisco. The town is surrounded by the towns of Portola Valley, Redwood City, and Atherton. The town is located in the San Francisco Bay Area, and is part of the San Francisco-Oakland-Hayward metropolitan area.
History
Woodside was originally inhabited by the Ohlone people, who were the first inhabitants of the area. The first European settlers arrived in the area in the mid-1800s, and the town was officially founded in 1854. The town was named after the many trees in the area, and was originally a logging town. In the early 1900s, the town began to develop into a residential community, and by the 1950s, it had become a wealthy suburb of San Francisco.
Economy
Woodside is a wealthy town, and its economy is largely based on the technology industry. Many of the town's residents are employed in the tech industry, and the town is home to several tech companies, including Oracle, Google, and Facebook. The town is also home to several venture capital firms, and is a popular destination for entrepreneurs and start-ups.
The town is also home to several horse ranches, and is a popular destination for horseback riding. The town is also home to several wineries, and is a popular destination for wine tasting.
Demographics
As of the 2010 census, the population of Woodside was 5,287. The racial makeup of the town was 79.2% White, 0.7% African American, 0.2% Native American, 13.3% Asian, 0.1% Pacific Islander, 4.2% from other races, and 2.3% from two or more races. The median household income was $170,944, and the median family income was $192,857.
Conclusion
Woodside, California is a small town located in San Mateo County, California, United States. It is situated in the foothills of the Santa Cruz Mountains, about 20 miles south of San Francisco. The town has a population of about 5,287 people, according to the 2010 census. The town is largely based on the technology industry, and is home to several tech companies, venture capital firms, horse ranches, and wineries. The town has a median household income of $170,944, and a median family income of $192,857.
Common Questions
What is Per Capita Income in Woodside?
Per Capita income in Woodside is $146,296.
What is the Median Family Income in Woodside?
Median Family Income in Woodside is $250,001.
What is the Median Household income in Woodside?
Median Household Income in Woodside is $250,001.
What is Income or Wage Gap in Woodside?
Income or Wage Gap in Woodside is 51.2%.
Women in Woodside earn 48.8 cents for every dollar earned by a man.
What is Inequality or Gini Index in Woodside?
Inequality or Gini Index in Woodside is 0.49.
What is the Total Population of Woodside?
Total Population of Woodside is 5,256.
What is the Total Male Population of Woodside?
Total Male Population of Woodside is 2,403.
What is the Total Female Population of Woodside?
Total Female Population of Woodside is 2,853.
What is the Ratio of Males per 100 Females in Woodside?
There are 84.23 Males per 100 Females in Woodside.
What is the Ratio of Females per 100 Males in Woodside?
There are 118.73 Females per 100 Males in Woodside.
What is the Median Population Age in Woodside?
Median Population Age in Woodside is 46.4 Years.
What is the Average Family Size in Woodside
Average Family Size in Woodside is 3.3 People.
What is the Average Household Size in Woodside
Average Household Size in Woodside is 3.1 People.
How Large is the Labor Force in Woodside?
There are 2,518 People in the Labor Forcein in Woodside.
What is the Percentage of People in the Labor Force in Woodside?
60.1% of People are in the Labor Force in Woodside.
What is the Unemployment Rate in Woodside?
Unemployment Rate in Woodside is 4.5%.