Cities with the Highest Percentage of Families with Income Above $200,000 in South Carolina
RELATED REPORTS & OPTIONS
Family Income | $200k+
South Carolina
Compare Cities
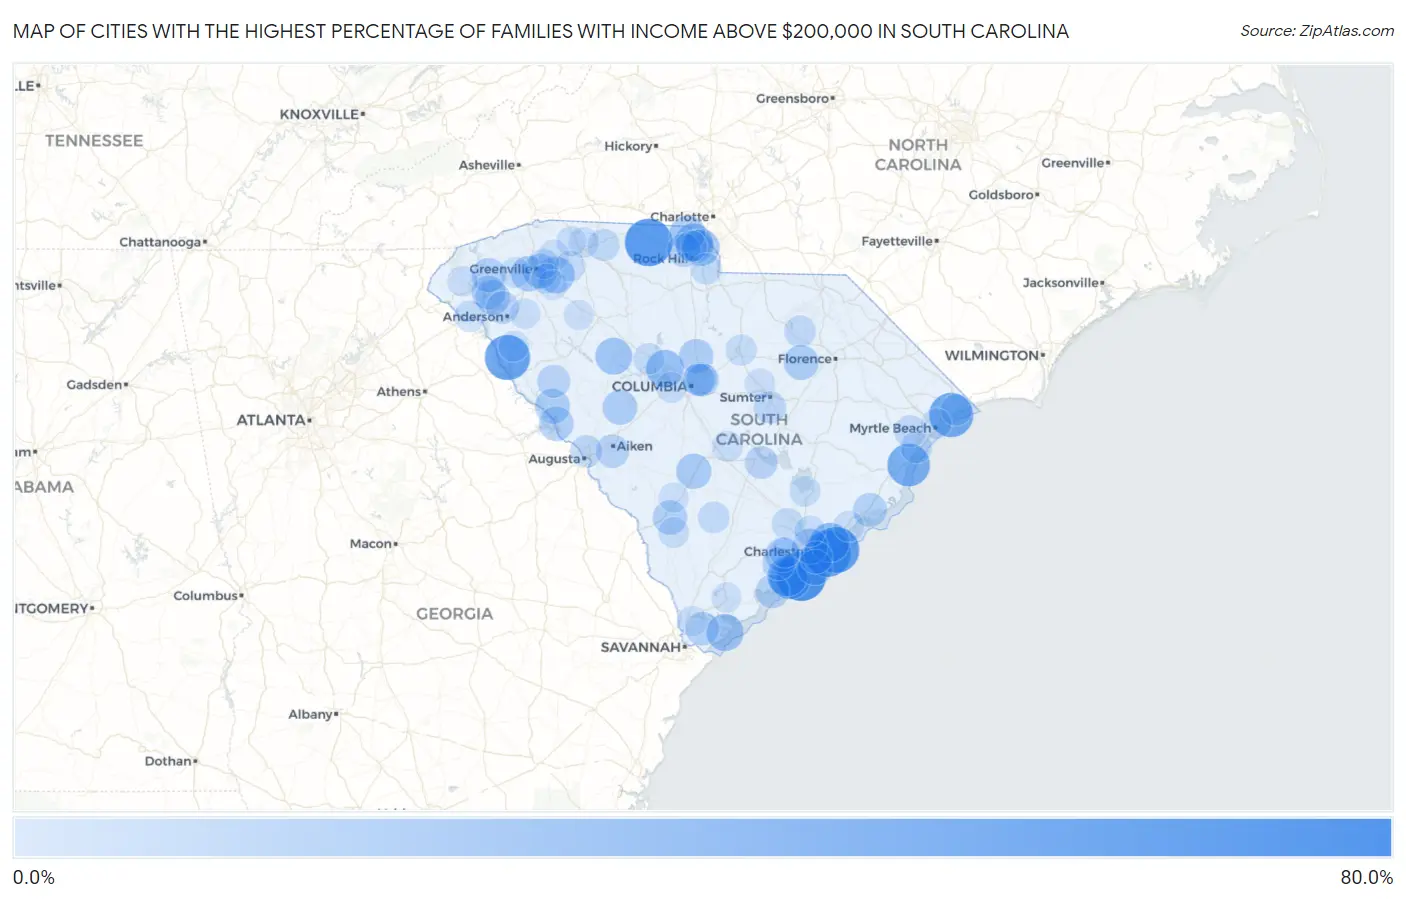
Map of Cities with the Highest Percentage of Families with Income Above $200,000 in South Carolina
0.0%
80.0%
Cities with the Highest Percentage of Families with Income Above $200,000 in South Carolina
| City | Families with Income > $200k | vs State | vs National | |
| 1. | Debordieu Colony | 61.5% | 9.8%(+51.7)#1 | 14.8%(+46.7)#356 |
| 2. | Kiawah Island | 60.9% | 9.8%(+51.1)#2 | 14.8%(+46.1)#383 |
| 3. | Smyrna | 55.6% | 9.8%(+45.8)#3 | 14.8%(+40.8)#560 |
| 4. | Sullivan S Island | 52.2% | 9.8%(+42.4)#4 | 14.8%(+37.4)#699 |
| 5. | Isle Of Palms | 51.5% | 9.8%(+41.7)#5 | 14.8%(+36.7)#729 |
| 6. | Lowndesville | 49.1% | 9.8%(+39.3)#6 | 14.8%(+34.3)#839 |
| 7. | Briarcliffe Acres | 46.2% | 9.8%(+36.4)#7 | 14.8%(+31.4)#984 |
| 8. | Pawleys Island | 42.1% | 9.8%(+32.3)#8 | 14.8%(+27.3)#1,252 |
| 9. | Seabrook Island | 37.1% | 9.8%(+27.3)#9 | 14.8%(+22.3)#1,646 |
| 10. | Pimlico | 36.2% | 9.8%(+26.4)#10 | 14.8%(+21.4)#1,728 |
| 11. | Rockville | 35.1% | 9.8%(+25.3)#11 | 14.8%(+20.3)#1,837 |
| 12. | Mount Pleasant | 33.0% | 9.8%(+23.2)#12 | 14.8%(+18.2)#2,039 |
| 13. | Baxter | 29.9% | 9.8%(+20.1)#13 | 14.8%(+15.1)#2,380 |
| 14. | Lake Murray Of Richland | 29.0% | 9.8%(+19.2)#14 | 14.8%(+14.2)#2,499 |
| 15. | Tega Cay | 28.3% | 9.8%(+18.5)#15 | 14.8%(+13.5)#2,607 |
| 16. | Hilton Head Island | 27.2% | 9.8%(+17.4)#16 | 14.8%(+12.4)#2,778 |
| 17. | The Cliffs Valley | 27.2% | 9.8%(+17.4)#17 | 14.8%(+12.4)#2,787 |
| 18. | Five Forks | 26.4% | 9.8%(+16.6)#18 | 14.8%(+11.6)#2,884 |
| 19. | Silverstreet | 26.3% | 9.8%(+16.5)#19 | 14.8%(+11.5)#2,905 |
| 20. | Fort Mill | 26.0% | 9.8%(+16.2)#20 | 14.8%(+11.2)#2,941 |
| 21. | Lake Wylie | 24.3% | 9.8%(+14.5)#21 | 14.8%(+9.50)#3,234 |
| 22. | Welcome | 23.0% | 9.8%(+13.2)#22 | 14.8%(+8.20)#3,458 |
| 23. | Charleston | 22.8% | 9.8%(+13.0)#23 | 14.8%(+8.00)#3,488 |
| 24. | Folly Beach | 22.8% | 9.8%(+13.0)#24 | 14.8%(+8.00)#3,503 |
| 25. | Cope | 22.2% | 9.8%(+12.4)#25 | 14.8%(+7.40)#3,643 |
| 26. | Greenville | 22.0% | 9.8%(+12.2)#26 | 14.8%(+7.20)#3,665 |
| 27. | Lamar | 21.6% | 9.8%(+11.8)#27 | 14.8%(+6.80)#3,761 |
| 28. | Plum Branch | 21.4% | 9.8%(+11.6)#28 | 14.8%(+6.60)#3,808 |
| 29. | Hollywood | 20.9% | 9.8%(+11.1)#29 | 14.8%(+6.10)#3,907 |
| 30. | Ridge Spring | 20.9% | 9.8%(+11.1)#30 | 14.8%(+6.10)#3,916 |
| 31. | Pendleton | 20.7% | 9.8%(+10.9)#31 | 14.8%(+5.90)#3,947 |
| 32. | Blythewood | 20.6% | 9.8%(+10.8)#32 | 14.8%(+5.80)#3,971 |
| 33. | Modoc | 20.5% | 9.8%(+10.7)#33 | 14.8%(+5.70)#3,998 |
| 34. | Daufuskie Island | 20.1% | 9.8%(+10.3)#34 | 14.8%(+5.30)#4,103 |
| 35. | Sycamore | 20.0% | 9.8%(+10.2)#35 | 14.8%(+5.20)#4,136 |
| 36. | Six Mile | 19.4% | 9.8%(+9.60)#36 | 14.8%(+4.60)#4,264 |
| 37. | Clemson | 19.3% | 9.8%(+9.50)#37 | 14.8%(+4.50)#4,275 |
| 38. | Mcclellanville | 19.0% | 9.8%(+9.20)#38 | 14.8%(+4.20)#4,368 |
| 39. | Fripp Island | 18.5% | 9.8%(+8.70)#39 | 14.8%(+3.70)#4,496 |
| 40. | Edisto Beach | 18.2% | 9.8%(+8.40)#40 | 14.8%(+3.40)#4,572 |
| 41. | Newport | 17.9% | 9.8%(+8.10)#41 | 14.8%(+3.10)#4,661 |
| 42. | Bluffton | 17.8% | 9.8%(+8.00)#42 | 14.8%(+3.00)#4,686 |
| 43. | Keowee Key | 17.5% | 9.8%(+7.70)#43 | 14.8%(+2.70)#4,804 |
| 44. | Arcadia Lakes | 17.5% | 9.8%(+7.70)#44 | 14.8%(+2.70)#4,810 |
| 45. | Aiken | 17.3% | 9.8%(+7.50)#45 | 14.8%(+2.50)#4,858 |
| 46. | Riverview | 16.5% | 9.8%(+6.70)#46 | 14.8%(+1.70)#5,114 |
| 47. | Meggett | 16.3% | 9.8%(+6.50)#47 | 14.8%(+1.50)#5,174 |
| 48. | Northlake | 16.1% | 9.8%(+6.30)#48 | 14.8%(+1.30)#5,238 |
| 49. | Bradley | 16.1% | 9.8%(+6.30)#49 | 14.8%(+1.30)#5,256 |
| 50. | Vance | 16.0% | 9.8%(+6.20)#50 | 14.8%(+1.20)#5,292 |
| 51. | Columbia | 15.9% | 9.8%(+6.10)#51 | 14.8%(+1.10)#5,295 |
| 52. | Forest Acres | 15.2% | 9.8%(+5.40)#52 | 14.8%(+0.400)#5,546 |
| 53. | James Island | 14.9% | 9.8%(+5.10)#53 | 14.8%(+0.100)#5,671 |
| 54. | North Augusta | 14.5% | 9.8%(+4.70)#54 | 14.8%(-0.300)#5,812 |
| 55. | Lakewood | 14.4% | 9.8%(+4.60)#55 | 14.8%(-0.400)#5,873 |
| 56. | Bucksport | 13.9% | 9.8%(+4.10)#56 | 14.8%(-0.900)#6,109 |
| 57. | North Hartsville | 13.4% | 9.8%(+3.60)#57 | 14.8%(-1.40)#6,325 |
| 58. | Cowpens | 13.4% | 9.8%(+3.60)#58 | 14.8%(-1.40)#6,336 |
| 59. | Murrells Inlet | 13.2% | 9.8%(+3.40)#59 | 14.8%(-1.60)#6,413 |
| 60. | Williams | 13.0% | 9.8%(+3.20)#60 | 14.8%(-1.80)#6,537 |
| 61. | Summerville | 12.9% | 9.8%(+3.10)#61 | 14.8%(-1.90)#6,547 |
| 62. | North Myrtle Beach | 12.7% | 9.8%(+2.90)#62 | 14.8%(-2.10)#6,650 |
| 63. | Dunbar | 12.6% | 9.8%(+2.80)#63 | 14.8%(-2.20)#6,707 |
| 64. | Catawba | 12.2% | 9.8%(+2.40)#64 | 14.8%(-2.60)#6,910 |
| 65. | Fair Play | 12.2% | 9.8%(+2.40)#65 | 14.8%(-2.60)#6,918 |
| 66. | India Hook | 12.0% | 9.8%(+2.20)#66 | 14.8%(-2.80)#7,010 |
| 67. | Litchfield Beach | 11.7% | 9.8%(+1.90)#67 | 14.8%(-3.10)#7,157 |
| 68. | Edmund | 11.7% | 9.8%(+1.90)#68 | 14.8%(-3.10)#7,182 |
| 69. | Grover | 11.7% | 9.8%(+1.90)#69 | 14.8%(-3.10)#7,190 |
| 70. | Camden | 11.6% | 9.8%(+1.80)#70 | 14.8%(-3.20)#7,206 |
| 71. | Seabrook | 11.6% | 9.8%(+1.80)#71 | 14.8%(-3.20)#7,241 |
| 72. | Little Mountain | 11.6% | 9.8%(+1.80)#72 | 14.8%(-3.20)#7,253 |
| 73. | Hanahan | 11.5% | 9.8%(+1.70)#73 | 14.8%(-3.30)#7,270 |
| 74. | Pinopolis | 11.3% | 9.8%(+1.50)#74 | 14.8%(-3.50)#7,441 |
| 75. | Lexington | 11.1% | 9.8%(+1.30)#75 | 14.8%(-3.70)#7,522 |
| 76. | Easley | 11.0% | 9.8%(+1.20)#76 | 14.8%(-3.80)#7,614 |
| 77. | Cameron | 11.0% | 9.8%(+1.20)#77 | 14.8%(-3.80)#7,649 |
| 78. | Greer | 10.7% | 9.8%(+0.900)#78 | 14.8%(-4.10)#7,773 |
| 79. | Myrtle Beach | 10.7% | 9.8%(+0.900)#79 | 14.8%(-4.10)#7,774 |
| 80. | Reidville | 10.7% | 9.8%(+0.900)#80 | 14.8%(-4.10)#7,808 |
| 81. | Brunson | 10.7% | 9.8%(+0.900)#81 | 14.8%(-4.10)#7,818 |
| 82. | Awendaw | 10.6% | 9.8%(+0.800)#82 | 14.8%(-4.20)#7,861 |
| 83. | Lake Secession | 10.6% | 9.8%(+0.800)#83 | 14.8%(-4.20)#7,864 |
| 84. | West Union | 10.3% | 9.8%(+0.500)#84 | 14.8%(-4.50)#8,068 |
| 85. | Dalzell | 10.2% | 9.8%(+0.400)#85 | 14.8%(-4.60)#8,107 |
| 86. | North Santee | 10.1% | 9.8%(+0.300)#86 | 14.8%(-4.70)#8,219 |
| 87. | Boiling Springs | 10.0% | 9.8%(+0.200)#87 | 14.8%(-4.80)#8,246 |
| 88. | Belton | 10.0% | 9.8%(+0.200)#88 | 14.8%(-4.80)#8,257 |
| 89. | Wade Hampton | 9.9% | 9.8%(+0.100)#89 | 14.8%(-4.90)#8,329 |
| 90. | Ravenel | 9.8% | 9.8%(=0.000)#90 | 14.8%(-5.00)#8,423 |
| 91. | Beaufort | 9.5% | 9.8%(-0.300)#91 | 14.8%(-5.30)#8,610 |
| 92. | Hardeeville | 9.5% | 9.8%(-0.300)#92 | 14.8%(-5.30)#8,616 |
| 93. | Drayton | 9.5% | 9.8%(-0.300)#93 | 14.8%(-5.30)#8,641 |
| 94. | Laurens | 9.4% | 9.8%(-0.400)#94 | 14.8%(-5.40)#8,682 |
| 95. | Simpsonville | 9.3% | 9.8%(-0.500)#95 | 14.8%(-5.50)#8,749 |
| 96. | Inman | 9.3% | 9.8%(-0.500)#96 | 14.8%(-5.50)#8,780 |
| 97. | Sheldon | 9.3% | 9.8%(-0.500)#97 | 14.8%(-5.50)#8,812 |
| 98. | Wyboo | 9.2% | 9.8%(-0.600)#98 | 14.8%(-5.60)#8,857 |
| 99. | Mauldin | 9.1% | 9.8%(-0.700)#99 | 14.8%(-5.70)#8,902 |
| 100. | Olar | 9.1% | 9.8%(-0.700)#100 | 14.8%(-5.70)#8,977 |
Common Questions
What are the Top 10 Cities with the Highest Percentage of Families with Income Above $200,000 in South Carolina?
Top 10 Cities with the Highest Percentage of Families with Income Above $200,000 in South Carolina are:
#1
60.9%
#2
55.6%
#3
52.2%
#4
51.5%
#5
49.1%
#6
46.2%
#7
42.1%
#8
37.1%
#9
35.1%
#10
33.0%
What city has the Highest Percentage of Families with Income Above $200,000 in South Carolina?
Kiawah Island has the Highest Percentage of Families with Income Above $200,000 in South Carolina with 60.9%.
What is the Percentage of Families with Income Above $200,000 in the State of South Carolina?
Percentage of Families with Income Above $200,000 in South Carolina is 9.8%.
What is the Percentage of Families with Income Above $200,000 in the United States?
Percentage of Families with Income Above $200,000 in the United States is 14.8%.