Cities with the Highest Percentage of Families with Income Above $200,000 in Ohio
RELATED REPORTS & OPTIONS
Family Income | $200k+
Ohio
Compare Cities
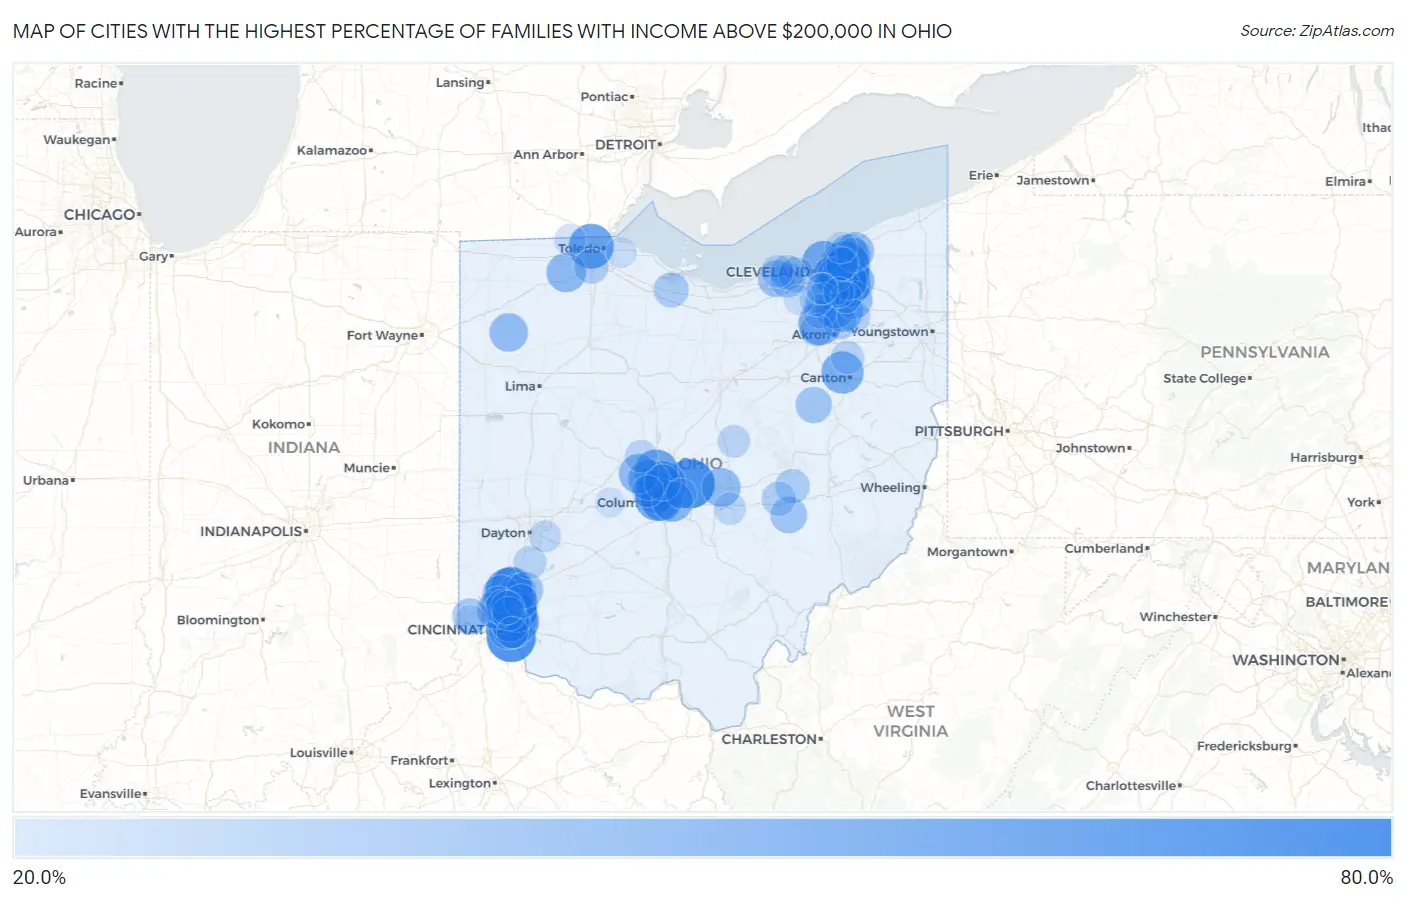
Map of Cities with the Highest Percentage of Families with Income Above $200,000 in Ohio
0.0%
80.0%
Cities with the Highest Percentage of Families with Income Above $200,000 in Ohio
| City | Families with Income > $200k | vs State | vs National | |
| 1. | New Albany | 62.5% | 10.8%(+51.7)#1 | 14.8%(+47.7)#325 |
| 2. | Gates Mills | 62.0% | 10.8%(+51.2)#2 | 14.8%(+47.2)#342 |
| 3. | Coldstream | 61.6% | 10.8%(+50.8)#3 | 14.8%(+46.8)#354 |
| 4. | Pepper Pike | 61.0% | 10.8%(+50.2)#4 | 14.8%(+46.2)#381 |
| 5. | Concorde Hills | 60.5% | 10.8%(+49.7)#5 | 14.8%(+45.7)#394 |
| 6. | The Village Of Indian Hill | 58.6% | 10.8%(+47.8)#6 | 14.8%(+43.8)#443 |
| 7. | Bentleyville | 58.4% | 10.8%(+47.6)#7 | 14.8%(+43.6)#460 |
| 8. | Wetherington | 56.7% | 10.8%(+45.9)#8 | 14.8%(+41.9)#520 |
| 9. | Riverlea | 56.3% | 10.8%(+45.5)#9 | 14.8%(+41.5)#540 |
| 10. | Hunting Valley | 54.8% | 10.8%(+44.0)#10 | 14.8%(+40.0)#588 |
| 11. | Terrace Park | 53.0% | 10.8%(+42.2)#11 | 14.8%(+38.2)#664 |
| 12. | Ottawa Hills | 52.4% | 10.8%(+41.6)#12 | 14.8%(+37.6)#693 |
| 13. | Moreland Hills | 52.2% | 10.8%(+41.4)#13 | 14.8%(+37.4)#698 |
| 14. | Marble Cliff | 51.6% | 10.8%(+40.8)#14 | 14.8%(+36.8)#727 |
| 15. | Powell | 49.6% | 10.8%(+38.8)#15 | 14.8%(+34.8)#810 |
| 16. | Sixteen Mile Stand | 49.4% | 10.8%(+38.6)#16 | 14.8%(+34.6)#821 |
| 17. | Remington | 49.2% | 10.8%(+38.4)#17 | 14.8%(+34.4)#830 |
| 18. | Bratenahl | 49.1% | 10.8%(+38.3)#18 | 14.8%(+34.3)#835 |
| 19. | Montrose Ghent | 48.8% | 10.8%(+38.0)#19 | 14.8%(+34.0)#851 |
| 20. | Madeira | 48.3% | 10.8%(+37.5)#20 | 14.8%(+33.5)#870 |
| 21. | Mariemont | 48.1% | 10.8%(+37.3)#21 | 14.8%(+33.3)#874 |
| 22. | Upper Arlington | 47.1% | 10.8%(+36.3)#22 | 14.8%(+32.3)#926 |
| 23. | Hills And Dales | 46.6% | 10.8%(+35.8)#23 | 14.8%(+31.8)#963 |
| 24. | Grandview Heights | 45.7% | 10.8%(+34.9)#24 | 14.8%(+30.9)#1,006 |
| 25. | Four Bridges | 45.3% | 10.8%(+34.5)#25 | 14.8%(+30.5)#1,037 |
| 26. | Turpin Hills | 44.3% | 10.8%(+33.5)#26 | 14.8%(+29.5)#1,079 |
| 27. | Montgomery | 44.1% | 10.8%(+33.3)#27 | 14.8%(+29.3)#1,089 |
| 28. | Hudson | 43.7% | 10.8%(+32.9)#28 | 14.8%(+28.9)#1,119 |
| 29. | Bexley | 43.4% | 10.8%(+32.6)#29 | 14.8%(+28.6)#1,150 |
| 30. | Dublin | 42.9% | 10.8%(+32.1)#30 | 14.8%(+28.1)#1,176 |
| 31. | Amberley | 42.6% | 10.8%(+31.8)#31 | 14.8%(+27.8)#1,204 |
| 32. | New California | 41.2% | 10.8%(+30.4)#32 | 14.8%(+26.4)#1,312 |
| 33. | Dry Run | 40.8% | 10.8%(+30.0)#33 | 14.8%(+26.0)#1,339 |
| 34. | Neapolis | 40.5% | 10.8%(+29.7)#34 | 14.8%(+25.7)#1,373 |
| 35. | Boston Heights | 40.3% | 10.8%(+29.5)#35 | 14.8%(+25.5)#1,383 |
| 36. | Miamiville | 40.0% | 10.8%(+29.2)#36 | 14.8%(+25.2)#1,413 |
| 37. | South Russell | 39.5% | 10.8%(+28.7)#37 | 14.8%(+24.7)#1,462 |
| 38. | Granville | 39.4% | 10.8%(+28.6)#38 | 14.8%(+24.6)#1,472 |
| 39. | Solon | 39.0% | 10.8%(+28.2)#39 | 14.8%(+24.2)#1,497 |
| 40. | Jacksontown | 38.8% | 10.8%(+28.0)#40 | 14.8%(+24.0)#1,521 |
| 41. | Waite Hill | 38.7% | 10.8%(+27.9)#41 | 14.8%(+23.9)#1,523 |
| 42. | Orange | 38.5% | 10.8%(+27.7)#42 | 14.8%(+23.7)#1,543 |
| 43. | Oakwood | 38.4% | 10.8%(+27.6)#43 | 14.8%(+23.6)#1,548 |
| 44. | Plainville | 37.9% | 10.8%(+27.1)#44 | 14.8%(+23.1)#1,590 |
| 45. | Kirtland Hills | 37.6% | 10.8%(+26.8)#45 | 14.8%(+22.8)#1,614 |
| 46. | Wyoming | 37.5% | 10.8%(+26.7)#46 | 14.8%(+22.7)#1,616 |
| 47. | Aurora | 36.7% | 10.8%(+25.9)#47 | 14.8%(+21.9)#1,684 |
| 48. | Chagrin Falls | 36.2% | 10.8%(+25.4)#48 | 14.8%(+21.4)#1,726 |
| 49. | Walton Hills | 36.1% | 10.8%(+25.3)#49 | 14.8%(+21.3)#1,737 |
| 50. | Mason | 35.9% | 10.8%(+25.1)#50 | 14.8%(+21.1)#1,749 |
| 51. | Beckett Ridge | 35.9% | 10.8%(+25.1)#51 | 14.8%(+21.1)#1,753 |
| 52. | Avon | 35.1% | 10.8%(+24.3)#52 | 14.8%(+20.3)#1,830 |
| 53. | Glendale | 34.9% | 10.8%(+24.1)#53 | 14.8%(+20.1)#1,854 |
| 54. | Duncan Falls | 34.2% | 10.8%(+23.4)#54 | 14.8%(+19.4)#1,925 |
| 55. | South Lebanon | 33.8% | 10.8%(+23.0)#55 | 14.8%(+19.0)#1,955 |
| 56. | Winesburg | 33.8% | 10.8%(+23.0)#56 | 14.8%(+19.0)#1,961 |
| 57. | Worthington | 33.7% | 10.8%(+22.9)#57 | 14.8%(+18.9)#1,969 |
| 58. | Evendale | 33.6% | 10.8%(+22.8)#58 | 14.8%(+18.8)#1,980 |
| 59. | Grandview | 32.8% | 10.8%(+22.0)#59 | 14.8%(+18.0)#2,059 |
| 60. | Westlake | 31.9% | 10.8%(+21.1)#60 | 14.8%(+17.1)#2,161 |
| 61. | Shaker Heights | 31.8% | 10.8%(+21.0)#61 | 14.8%(+17.0)#2,171 |
| 62. | Rocky River | 31.8% | 10.8%(+21.0)#62 | 14.8%(+17.0)#2,173 |
| 63. | Vickery | 31.0% | 10.8%(+20.2)#63 | 14.8%(+16.2)#2,255 |
| 64. | Beachwood | 30.8% | 10.8%(+20.0)#64 | 14.8%(+16.0)#2,269 |
| 65. | Bay Village | 30.4% | 10.8%(+19.6)#65 | 14.8%(+15.6)#2,319 |
| 66. | Kirtland | 30.3% | 10.8%(+19.5)#66 | 14.8%(+15.5)#2,331 |
| 67. | Adamsville | 30.2% | 10.8%(+19.4)#67 | 14.8%(+15.4)#2,352 |
| 68. | Perrysburg | 30.1% | 10.8%(+19.3)#68 | 14.8%(+15.3)#2,354 |
| 69. | Brecksville | 30.1% | 10.8%(+19.3)#69 | 14.8%(+15.3)#2,357 |
| 70. | Highland Heights | 29.9% | 10.8%(+19.1)#70 | 14.8%(+15.1)#2,378 |
| 71. | Richfield | 29.3% | 10.8%(+18.5)#71 | 14.8%(+14.5)#2,468 |
| 72. | North Zanesville | 29.2% | 10.8%(+18.4)#72 | 14.8%(+14.4)#2,480 |
| 73. | Loveland Park | 28.9% | 10.8%(+18.1)#73 | 14.8%(+14.1)#2,518 |
| 74. | Silver Lake | 28.6% | 10.8%(+17.8)#74 | 14.8%(+13.8)#2,565 |
| 75. | Kenwood | 28.0% | 10.8%(+17.2)#75 | 14.8%(+13.2)#2,656 |
| 76. | Sugar Bush Knolls | 27.8% | 10.8%(+17.0)#76 | 14.8%(+13.0)#2,697 |
| 77. | Blue Ash | 27.6% | 10.8%(+16.8)#77 | 14.8%(+12.8)#2,719 |
| 78. | Greentown | 27.1% | 10.8%(+16.3)#78 | 14.8%(+12.3)#2,800 |
| 79. | Five Points | 27.1% | 10.8%(+16.3)#79 | 14.8%(+12.3)#2,802 |
| 80. | Mayfield | 26.3% | 10.8%(+15.5)#80 | 14.8%(+11.5)#2,899 |
| 81. | Ostrander | 26.1% | 10.8%(+15.3)#81 | 14.8%(+11.3)#2,930 |
| 82. | Avon Lake | 26.0% | 10.8%(+15.2)#82 | 14.8%(+11.2)#2,942 |
| 83. | Pigeon Creek | 26.0% | 10.8%(+15.2)#83 | 14.8%(+11.2)#2,954 |
| 84. | Gambier | 25.9% | 10.8%(+15.1)#84 | 14.8%(+11.1)#2,974 |
| 85. | Broadview Heights | 25.6% | 10.8%(+14.8)#85 | 14.8%(+10.8)#3,011 |
| 86. | Thornport | 25.6% | 10.8%(+14.8)#86 | 14.8%(+10.8)#3,018 |
| 87. | Beavercreek | 24.5% | 10.8%(+13.7)#87 | 14.8%(+9.70)#3,195 |
| 88. | Hilliard | 24.3% | 10.8%(+13.5)#88 | 14.8%(+9.50)#3,230 |
| 89. | Berkey | 23.9% | 10.8%(+13.1)#89 | 14.8%(+9.10)#3,309 |
| 90. | Independence | 23.6% | 10.8%(+12.8)#90 | 14.8%(+8.80)#3,362 |
| 91. | Lakeline | 23.5% | 10.8%(+12.7)#91 | 14.8%(+8.70)#3,383 |
| 92. | Forestville | 23.0% | 10.8%(+12.2)#92 | 14.8%(+8.20)#3,454 |
| 93. | Valley View | 22.9% | 10.8%(+12.1)#93 | 14.8%(+8.10)#3,481 |
| 94. | Reminderville | 22.7% | 10.8%(+11.9)#94 | 14.8%(+7.90)#3,519 |
| 95. | Curtice | 22.0% | 10.8%(+11.2)#95 | 14.8%(+7.20)#3,683 |
| 96. | Glenwillow | 21.9% | 10.8%(+11.1)#96 | 14.8%(+7.10)#3,708 |
| 97. | Gahanna | 21.2% | 10.8%(+10.4)#97 | 14.8%(+6.40)#3,828 |
| 98. | Miami Heights | 21.1% | 10.8%(+10.3)#98 | 14.8%(+6.30)#3,868 |
| 99. | Strongsville | 20.9% | 10.8%(+10.1)#99 | 14.8%(+6.10)#3,900 |
| 100. | Choctaw Lake | 20.5% | 10.8%(+9.70)#100 | 14.8%(+5.70)#3,991 |
Common Questions
What are the Top 10 Cities with the Highest Percentage of Families with Income Above $200,000 in Ohio?
Top 10 Cities with the Highest Percentage of Families with Income Above $200,000 in Ohio are:
#1
62.5%
#2
62.0%
#3
61.6%
#4
61.0%
#5
60.5%
#6
58.6%
#7
58.4%
#8
56.7%
#9
56.3%
#10
54.8%
What city has the Highest Percentage of Families with Income Above $200,000 in Ohio?
New Albany has the Highest Percentage of Families with Income Above $200,000 in Ohio with 62.5%.
What is the Percentage of Families with Income Above $200,000 in the State of Ohio?
Percentage of Families with Income Above $200,000 in Ohio is 10.8%.
What is the Percentage of Families with Income Above $200,000 in the United States?
Percentage of Families with Income Above $200,000 in the United States is 14.8%.