Blackhawk, CA Map & Demographics
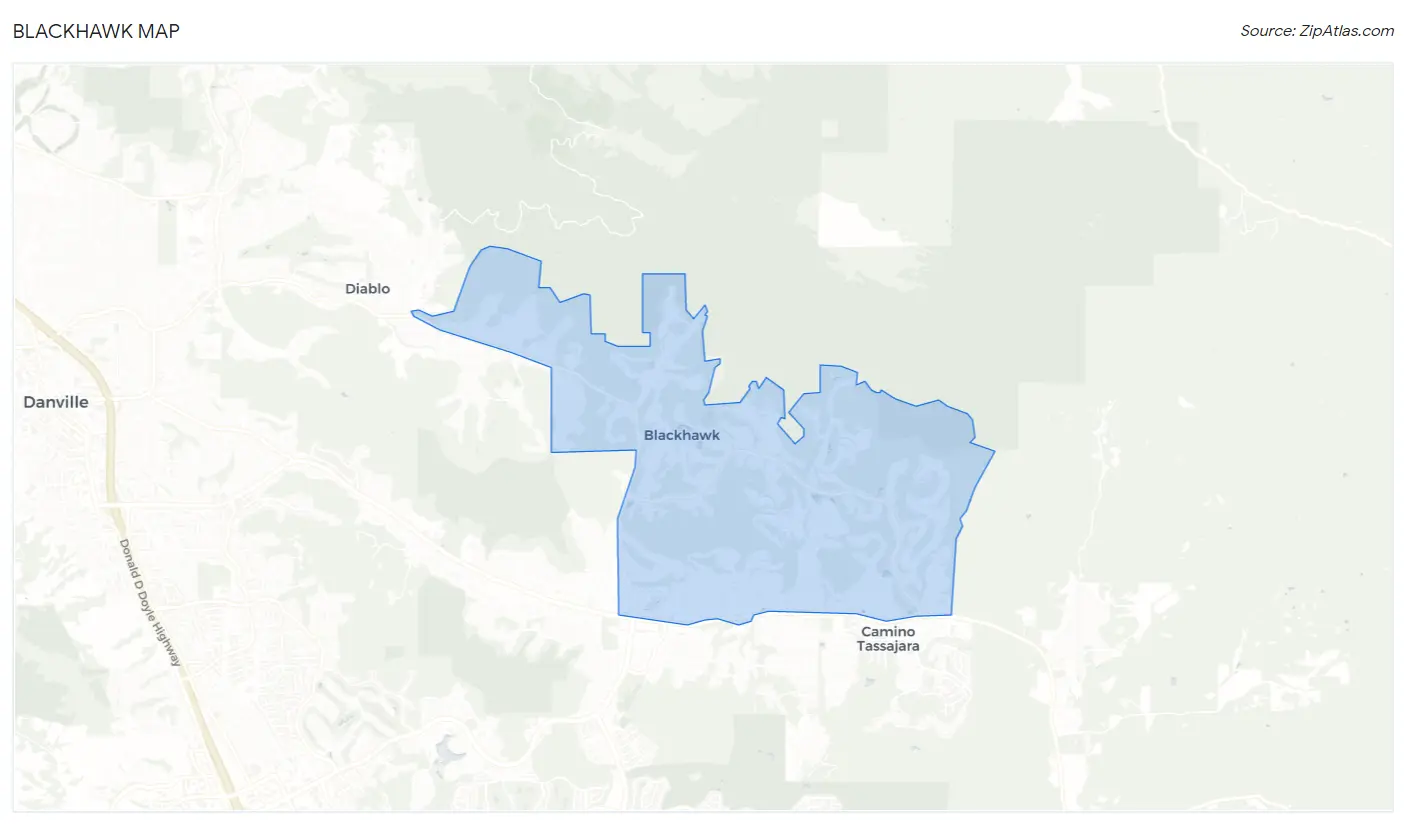
Blackhawk Map
Blackhawk Overview
$129,760
PER CAPITA INCOME
$250,001
AVG FAMILY INCOME
$234,773
AVG HOUSEHOLD INCOME
12.7%
WAGE / INCOME GAP [ % ]
87.3¢/ $1
WAGE / INCOME GAP [ $ ]
$5,899
FAMILY INCOME DEFICIT
0.51
INEQUALITY / GINI INDEX
10,622
TOTAL POPULATION
5,377
MALE POPULATION
5,245
FEMALE POPULATION
102.52
MALES / 100 FEMALES
97.55
FEMALES / 100 MALES
50.8
MEDIAN AGE
3.0
AVG FAMILY SIZE
2.7
AVG HOUSEHOLD SIZE
5,257
LABOR FORCE [ PEOPLE ]
57.2%
PERCENT IN LABOR FORCE
3.9%
UNEMPLOYMENT RATE
Blackhawk Area Codes
Income in Blackhawk
Income Overview in Blackhawk
Per Capita Income in Blackhawk is $129,760, while median incomes of families and households are $250,001 and $234,773 respectively.
| Characteristic | Number | Measure |
| Per Capita Income | 10,622 | $129,760 |
| Median Family Income | 3,219 | $250,001 |
| Mean Family Income | 3,219 | $380,189 |
| Median Household Income | 3,918 | $234,773 |
| Mean Household Income | 3,918 | $345,843 |
| Income Deficit | 3,219 | $5,899 |
| Wage / Income Gap (%) | 10,622 | 12.66% |
| Wage / Income Gap ($) | 10,622 | 87.34¢ per $1 |
| Gini / Inequality Index | 10,622 | 0.51 |
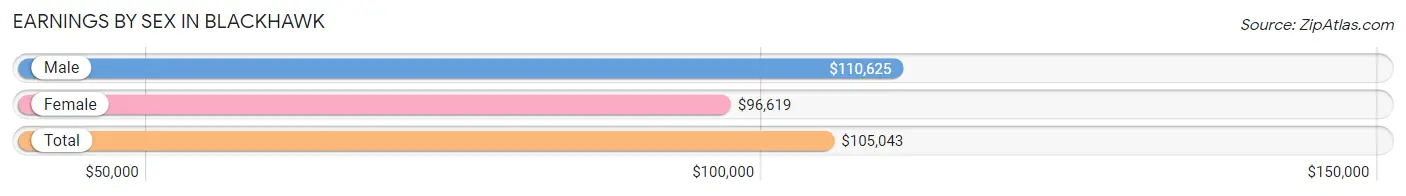
Earnings by Sex in Blackhawk
Average Earnings in Blackhawk are $105,043, $110,625 for men and $96,619 for women, a difference of 12.7%.
| Sex | Number | Average Earnings |
| Male | 3,238 (58.8%) | $110,625 |
| Female | 2,265 (41.2%) | $96,619 |
| Total | 5,503 (100.0%) | $105,043 |
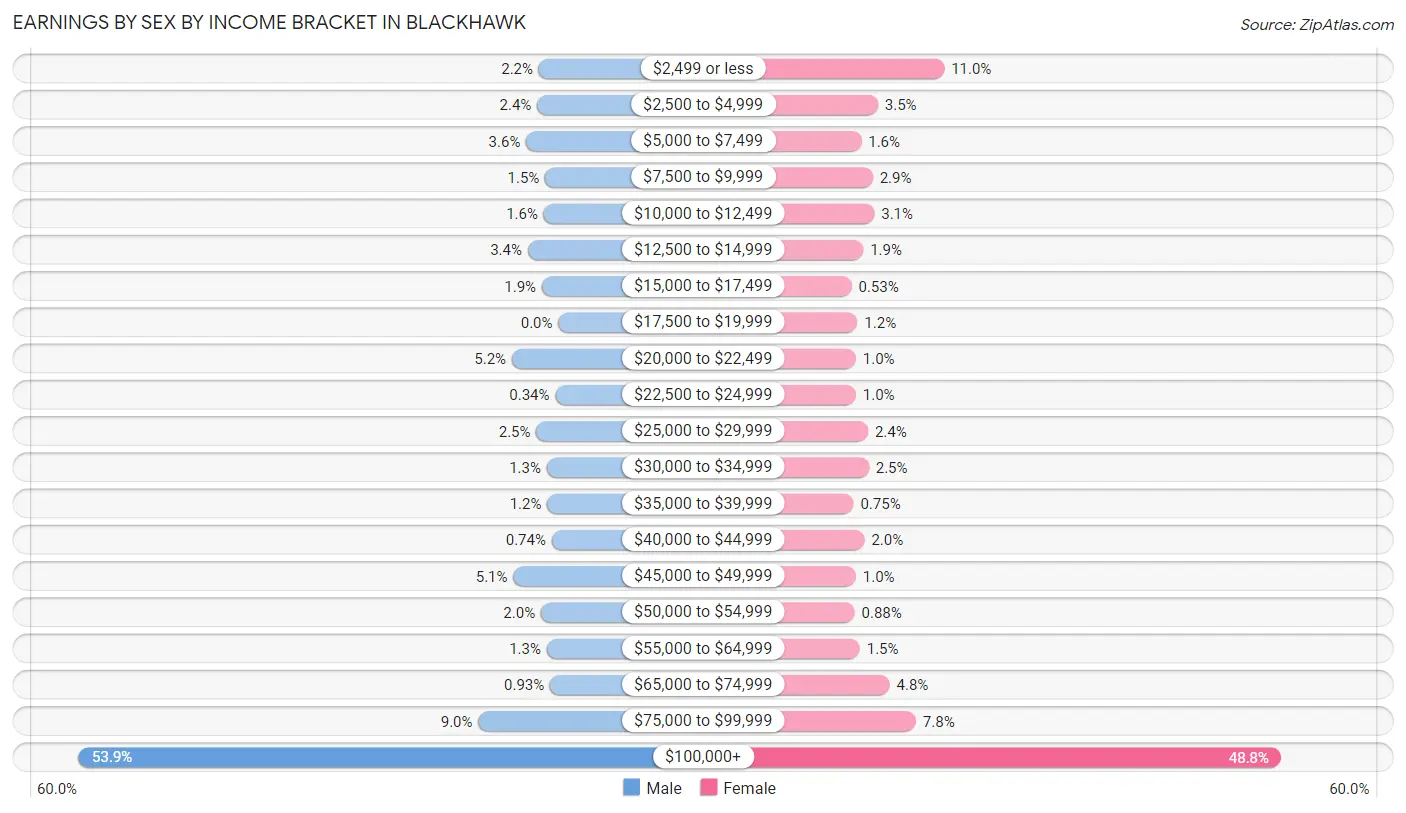
Earnings by Sex by Income Bracket in Blackhawk
The most common earnings brackets in Blackhawk are $100,000+ for men (1,745 | 53.9%) and $100,000+ for women (1,105 | 48.8%).
| Income | Male | Female |
| $2,499 or less | 71 (2.2%) | 248 (11.0%) |
| $2,500 to $4,999 | 77 (2.4%) | 79 (3.5%) |
| $5,000 to $7,499 | 117 (3.6%) | 37 (1.6%) |
| $7,500 to $9,999 | 48 (1.5%) | 66 (2.9%) |
| $10,000 to $12,499 | 53 (1.6%) | 70 (3.1%) |
| $12,500 to $14,999 | 111 (3.4%) | 42 (1.8%) |
| $15,000 to $17,499 | 60 (1.8%) | 12 (0.5%) |
| $17,500 to $19,999 | 0 (0.0%) | 27 (1.2%) |
| $20,000 to $22,499 | 169 (5.2%) | 23 (1.0%) |
| $22,500 to $24,999 | 11 (0.3%) | 23 (1.0%) |
| $25,000 to $29,999 | 80 (2.5%) | 54 (2.4%) |
| $30,000 to $34,999 | 42 (1.3%) | 56 (2.5%) |
| $35,000 to $39,999 | 40 (1.2%) | 17 (0.7%) |
| $40,000 to $44,999 | 24 (0.7%) | 45 (2.0%) |
| $45,000 to $49,999 | 164 (5.1%) | 23 (1.0%) |
| $50,000 to $54,999 | 63 (1.9%) | 20 (0.9%) |
| $55,000 to $64,999 | 42 (1.3%) | 33 (1.5%) |
| $65,000 to $74,999 | 30 (0.9%) | 109 (4.8%) |
| $75,000 to $99,999 | 291 (9.0%) | 176 (7.8%) |
| $100,000+ | 1,745 (53.9%) | 1,105 (48.8%) |
| Total | 3,238 (100.0%) | 2,265 (100.0%) |
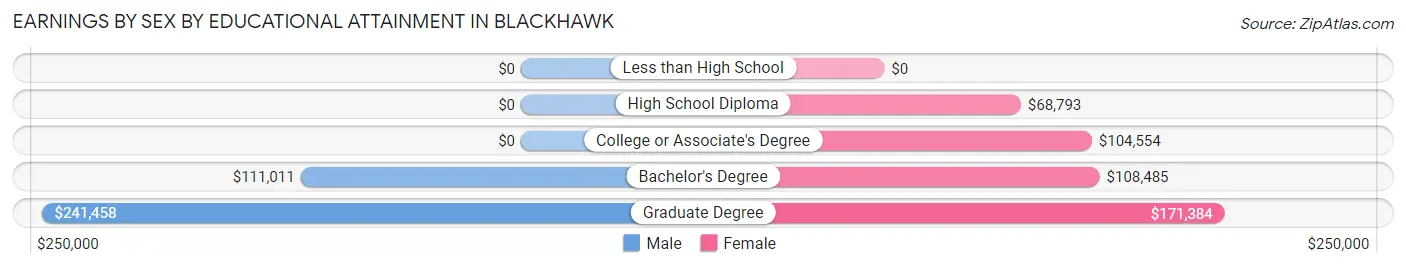
Earnings by Sex by Educational Attainment in Blackhawk
Average earnings in Blackhawk are $121,442 for men and $107,944 for women, a difference of 11.1%. Men with an educational attainment of graduate degree enjoy the highest average annual earnings of $241,458, while those with bachelor's degree education earn the least with $111,011. Women with an educational attainment of graduate degree earn the most with the average annual earnings of $171,384, while those with high school diploma education have the smallest earnings of $68,793.
| Educational Attainment | Male Income | Female Income |
| Less than High School | - | - |
| High School Diploma | - | - |
| College or Associate's Degree | - | - |
| Bachelor's Degree | $111,011 | $108,485 |
| Graduate Degree | $241,458 | $171,384 |
| Total | $121,442 | $107,944 |
Family Income in Blackhawk
Family Income Brackets in Blackhawk
According to the Blackhawk family income data, there are 2,083 families falling into the $200,000+ income range, which is the most common income bracket and makes up 64.7% of all families.
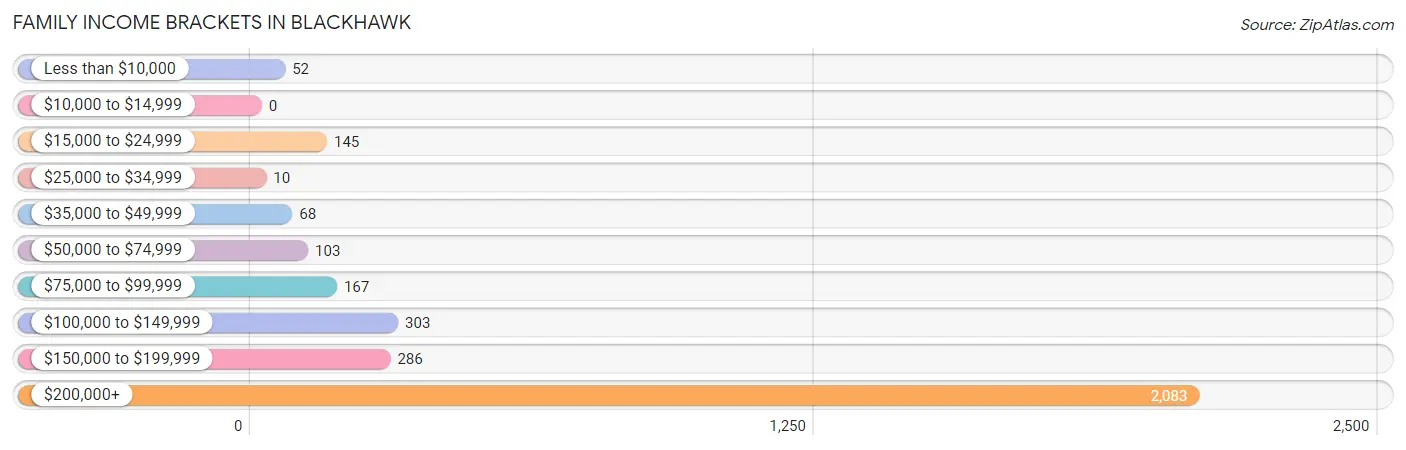
| Income Bracket | # Families | % Families |
| Less than $10,000 | 52 | 1.6% |
| $10,000 to $14,999 | 0 | 0.0% |
| $15,000 to $24,999 | 145 | 4.5% |
| $25,000 to $34,999 | 10 | 0.3% |
| $35,000 to $49,999 | 68 | 2.1% |
| $50,000 to $74,999 | 103 | 3.2% |
| $75,000 to $99,999 | 167 | 5.2% |
| $100,000 to $149,999 | 303 | 9.4% |
| $150,000 to $199,999 | 286 | 8.9% |
| $200,000+ | 2,083 | 64.7% |
Family Income by Famaliy Size in Blackhawk
4-person families (575 | 17.9%) account for the highest median family income in Blackhawk with $250,001 per family, while 2-person families (1,469 | 45.6%) have the highest median income of $122,516 per family member.
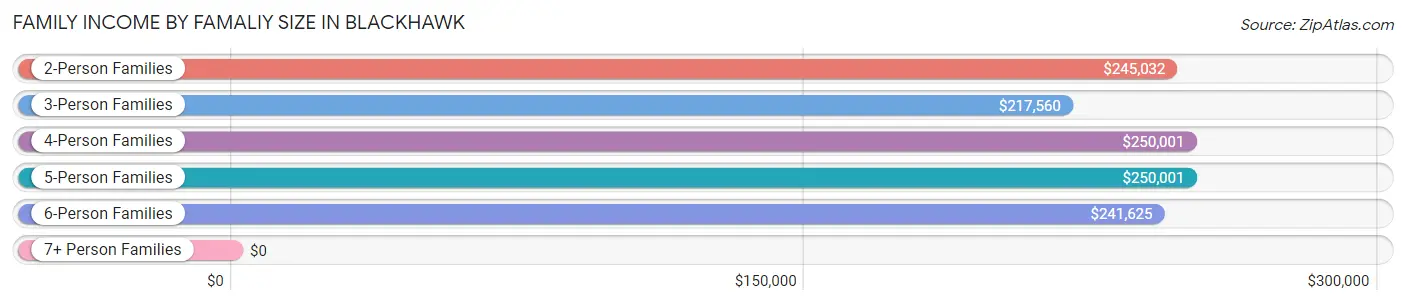
| Income Bracket | # Families | Median Income |
| 2-Person Families | 1,469 (45.6%) | $245,032 |
| 3-Person Families | 951 (29.5%) | $217,560 |
| 4-Person Families | 575 (17.9%) | $250,001 |
| 5-Person Families | 156 (4.9%) | $250,001 |
| 6-Person Families | 68 (2.1%) | $241,625 |
| 7+ Person Families | 0 (0.0%) | $0 |
| Total | 3,219 (100.0%) | $250,001 |
Family Income by Number of Earners in Blackhawk
The median family income in Blackhawk is $250,001, with families comprising 2 earners (1,309) having the highest median family income of $250,001, while families with no earners (365) have the lowest median family income of $162,583, accounting for 40.7% and 11.3% of families, respectively.
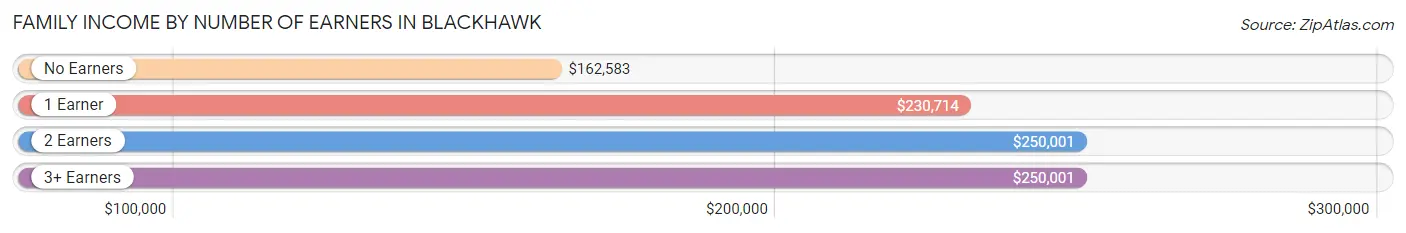
| Number of Earners | # Families | Median Income |
| No Earners | 365 (11.3%) | $162,583 |
| 1 Earner | 1,294 (40.2%) | $230,714 |
| 2 Earners | 1,309 (40.7%) | $250,001 |
| 3+ Earners | 251 (7.8%) | $250,001 |
| Total | 3,219 (100.0%) | $250,001 |
Household Income in Blackhawk
Household Income Brackets in Blackhawk
With 2,249 households falling in the category, the $200,000+ income range is the most frequent in Blackhawk, accounting for 57.4% of all households.
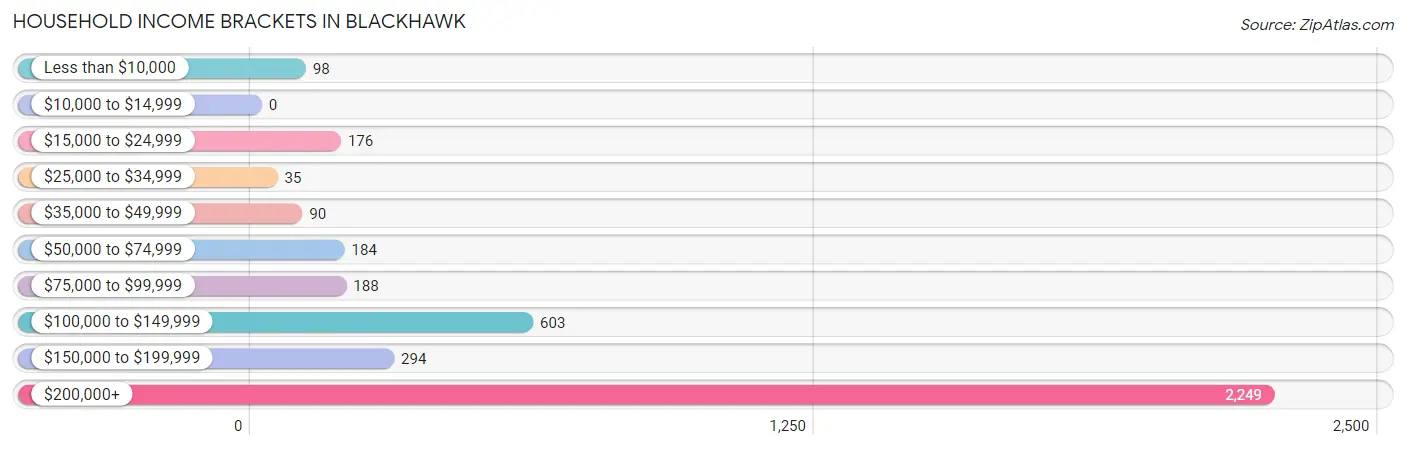
| Income Bracket | # Households | % Households |
| Less than $10,000 | 98 | 2.5% |
| $10,000 to $14,999 | 0 | 0.0% |
| $15,000 to $24,999 | 176 | 4.5% |
| $25,000 to $34,999 | 35 | 0.9% |
| $35,000 to $49,999 | 90 | 2.3% |
| $50,000 to $74,999 | 184 | 4.7% |
| $75,000 to $99,999 | 188 | 4.8% |
| $100,000 to $149,999 | 603 | 15.4% |
| $150,000 to $199,999 | 294 | 7.5% |
| $200,000+ | 2,249 | 57.4% |
Household Income by Householder Age in Blackhawk
The median household income in Blackhawk is $234,773, with the highest median household income of $250,001 found in the 45 to 64 years age bracket for the primary householder. A total of 1,708 households (43.6%) fall into this category.
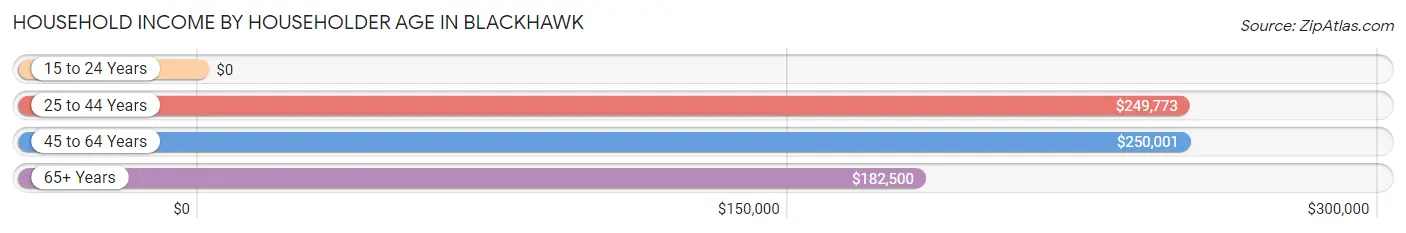
| Income Bracket | # Households | Median Income |
| 15 to 24 Years | 0 (0.0%) | $0 |
| 25 to 44 Years | 772 (19.7%) | $249,773 |
| 45 to 64 Years | 1,708 (43.6%) | $250,001 |
| 65+ Years | 1,438 (36.7%) | $182,500 |
| Total | 3,918 (100.0%) | $234,773 |
Poverty in Blackhawk
Income Below Poverty by Sex and Age in Blackhawk
With 7.5% poverty level for males and 6.2% for females among the residents of Blackhawk, under 5 year old males and 25 to 34 year old females are the most vulnerable to poverty, with 122 males (50.4%) and 149 females (38.5%) in their respective age groups living below the poverty level.
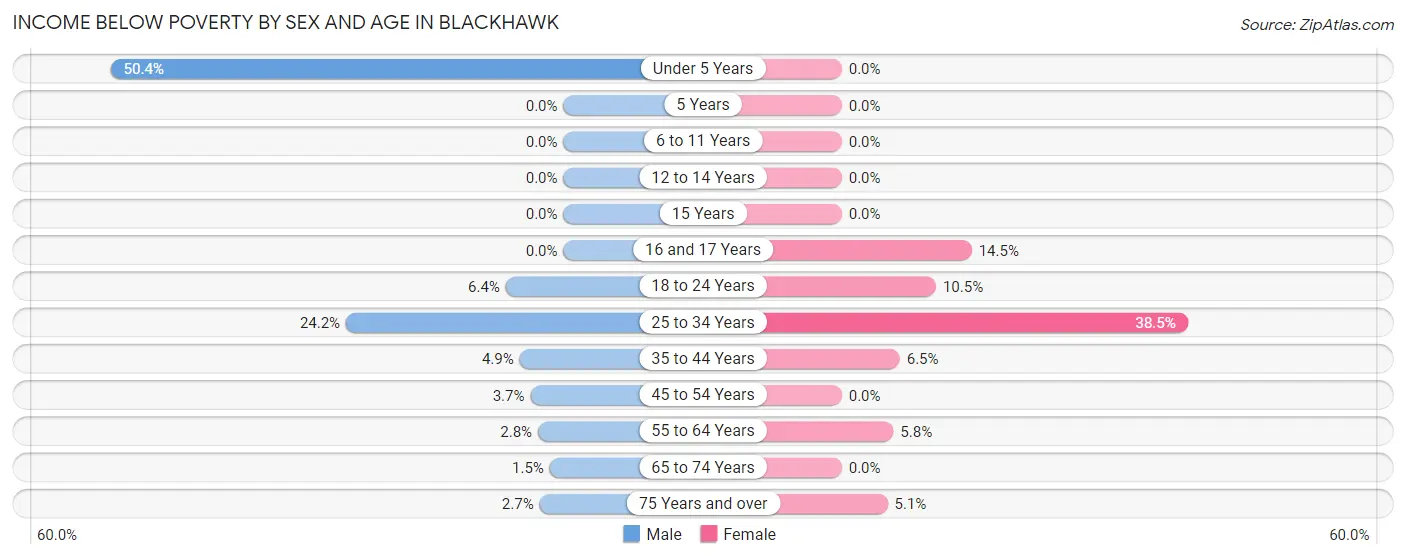
| Age Bracket | Male | Female |
| Under 5 Years | 122 (50.4%) | 0 (0.0%) |
| 5 Years | 0 (0.0%) | 0 (0.0%) |
| 6 to 11 Years | 0 (0.0%) | 0 (0.0%) |
| 12 to 14 Years | 0 (0.0%) | 0 (0.0%) |
| 15 Years | 0 (0.0%) | 0 (0.0%) |
| 16 and 17 Years | 0 (0.0%) | 23 (14.5%) |
| 18 to 24 Years | 34 (6.4%) | 30 (10.5%) |
| 25 to 34 Years | 146 (24.2%) | 149 (38.5%) |
| 35 to 44 Years | 18 (4.9%) | 36 (6.5%) |
| 45 to 54 Years | 29 (3.7%) | 0 (0.0%) |
| 55 to 64 Years | 26 (2.8%) | 60 (5.8%) |
| 65 to 74 Years | 12 (1.5%) | 0 (0.0%) |
| 75 Years and over | 12 (2.7%) | 23 (5.1%) |
| Total | 399 (7.5%) | 321 (6.2%) |
Income Above Poverty by Sex and Age in Blackhawk
According to the poverty statistics in Blackhawk, males aged 6 to 11 years and females aged under 5 years are the age groups that are most secure financially, with 100.0% of males and 100.0% of females in these age groups living above the poverty line.
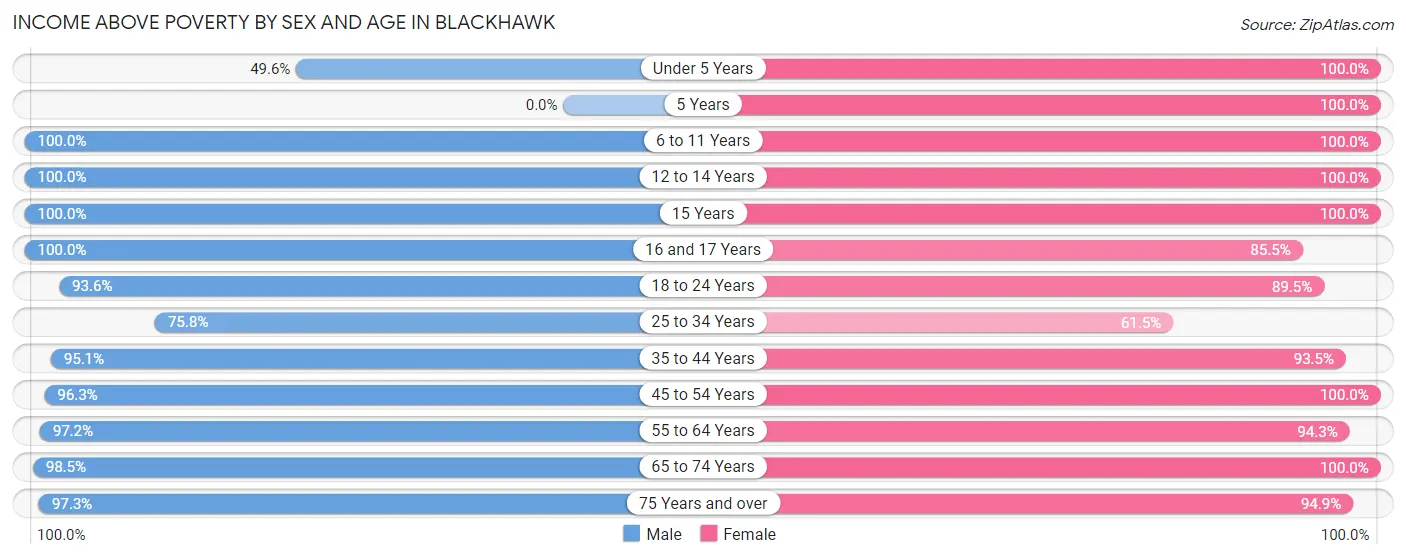
| Age Bracket | Male | Female |
| Under 5 Years | 120 (49.6%) | 108 (100.0%) |
| 5 Years | 0 (0.0%) | 10 (100.0%) |
| 6 to 11 Years | 246 (100.0%) | 326 (100.0%) |
| 12 to 14 Years | 116 (100.0%) | 203 (100.0%) |
| 15 Years | 104 (100.0%) | 70 (100.0%) |
| 16 and 17 Years | 185 (100.0%) | 136 (85.5%) |
| 18 to 24 Years | 496 (93.6%) | 256 (89.5%) |
| 25 to 34 Years | 457 (75.8%) | 238 (61.5%) |
| 35 to 44 Years | 351 (95.1%) | 521 (93.5%) |
| 45 to 54 Years | 759 (96.3%) | 702 (100.0%) |
| 55 to 64 Years | 894 (97.2%) | 983 (94.3%) |
| 65 to 74 Years | 780 (98.5%) | 877 (100.0%) |
| 75 Years and over | 439 (97.3%) | 428 (94.9%) |
| Total | 4,947 (92.5%) | 4,858 (93.8%) |
Income Below Poverty Among Married-Couple Families in Blackhawk
The poverty statistics for married-couple families in Blackhawk show that 6.6% or 196 of the total 2,981 families live below the poverty line. Families with 1 or 2 children have the highest poverty rate of 14.3%, comprising of 146 families. On the other hand, families with 3 or 4 children have the lowest poverty rate of 0.0%, which includes 0 families.
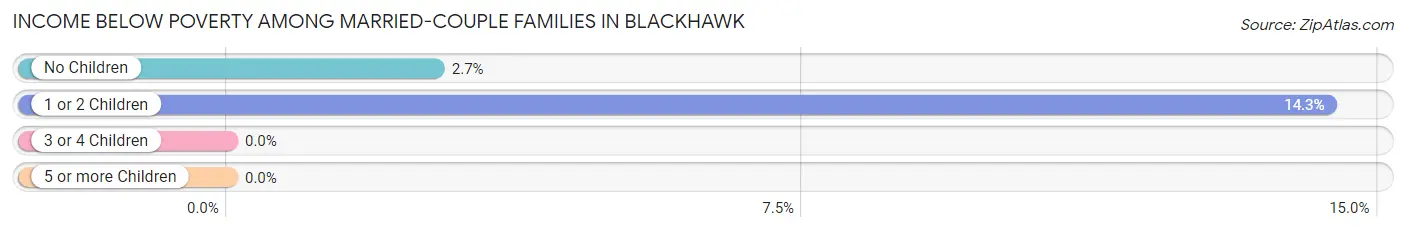
| Children | Above Poverty | Below Poverty |
| No Children | 1,799 (97.3%) | 50 (2.7%) |
| 1 or 2 Children | 872 (85.7%) | 146 (14.3%) |
| 3 or 4 Children | 114 (100.0%) | 0 (0.0%) |
| 5 or more Children | 0 (0.0%) | 0 (0.0%) |
| Total | 2,785 (93.4%) | 196 (6.6%) |
Income Below Poverty Among Single-Parent Households in Blackhawk
| Children | Single Father | Single Mother |
| No Children | 0 (0.0%) | 0 (0.0%) |
| 1 or 2 Children | 0 (0.0%) | 0 (0.0%) |
| 3 or 4 Children | 0 (0.0%) | 0 (0.0%) |
| 5 or more Children | 0 (0.0%) | 0 (0.0%) |
| Total | 0 (0.0%) | 0 (0.0%) |
Income Below Poverty Among Married-Couple vs Single-Parent Households in Blackhawk
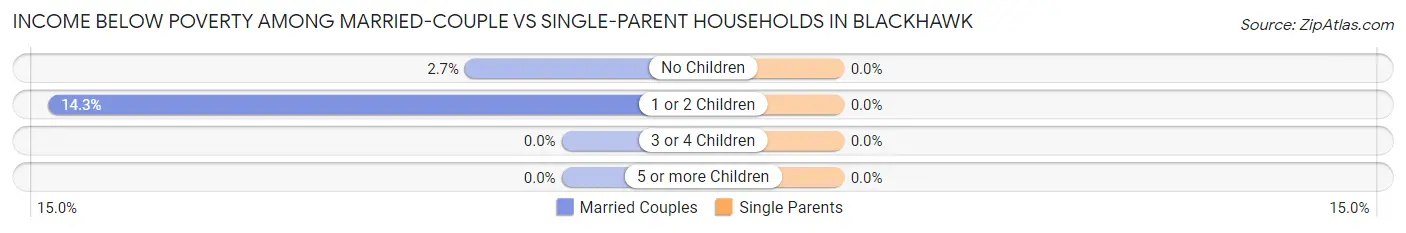
| Children | Married-Couple Families | Single-Parent Households |
| No Children | 50 (2.7%) | 0 (0.0%) |
| 1 or 2 Children | 146 (14.3%) | 0 (0.0%) |
| 3 or 4 Children | 0 (0.0%) | 0 (0.0%) |
| 5 or more Children | 0 (0.0%) | 0 (0.0%) |
| Total | 196 (6.6%) | 0 (0.0%) |
Race in Blackhawk
The most populous races in Blackhawk are White / Caucasian (7,032 | 66.2%), Asian (1,844 | 17.4%), and Two or more Races (946 | 8.9%).
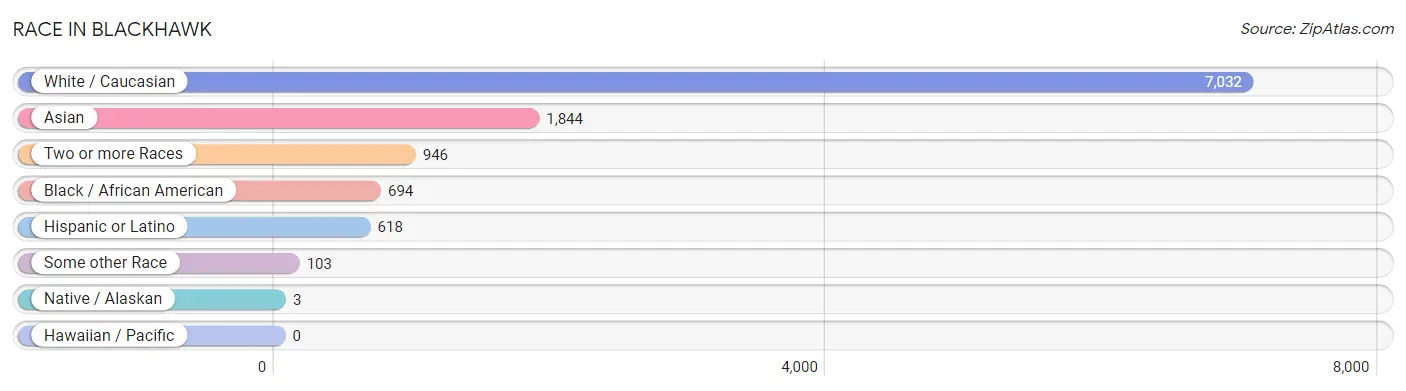
| Race | # Population | % Population |
| Asian | 1,844 | 17.4% |
| Black / African American | 694 | 6.5% |
| Hawaiian / Pacific | 0 | 0.0% |
| Hispanic or Latino | 618 | 5.8% |
| Native / Alaskan | 3 | 0.0% |
| White / Caucasian | 7,032 | 66.2% |
| Two or more Races | 946 | 8.9% |
| Some other Race | 103 | 1.0% |
| Total | 10,622 | 100.0% |
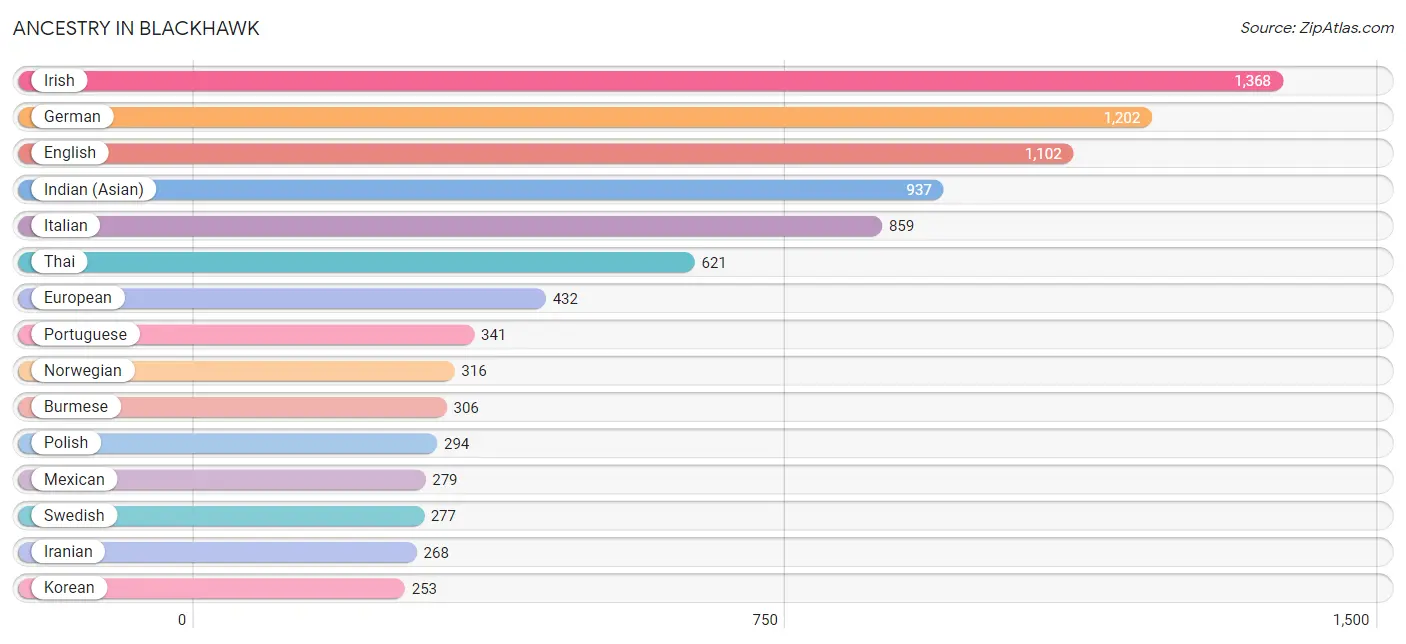
Ancestry in Blackhawk
The most populous ancestries reported in Blackhawk are Irish (1,368 | 12.9%), German (1,202 | 11.3%), English (1,102 | 10.4%), Indian (Asian) (937 | 8.8%), and Italian (859 | 8.1%), together accounting for 51.5% of all Blackhawk residents.
| Ancestry | # Population | % Population |
| Albanian | 51 | 0.5% |
| American | 196 | 1.8% |
| Arab | 75 | 0.7% |
| Austrian | 14 | 0.1% |
| Basque | 35 | 0.3% |
| Bhutanese | 75 | 0.7% |
| Blackfeet | 12 | 0.1% |
| British | 64 | 0.6% |
| Burmese | 306 | 2.9% |
| Central American | 42 | 0.4% |
| Croatian | 12 | 0.1% |
| Cuban | 39 | 0.4% |
| Czech | 59 | 0.6% |
| Danish | 58 | 0.5% |
| Dutch | 23 | 0.2% |
| Eastern European | 165 | 1.5% |
| Egyptian | 29 | 0.3% |
| English | 1,102 | 10.4% |
| European | 432 | 4.1% |
| Filipino | 20 | 0.2% |
| Finnish | 30 | 0.3% |
| French | 143 | 1.3% |
| French Canadian | 10 | 0.1% |
| German | 1,202 | 11.3% |
| Greek | 27 | 0.3% |
| Hungarian | 116 | 1.1% |
| Indian (Asian) | 937 | 8.8% |
| Iranian | 268 | 2.5% |
| Irish | 1,368 | 12.9% |
| Italian | 859 | 8.1% |
| Korean | 253 | 2.4% |
| Laotian | 9 | 0.1% |
| Lebanese | 9 | 0.1% |
| Mexican | 279 | 2.6% |
| Mexican American Indian | 29 | 0.3% |
| Nicaraguan | 19 | 0.2% |
| Northern European | 29 | 0.3% |
| Norwegian | 316 | 3.0% |
| Pakistani | 71 | 0.7% |
| Peruvian | 68 | 0.6% |
| Polish | 294 | 2.8% |
| Portuguese | 341 | 3.2% |
| Pueblo | 3 | 0.0% |
| Puerto Rican | 8 | 0.1% |
| Russian | 119 | 1.1% |
| Salvadoran | 23 | 0.2% |
| Scandinavian | 31 | 0.3% |
| Scotch-Irish | 85 | 0.8% |
| Scottish | 216 | 2.0% |
| Serbian | 14 | 0.1% |
| Slovak | 14 | 0.1% |
| South American | 86 | 0.8% |
| Spaniard | 10 | 0.1% |
| Spanish | 142 | 1.3% |
| Sri Lankan | 129 | 1.2% |
| Swedish | 277 | 2.6% |
| Swiss | 88 | 0.8% |
| Syrian | 37 | 0.4% |
| Thai | 621 | 5.9% |
| Turkish | 10 | 0.1% |
| Ukrainian | 43 | 0.4% |
| Venezuelan | 18 | 0.2% |
| Welsh | 39 | 0.4% |
| Yugoslavian | 63 | 0.6% | View All 64 Rows |
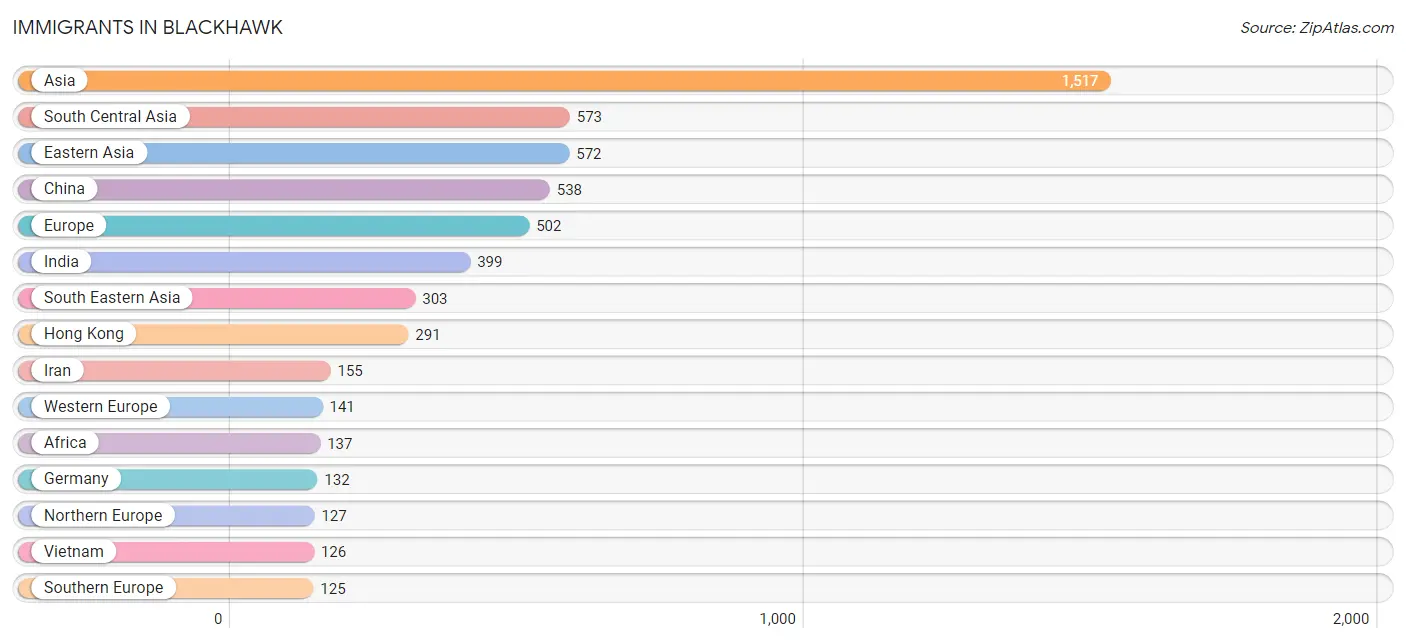
Immigrants in Blackhawk
The most numerous immigrant groups reported in Blackhawk came from Asia (1,517 | 14.3%), South Central Asia (573 | 5.4%), Eastern Asia (572 | 5.4%), China (538 | 5.1%), and Europe (502 | 4.7%), together accounting for 34.9% of all Blackhawk residents.
| Immigration Origin | # Population | % Population |
| Africa | 137 | 1.3% |
| Asia | 1,517 | 14.3% |
| Australia | 21 | 0.2% |
| Bosnia and Herzegovina | 23 | 0.2% |
| Canada | 57 | 0.5% |
| Caribbean | 13 | 0.1% |
| Central America | 18 | 0.2% |
| China | 538 | 5.1% |
| Cuba | 13 | 0.1% |
| Eastern Africa | 43 | 0.4% |
| Eastern Asia | 572 | 5.4% |
| Eastern Europe | 109 | 1.0% |
| Ecuador | 20 | 0.2% |
| Egypt | 29 | 0.3% |
| Europe | 502 | 4.7% |
| Fiji | 25 | 0.2% |
| Germany | 132 | 1.2% |
| Greece | 27 | 0.3% |
| Hong Kong | 291 | 2.7% |
| India | 399 | 3.8% |
| Iran | 155 | 1.5% |
| Ireland | 52 | 0.5% |
| Italy | 22 | 0.2% |
| Kenya | 9 | 0.1% |
| Korea | 34 | 0.3% |
| Latin America | 108 | 1.0% |
| Lebanon | 5 | 0.1% |
| Malaysia | 16 | 0.2% |
| Mexico | 18 | 0.2% |
| Netherlands | 9 | 0.1% |
| Northern Africa | 29 | 0.3% |
| Northern Europe | 127 | 1.2% |
| Oceania | 46 | 0.4% |
| Peru | 48 | 0.4% |
| Philippines | 81 | 0.8% |
| Poland | 10 | 0.1% |
| Portugal | 76 | 0.7% |
| Russia | 43 | 0.4% |
| South Africa | 42 | 0.4% |
| South America | 77 | 0.7% |
| South Central Asia | 573 | 5.4% |
| South Eastern Asia | 303 | 2.9% |
| Southern Europe | 125 | 1.2% |
| Taiwan | 13 | 0.1% |
| Thailand | 71 | 0.7% |
| Turkey | 64 | 0.6% |
| Uganda | 13 | 0.1% |
| Ukraine | 33 | 0.3% |
| Uzbekistan | 19 | 0.2% |
| Venezuela | 9 | 0.1% |
| Vietnam | 126 | 1.2% |
| Western Asia | 69 | 0.6% |
| Western Europe | 141 | 1.3% | View All 53 Rows |
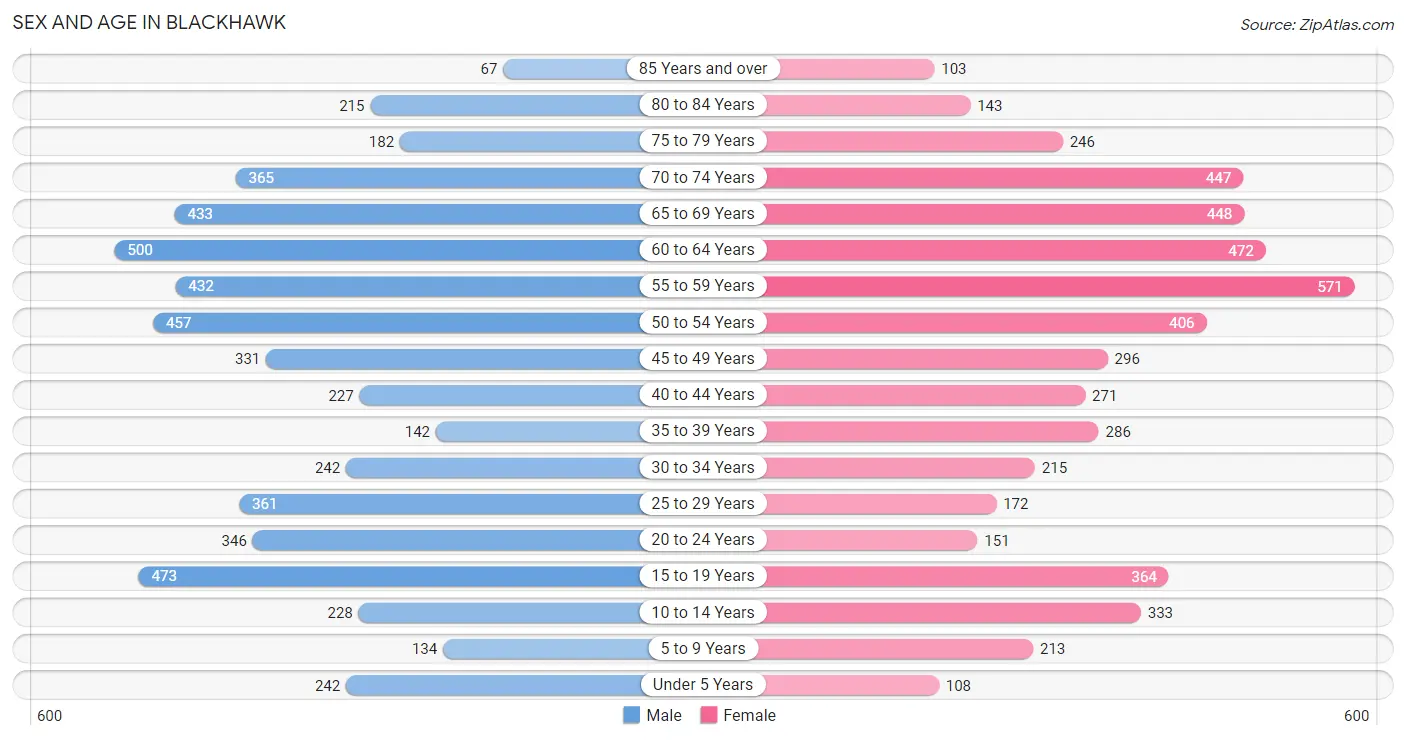
Sex and Age in Blackhawk
Sex and Age in Blackhawk
The most populous age groups in Blackhawk are 60 to 64 Years (500 | 9.3%) for men and 55 to 59 Years (571 | 10.9%) for women.
| Age Bracket | Male | Female |
| Under 5 Years | 242 (4.5%) | 108 (2.1%) |
| 5 to 9 Years | 134 (2.5%) | 213 (4.1%) |
| 10 to 14 Years | 228 (4.2%) | 333 (6.4%) |
| 15 to 19 Years | 473 (8.8%) | 364 (6.9%) |
| 20 to 24 Years | 346 (6.4%) | 151 (2.9%) |
| 25 to 29 Years | 361 (6.7%) | 172 (3.3%) |
| 30 to 34 Years | 242 (4.5%) | 215 (4.1%) |
| 35 to 39 Years | 142 (2.6%) | 286 (5.4%) |
| 40 to 44 Years | 227 (4.2%) | 271 (5.2%) |
| 45 to 49 Years | 331 (6.2%) | 296 (5.6%) |
| 50 to 54 Years | 457 (8.5%) | 406 (7.7%) |
| 55 to 59 Years | 432 (8.0%) | 571 (10.9%) |
| 60 to 64 Years | 500 (9.3%) | 472 (9.0%) |
| 65 to 69 Years | 433 (8.1%) | 448 (8.5%) |
| 70 to 74 Years | 365 (6.8%) | 447 (8.5%) |
| 75 to 79 Years | 182 (3.4%) | 246 (4.7%) |
| 80 to 84 Years | 215 (4.0%) | 143 (2.7%) |
| 85 Years and over | 67 (1.3%) | 103 (2.0%) |
| Total | 5,377 (100.0%) | 5,245 (100.0%) |
Families and Households in Blackhawk
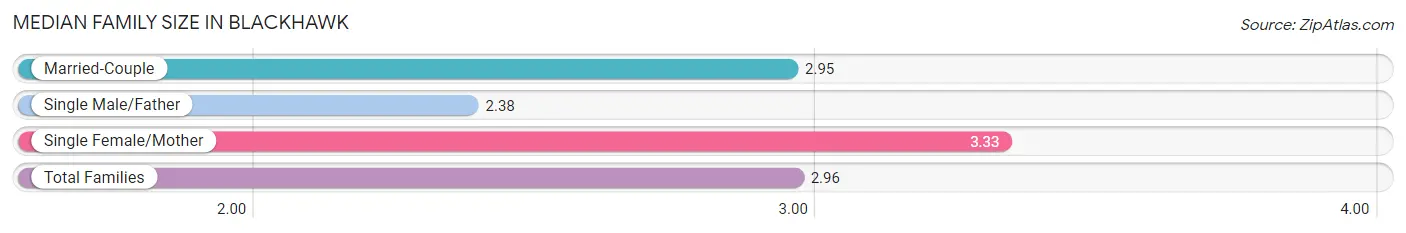
Median Family Size in Blackhawk
The median family size in Blackhawk is 2.96 persons per family, with single female/mother families (193 | 6.0%) accounting for the largest median family size of 3.33 persons per family. On the other hand, single male/father families (45 | 1.4%) represent the smallest median family size with 2.38 persons per family.
| Family Type | # Families | Family Size |
| Married-Couple | 2,981 (92.6%) | 2.95 |
| Single Male/Father | 45 (1.4%) | 2.38 |
| Single Female/Mother | 193 (6.0%) | 3.33 |
| Total Families | 3,219 (100.0%) | 2.96 |
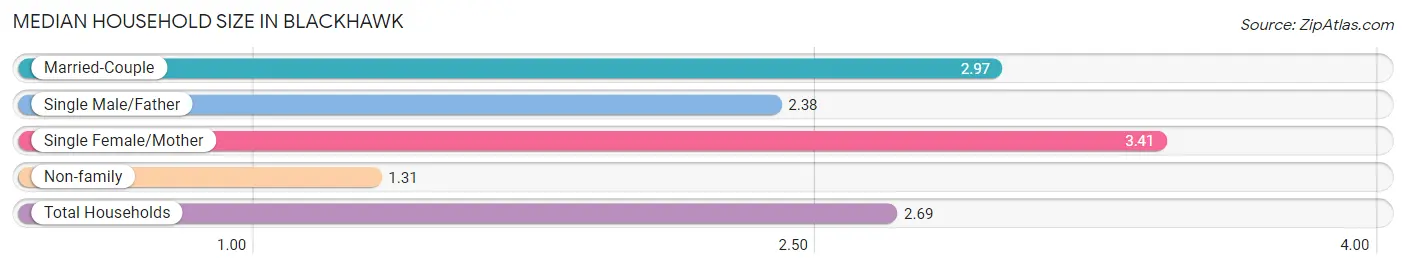
Median Household Size in Blackhawk
The median household size in Blackhawk is 2.69 persons per household, with single female/mother households (193 | 4.9%) accounting for the largest median household size of 3.41 persons per household. non-family households (699 | 17.8%) represent the smallest median household size with 1.31 persons per household.
| Household Type | # Households | Household Size |
| Married-Couple | 2,981 (76.1%) | 2.97 |
| Single Male/Father | 45 (1.1%) | 2.38 |
| Single Female/Mother | 193 (4.9%) | 3.41 |
| Non-family | 699 (17.8%) | 1.31 |
| Total Households | 3,918 (100.0%) | 2.69 |
Household Size by Marriage Status in Blackhawk
Out of a total of 3,918 households in Blackhawk, 3,219 (82.2%) are family households, while 699 (17.8%) are nonfamily households. The most numerous type of family households are 2-person households, comprising 1,439, and the most common type of nonfamily households are 1-person households, comprising 469.
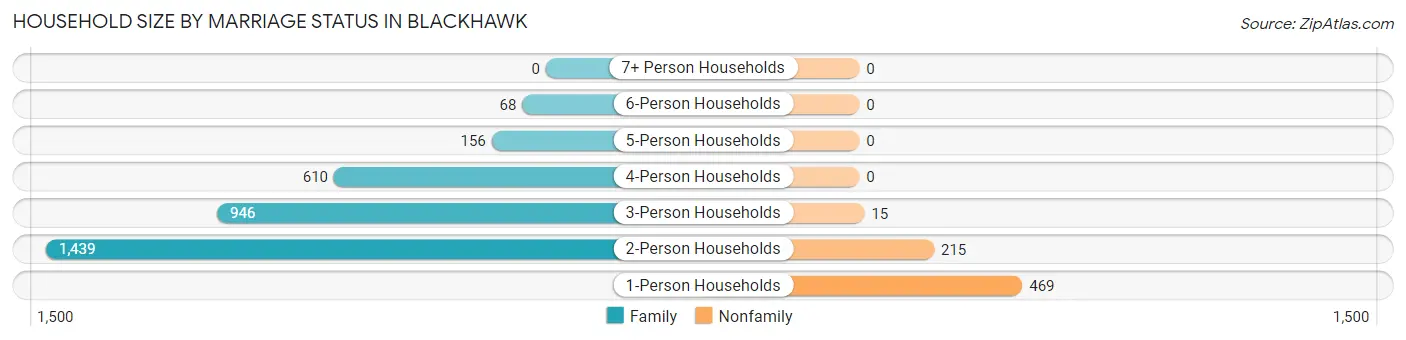
| Household Size | Family Households | Nonfamily Households |
| 1-Person Households | - | 469 (12.0%) |
| 2-Person Households | 1,439 (36.7%) | 215 (5.5%) |
| 3-Person Households | 946 (24.1%) | 15 (0.4%) |
| 4-Person Households | 610 (15.6%) | 0 (0.0%) |
| 5-Person Households | 156 (4.0%) | 0 (0.0%) |
| 6-Person Households | 68 (1.7%) | 0 (0.0%) |
| 7+ Person Households | 0 (0.0%) | 0 (0.0%) |
| Total | 3,219 (82.2%) | 699 (17.8%) |
Female Fertility in Blackhawk
Fertility by Age in Blackhawk
Average fertility rate in Blackhawk is 126.0 births per 1,000 women. Women in the age bracket of 20 to 34 years have the highest fertility rate with 401.0 births per 1,000 women. Women in the age bracket of 20 to 34 years acount for 93.5% of all women with births.
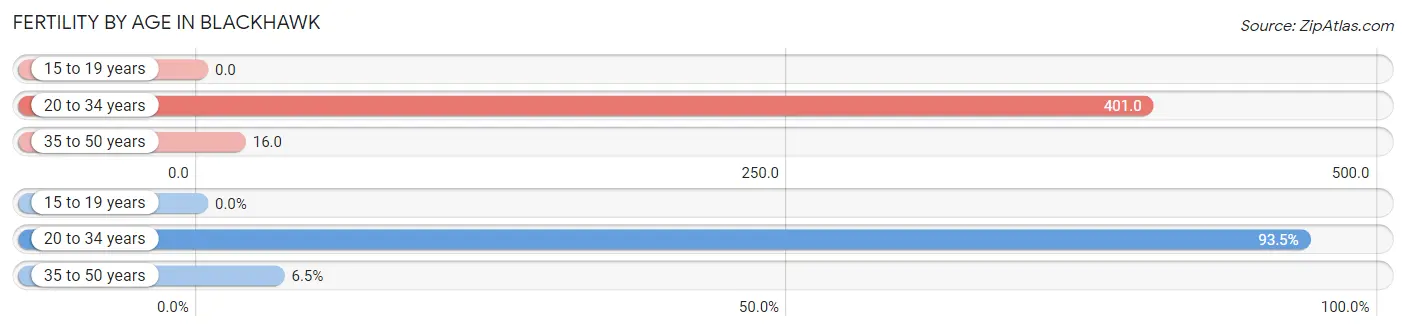
| Age Bracket | Women with Births | Births / 1,000 Women |
| 15 to 19 years | 0 (0.0%) | 0.0 |
| 20 to 34 years | 216 (93.5%) | 401.0 |
| 35 to 50 years | 15 (6.5%) | 16.0 |
| Total | 231 (100.0%) | 126.0 |
Fertility by Age by Marriage Status in Blackhawk
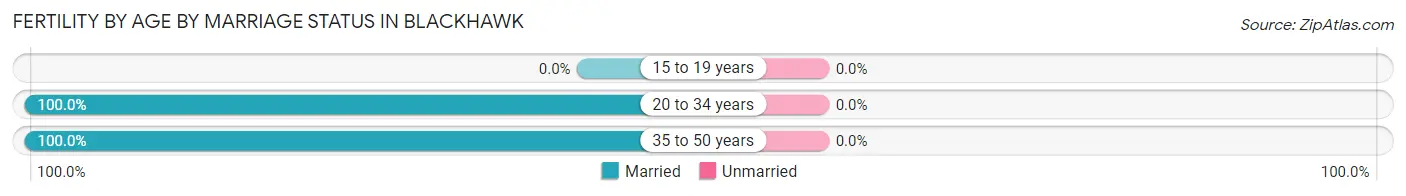
| Age Bracket | Married | Unmarried |
| 15 to 19 years | 0 (0.0%) | 0 (0.0%) |
| 20 to 34 years | 216 (100.0%) | 0 (0.0%) |
| 35 to 50 years | 15 (100.0%) | 0 (0.0%) |
| Total | 231 (100.0%) | 0 (0.0%) |
Fertility by Education in Blackhawk
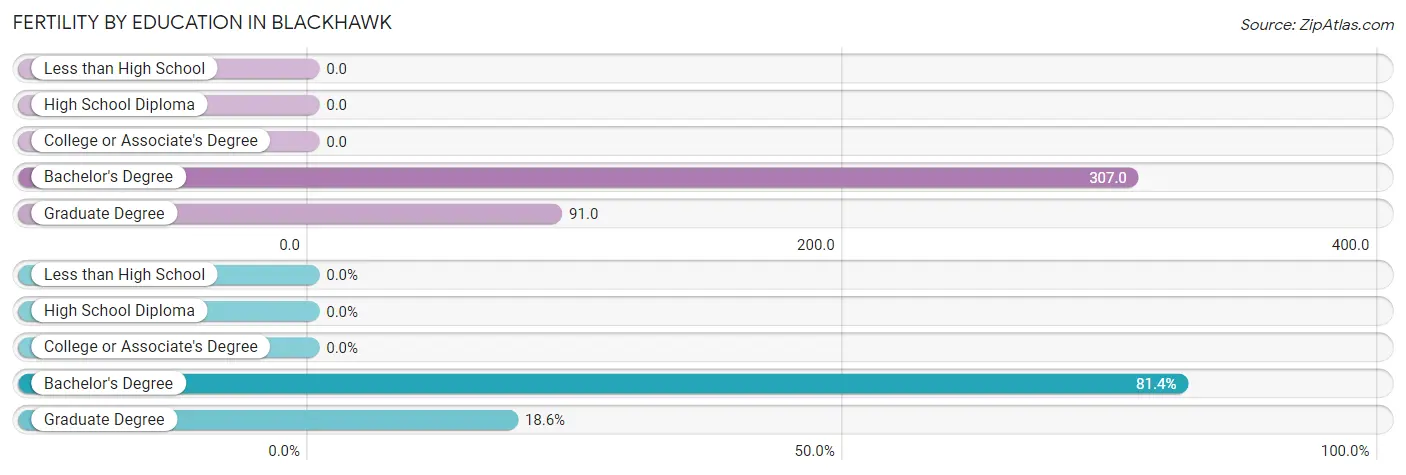
| Educational Attainment | Women with Births | Births / 1,000 Women |
| Less than High School | 0 (0.0%) | 0.0 |
| High School Diploma | 0 (0.0%) | 0.0 |
| College or Associate's Degree | 0 (0.0%) | 0.0 |
| Bachelor's Degree | 188 (81.4%) | 307.0 |
| Graduate Degree | 43 (18.6%) | 91.0 |
| Total | 231 (100.0%) | 126.0 |
Fertility by Education by Marriage Status in Blackhawk
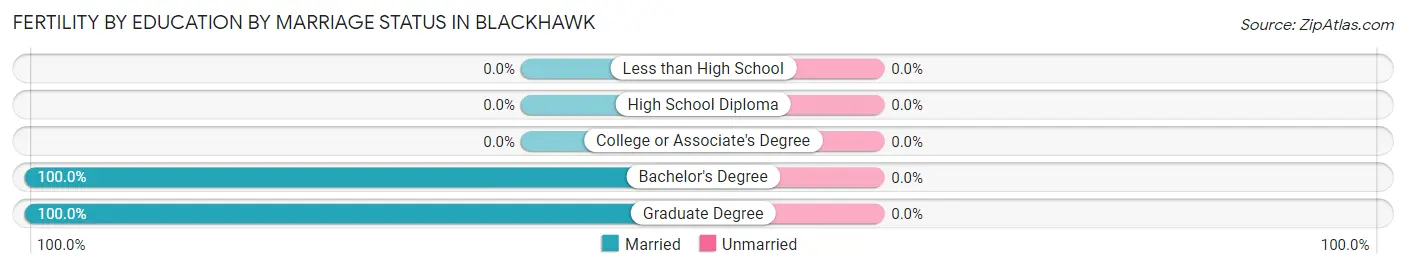
| Educational Attainment | Married | Unmarried |
| Less than High School | 0 (0.0%) | 0 (0.0%) |
| High School Diploma | 0 (0.0%) | 0 (0.0%) |
| College or Associate's Degree | 0 (0.0%) | 0 (0.0%) |
| Bachelor's Degree | 188 (100.0%) | 0 (0.0%) |
| Graduate Degree | 43 (100.0%) | 0 (0.0%) |
| Total | 231 (100.0%) | 0 (0.0%) |
Employment Characteristics in Blackhawk
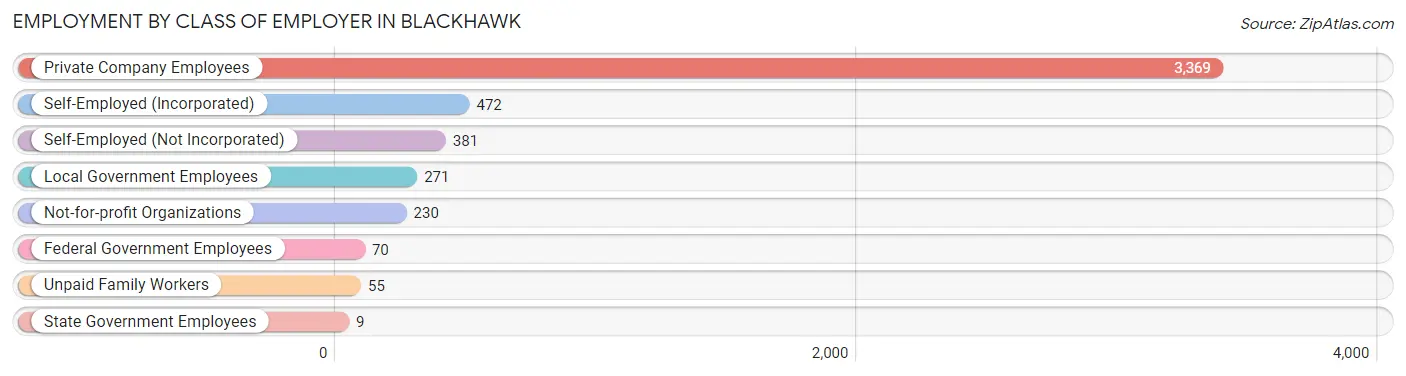
Employment by Class of Employer in Blackhawk
Among the 4,857 employed individuals in Blackhawk, private company employees (3,369 | 69.4%), self-employed (incorporated) (472 | 9.7%), and self-employed (not incorporated) (381 | 7.8%) make up the most common classes of employment.
| Employer Class | # Employees | % Employees |
| Private Company Employees | 3,369 | 69.4% |
| Self-Employed (Incorporated) | 472 | 9.7% |
| Self-Employed (Not Incorporated) | 381 | 7.8% |
| Not-for-profit Organizations | 230 | 4.7% |
| Local Government Employees | 271 | 5.6% |
| State Government Employees | 9 | 0.2% |
| Federal Government Employees | 70 | 1.4% |
| Unpaid Family Workers | 55 | 1.1% |
| Total | 4,857 | 100.0% |
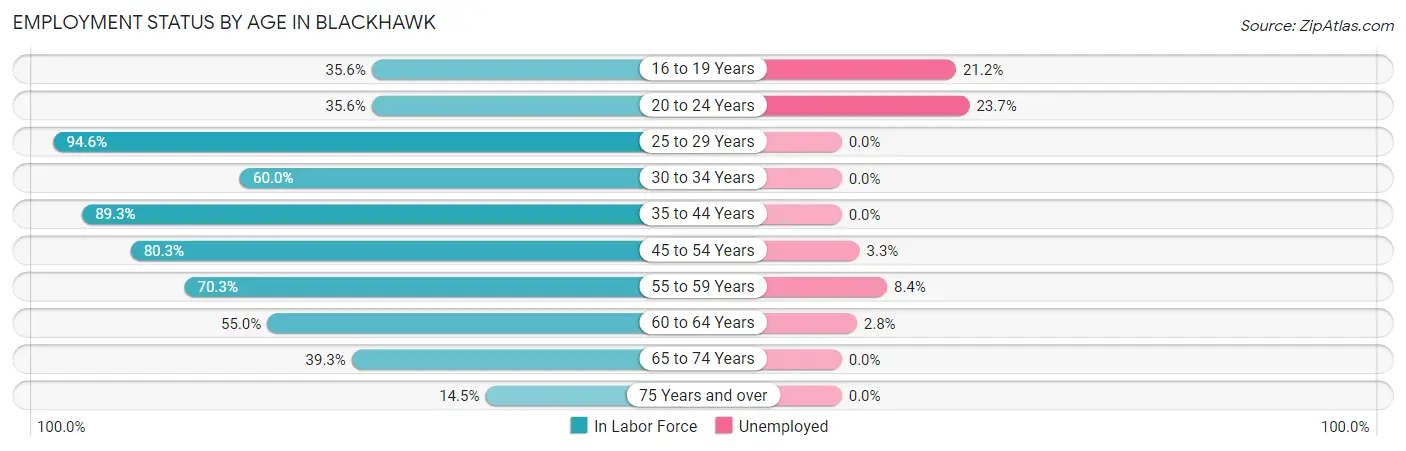
Employment Status by Age in Blackhawk
According to the labor force statistics for Blackhawk, out of the total population over 16 years of age (9,190), 57.2% or 5,257 individuals are in the labor force, with 3.9% or 205 of them unemployed. The age group with the highest labor force participation rate is 25 to 29 years, with 94.6% or 504 individuals in the labor force. Within the labor force, the 20 to 24 years age range has the highest percentage of unemployed individuals, with 23.7% or 42 of them being unemployed.
| Age Bracket | In Labor Force | Unemployed |
| 16 to 19 Years | 236 (35.6%) | 50 (21.2%) |
| 20 to 24 Years | 177 (35.6%) | 42 (23.7%) |
| 25 to 29 Years | 504 (94.6%) | 0 (0.0%) |
| 30 to 34 Years | 274 (60.0%) | 0 (0.0%) |
| 35 to 44 Years | 827 (89.3%) | 0 (0.0%) |
| 45 to 54 Years | 1,196 (80.3%) | 39 (3.3%) |
| 55 to 59 Years | 705 (70.3%) | 59 (8.4%) |
| 60 to 64 Years | 535 (55.0%) | 15 (2.8%) |
| 65 to 74 Years | 665 (39.3%) | 0 (0.0%) |
| 75 Years and over | 139 (14.5%) | 0 (0.0%) |
| Total | 5,257 (57.2%) | 205 (3.9%) |
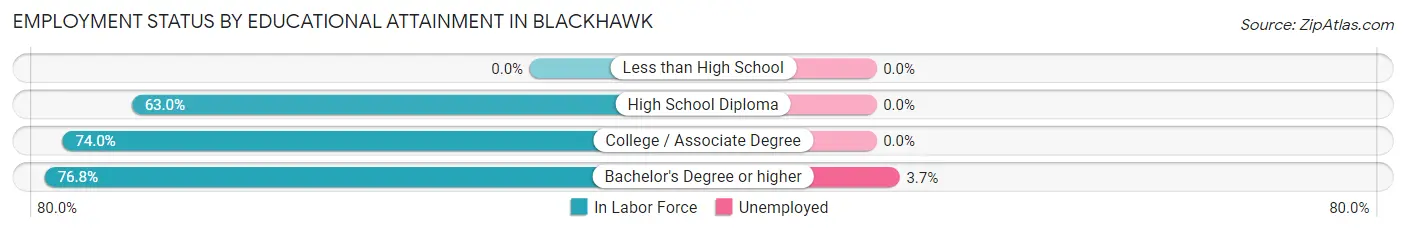
Employment Status by Educational Attainment in Blackhawk
According to labor force statistics for Blackhawk, 75.1% of individuals (4,041) out of the total population between 25 and 64 years of age (5,381) are in the labor force, with 2.8% or 113 of them being unemployed. The group with the highest labor force participation rate are those with the educational attainment of bachelor's degree or higher, with 76.8% or 3,054 individuals in the labor force. Within the labor force, individuals with bachelor's degree or higher education have the highest percentage of unemployment, with 3.7% or 113 of them being unemployed.
| Educational Attainment | In Labor Force | Unemployed |
| Less than High School | 0 (0.0%) | 0 (0.0%) |
| High School Diploma | 290 (63.0%) | 0 (0.0%) |
| College / Associate Degree | 699 (74.0%) | 0 (0.0%) |
| Bachelor's Degree or higher | 3,054 (76.8%) | 147 (3.7%) |
| Total | 4,041 (75.1%) | 151 (2.8%) |
Employment Occupations by Sex in Blackhawk
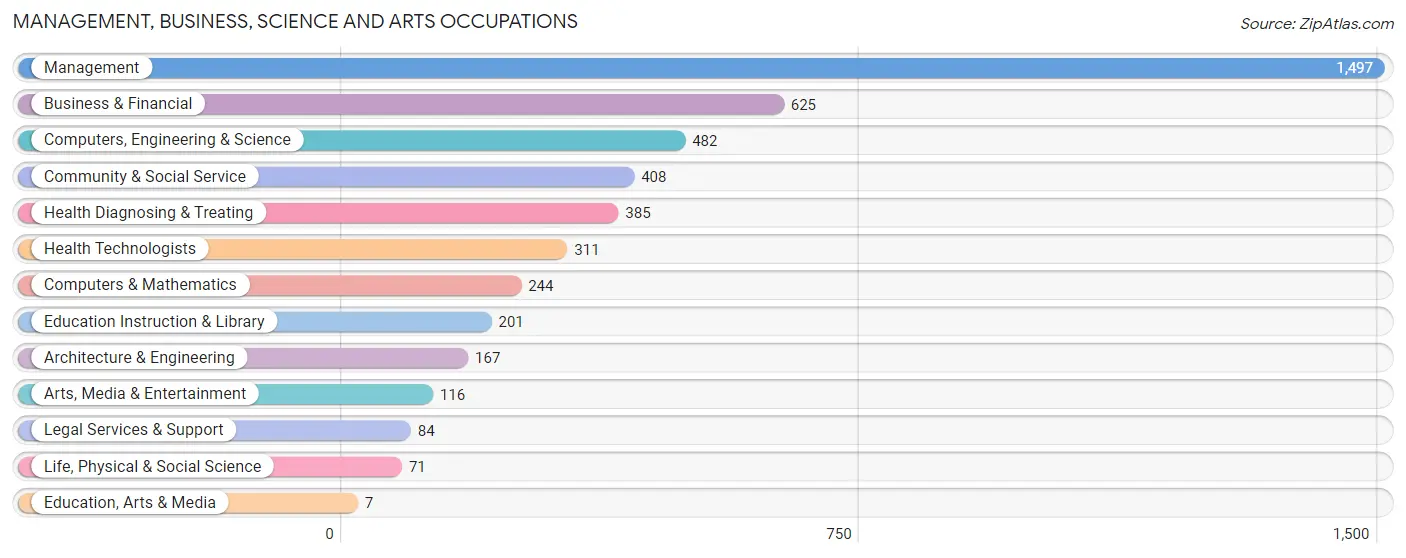
Management, Business, Science and Arts Occupations
The most common Management, Business, Science and Arts occupations in Blackhawk are Management (1,497 | 29.6%), Business & Financial (625 | 12.4%), Computers, Engineering & Science (482 | 9.5%), Community & Social Service (408 | 8.1%), and Health Diagnosing & Treating (385 | 7.6%).
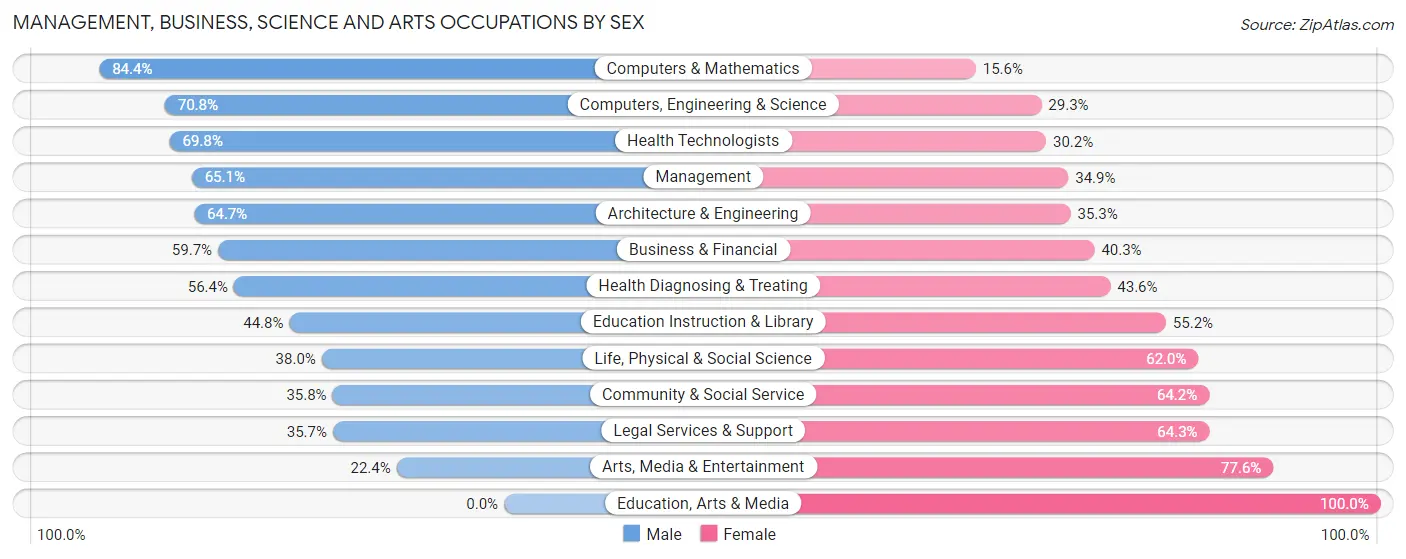
Management, Business, Science and Arts Occupations by Sex
Within the Management, Business, Science and Arts occupations in Blackhawk, the most male-oriented occupations are Computers & Mathematics (84.4%), Computers, Engineering & Science (70.8%), and Health Technologists (69.8%), while the most female-oriented occupations are Education, Arts & Media (100.0%), Arts, Media & Entertainment (77.6%), and Legal Services & Support (64.3%).
| Occupation | Male | Female |
| Management | 975 (65.1%) | 522 (34.9%) |
| Business & Financial | 373 (59.7%) | 252 (40.3%) |
| Computers, Engineering & Science | 341 (70.8%) | 141 (29.2%) |
| Computers & Mathematics | 206 (84.4%) | 38 (15.6%) |
| Architecture & Engineering | 108 (64.7%) | 59 (35.3%) |
| Life, Physical & Social Science | 27 (38.0%) | 44 (62.0%) |
| Community & Social Service | 146 (35.8%) | 262 (64.2%) |
| Education, Arts & Media | 0 (0.0%) | 7 (100.0%) |
| Legal Services & Support | 30 (35.7%) | 54 (64.3%) |
| Education Instruction & Library | 90 (44.8%) | 111 (55.2%) |
| Arts, Media & Entertainment | 26 (22.4%) | 90 (77.6%) |
| Health Diagnosing & Treating | 217 (56.4%) | 168 (43.6%) |
| Health Technologists | 217 (69.8%) | 94 (30.2%) |
| Total (Category) | 2,052 (60.4%) | 1,345 (39.6%) |
| Total (Overall) | 3,047 (60.3%) | 2,008 (39.7%) |
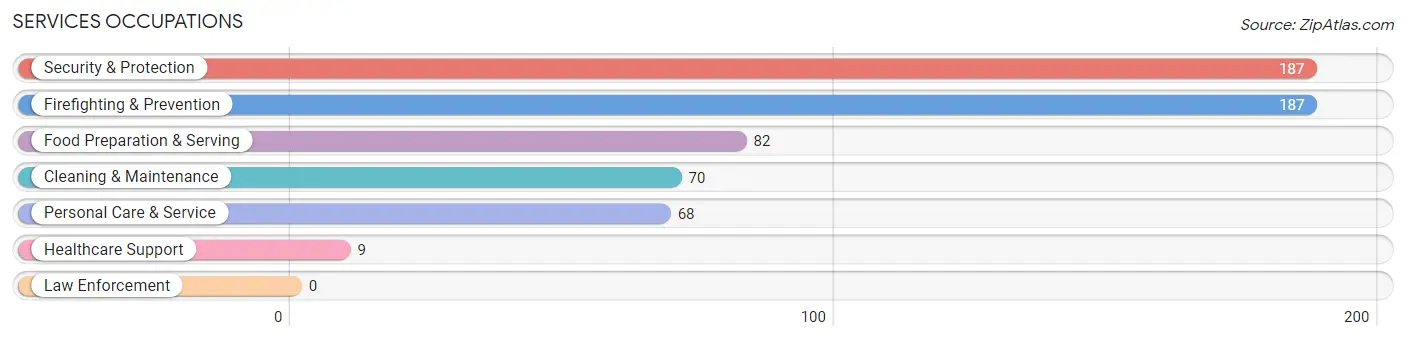
Services Occupations
The most common Services occupations in Blackhawk are Security & Protection (187 | 3.7%), Firefighting & Prevention (187 | 3.7%), Food Preparation & Serving (82 | 1.6%), Cleaning & Maintenance (70 | 1.4%), and Personal Care & Service (68 | 1.3%).
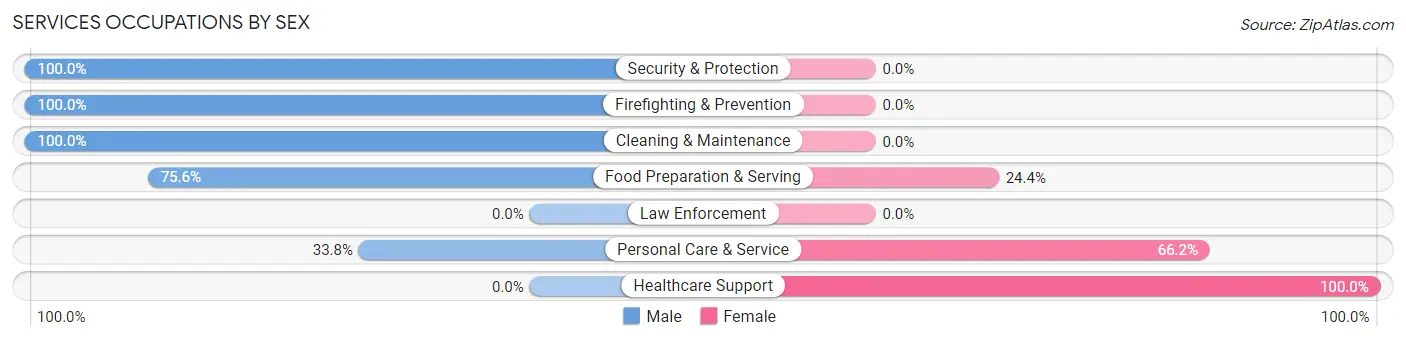
Services Occupations by Sex
Within the Services occupations in Blackhawk, the most male-oriented occupations are Security & Protection (100.0%), Firefighting & Prevention (100.0%), and Cleaning & Maintenance (100.0%), while the most female-oriented occupations are Healthcare Support (100.0%), Personal Care & Service (66.2%), and Food Preparation & Serving (24.4%).
| Occupation | Male | Female |
| Healthcare Support | 0 (0.0%) | 9 (100.0%) |
| Security & Protection | 187 (100.0%) | 0 (0.0%) |
| Firefighting & Prevention | 187 (100.0%) | 0 (0.0%) |
| Law Enforcement | 0 (0.0%) | 0 (0.0%) |
| Food Preparation & Serving | 62 (75.6%) | 20 (24.4%) |
| Cleaning & Maintenance | 70 (100.0%) | 0 (0.0%) |
| Personal Care & Service | 23 (33.8%) | 45 (66.2%) |
| Total (Category) | 342 (82.2%) | 74 (17.8%) |
| Total (Overall) | 3,047 (60.3%) | 2,008 (39.7%) |
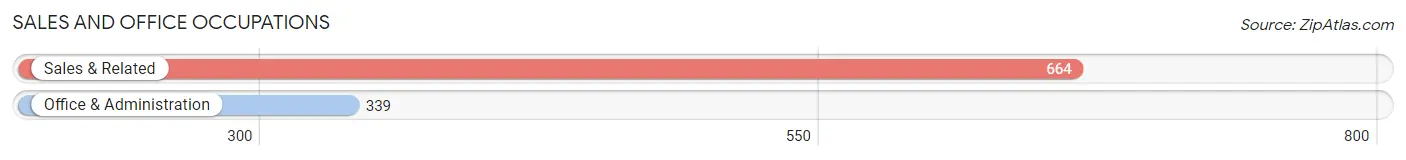
Sales and Office Occupations
The most common Sales and Office occupations in Blackhawk are Sales & Related (664 | 13.1%), and Office & Administration (339 | 6.7%).
Sales and Office Occupations by Sex
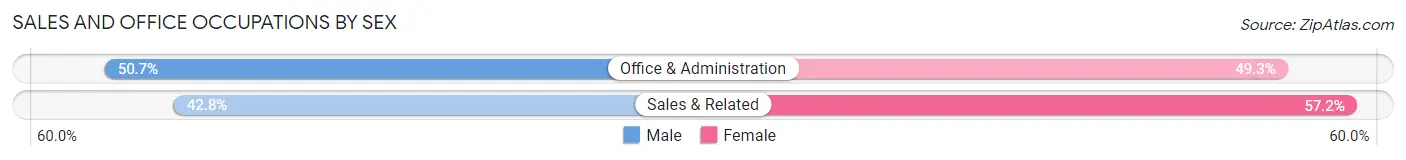
| Occupation | Male | Female |
| Sales & Related | 284 (42.8%) | 380 (57.2%) |
| Office & Administration | 172 (50.7%) | 167 (49.3%) |
| Total (Category) | 456 (45.5%) | 547 (54.5%) |
| Total (Overall) | 3,047 (60.3%) | 2,008 (39.7%) |
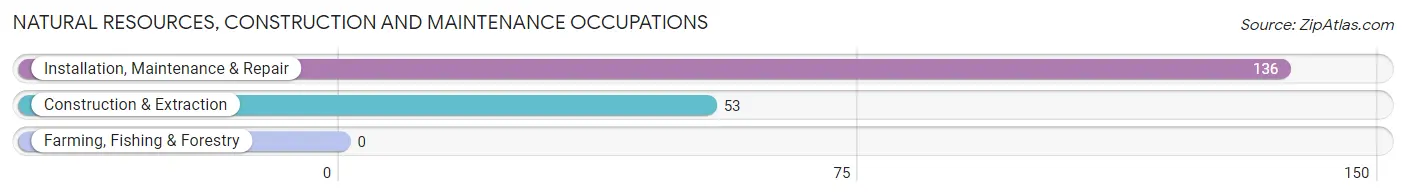
Natural Resources, Construction and Maintenance Occupations
The most common Natural Resources, Construction and Maintenance occupations in Blackhawk are Installation, Maintenance & Repair (136 | 2.7%), and Construction & Extraction (53 | 1.1%).
Natural Resources, Construction and Maintenance Occupations by Sex
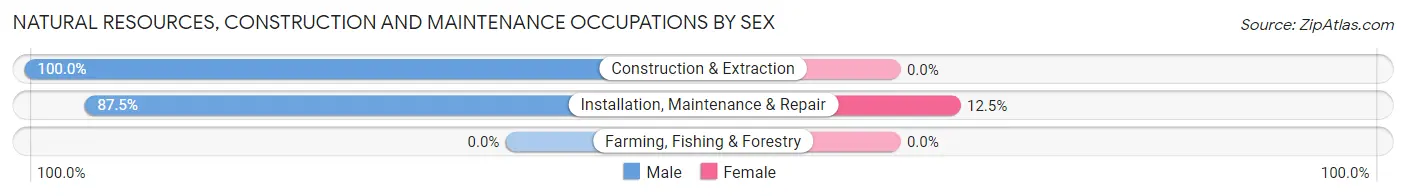
| Occupation | Male | Female |
| Farming, Fishing & Forestry | 0 (0.0%) | 0 (0.0%) |
| Construction & Extraction | 53 (100.0%) | 0 (0.0%) |
| Installation, Maintenance & Repair | 119 (87.5%) | 17 (12.5%) |
| Total (Category) | 172 (91.0%) | 17 (9.0%) |
| Total (Overall) | 3,047 (60.3%) | 2,008 (39.7%) |
Production, Transportation and Moving Occupations
The most common Production, Transportation and Moving occupations in Blackhawk are Transportation (27 | 0.5%), Production (14 | 0.3%), and Material Moving (9 | 0.2%).
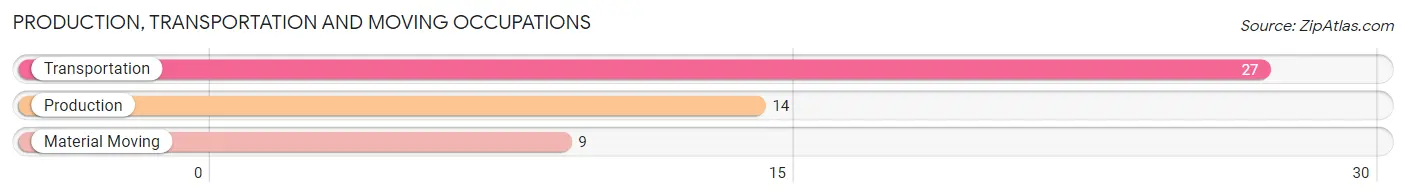
Production, Transportation and Moving Occupations by Sex
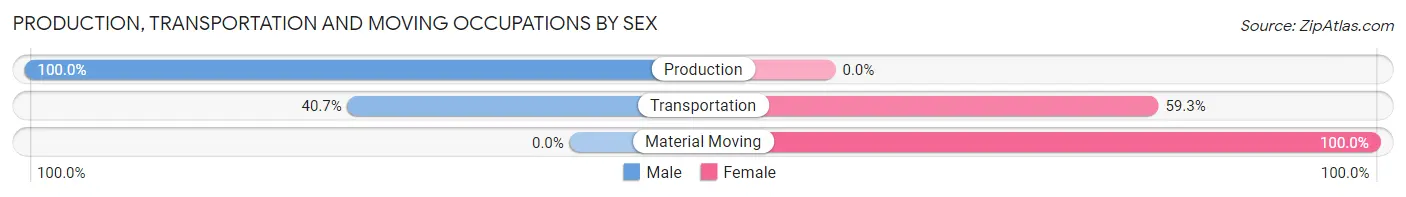
| Occupation | Male | Female |
| Production | 14 (100.0%) | 0 (0.0%) |
| Transportation | 11 (40.7%) | 16 (59.3%) |
| Material Moving | 0 (0.0%) | 9 (100.0%) |
| Total (Category) | 25 (50.0%) | 25 (50.0%) |
| Total (Overall) | 3,047 (60.3%) | 2,008 (39.7%) |
Employment Industries by Sex in Blackhawk
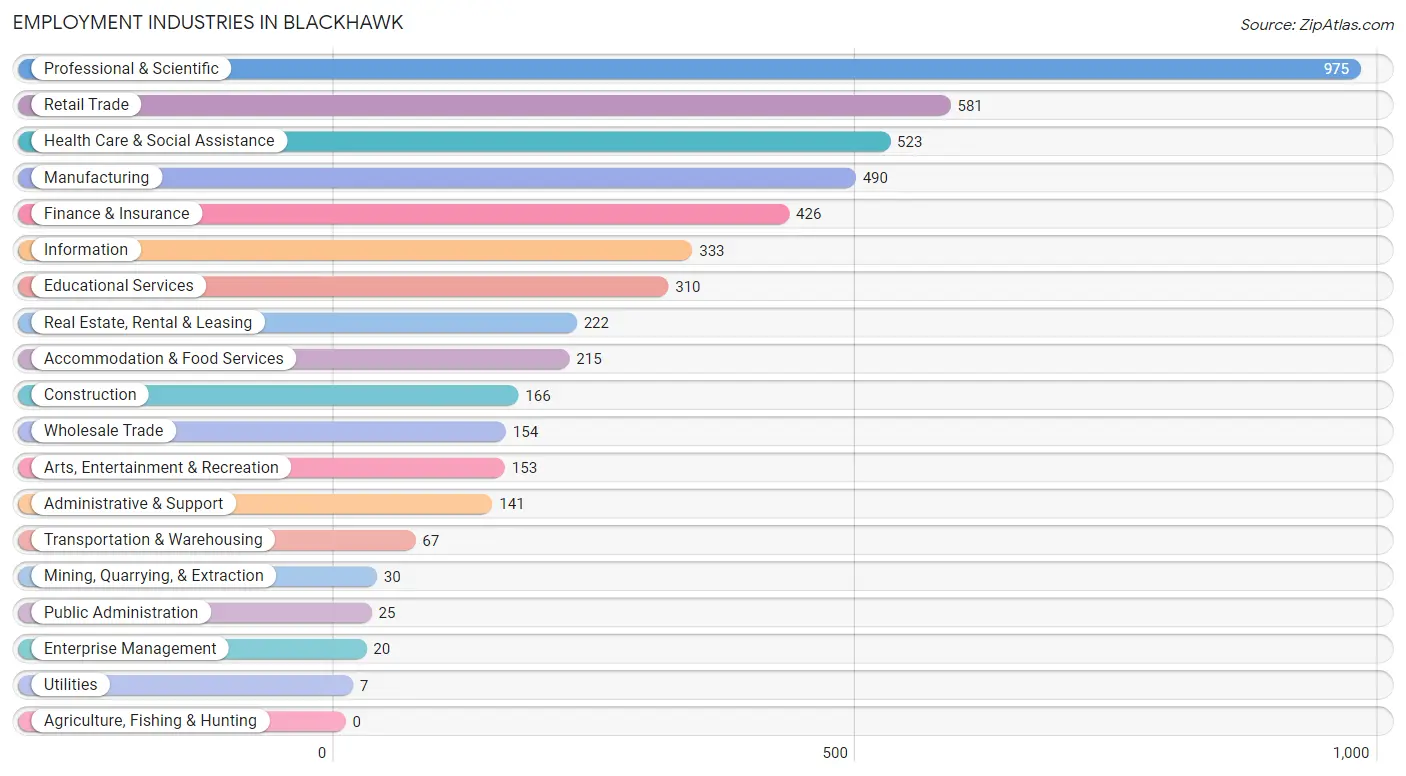
Employment Industries in Blackhawk
The major employment industries in Blackhawk include Professional & Scientific (975 | 19.3%), Retail Trade (581 | 11.5%), Health Care & Social Assistance (523 | 10.3%), Manufacturing (490 | 9.7%), and Finance & Insurance (426 | 8.4%).
Employment Industries by Sex in Blackhawk
The Blackhawk industries that see more men than women are Transportation & Warehousing (91.0%), Wholesale Trade (79.2%), and Information (79.0%), whereas the industries that tend to have a higher number of women are Utilities (100.0%), Arts, Entertainment & Recreation (70.6%), and Educational Services (56.5%).
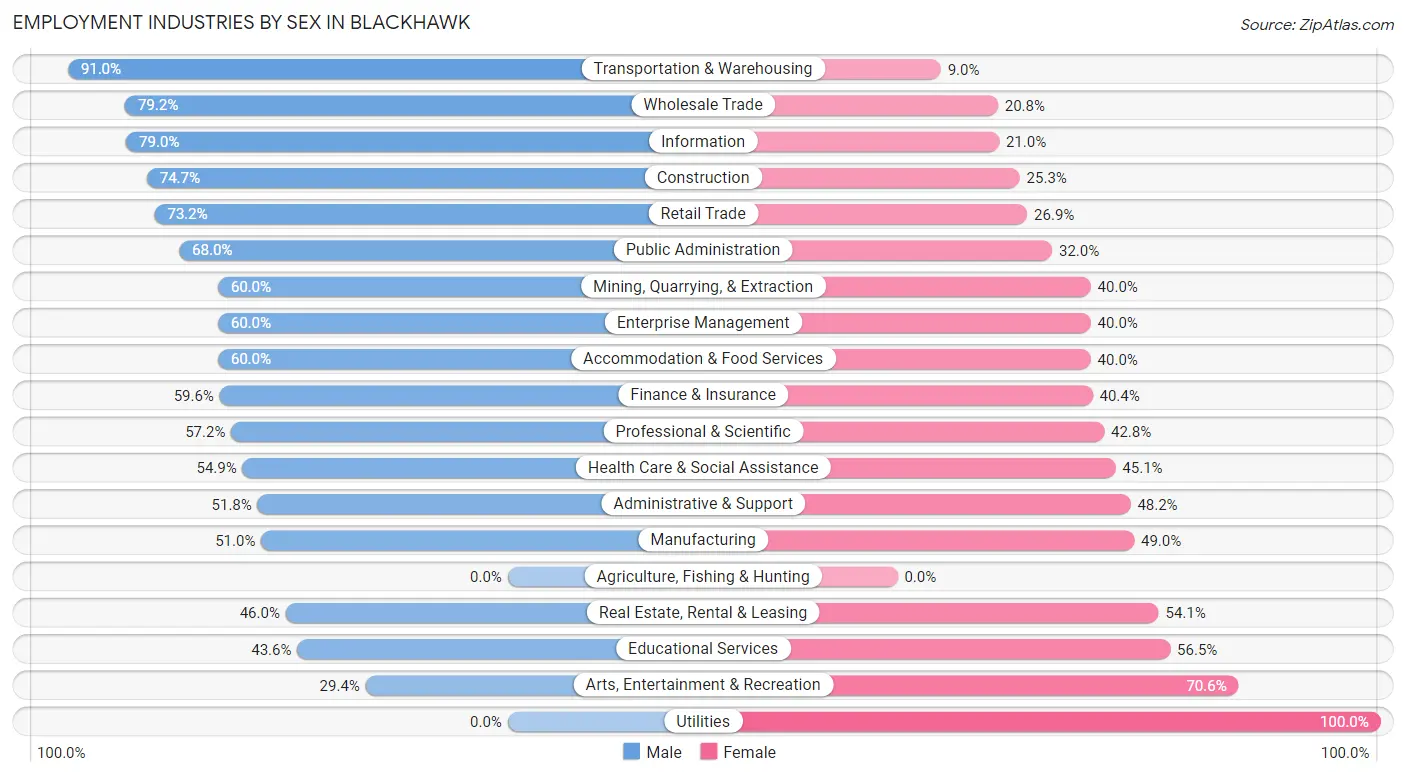
| Industry | Male | Female |
| Agriculture, Fishing & Hunting | 0 (0.0%) | 0 (0.0%) |
| Mining, Quarrying, & Extraction | 18 (60.0%) | 12 (40.0%) |
| Construction | 124 (74.7%) | 42 (25.3%) |
| Manufacturing | 250 (51.0%) | 240 (49.0%) |
| Wholesale Trade | 122 (79.2%) | 32 (20.8%) |
| Retail Trade | 425 (73.2%) | 156 (26.9%) |
| Transportation & Warehousing | 61 (91.0%) | 6 (9.0%) |
| Utilities | 0 (0.0%) | 7 (100.0%) |
| Information | 263 (79.0%) | 70 (21.0%) |
| Finance & Insurance | 254 (59.6%) | 172 (40.4%) |
| Real Estate, Rental & Leasing | 102 (46.0%) | 120 (54.0%) |
| Professional & Scientific | 558 (57.2%) | 417 (42.8%) |
| Enterprise Management | 12 (60.0%) | 8 (40.0%) |
| Administrative & Support | 73 (51.8%) | 68 (48.2%) |
| Educational Services | 135 (43.5%) | 175 (56.5%) |
| Health Care & Social Assistance | 287 (54.9%) | 236 (45.1%) |
| Arts, Entertainment & Recreation | 45 (29.4%) | 108 (70.6%) |
| Accommodation & Food Services | 129 (60.0%) | 86 (40.0%) |
| Public Administration | 17 (68.0%) | 8 (32.0%) |
| Total | 3,047 (60.3%) | 2,008 (39.7%) |
Education in Blackhawk
School Enrollment in Blackhawk
The most common levels of schooling among the 2,282 students in Blackhawk are high school (703 | 30.8%), college / undergraduate (579 | 25.4%), and middle school (483 | 21.2%).
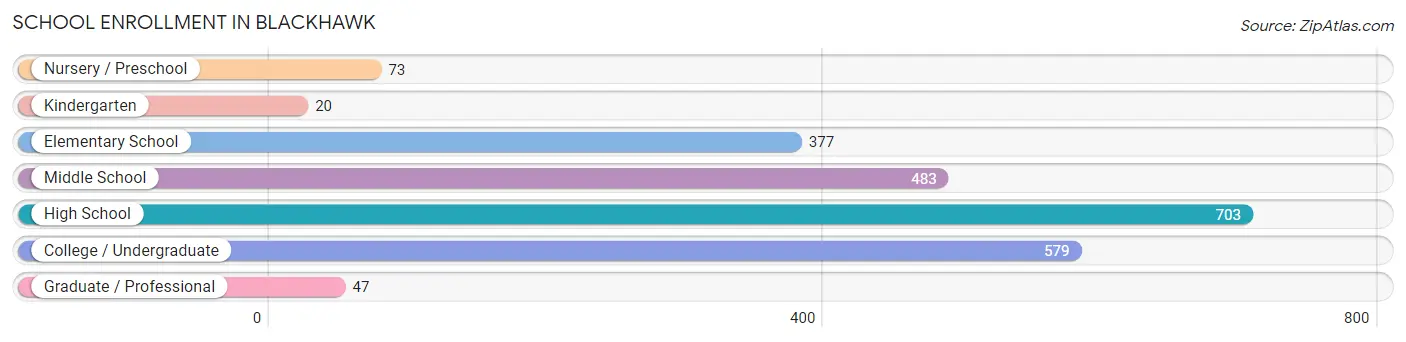
| School Level | # Students | % Students |
| Nursery / Preschool | 73 | 3.2% |
| Kindergarten | 20 | 0.9% |
| Elementary School | 377 | 16.5% |
| Middle School | 483 | 21.2% |
| High School | 703 | 30.8% |
| College / Undergraduate | 579 | 25.4% |
| Graduate / Professional | 47 | 2.1% |
| Total | 2,282 | 100.0% |
School Enrollment by Age by Funding Source in Blackhawk
Out of a total of 2,282 students who are enrolled in schools in Blackhawk, 753 (33.0%) attend a private institution, while the remaining 1,529 (67.0%) are enrolled in public schools. The age group of 3 to 4 year olds has the highest likelihood of being enrolled in private schools, with 63 (100.0% in the age bracket) enrolled. Conversely, the age group of 10 to 14 year olds has the lowest likelihood of being enrolled in a private school, with 447 (79.7% in the age bracket) attending a public institution.
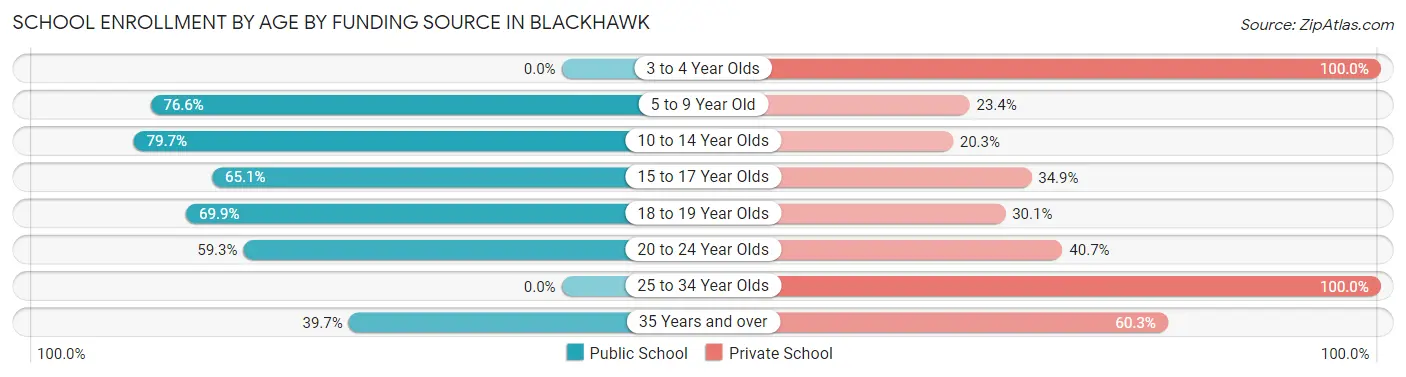
| Age Bracket | Public School | Private School |
| 3 to 4 Year Olds | 0 (0.0%) | 63 (100.0%) |
| 5 to 9 Year Old | 258 (76.6%) | 79 (23.4%) |
| 10 to 14 Year Olds | 447 (79.7%) | 114 (20.3%) |
| 15 to 17 Year Olds | 337 (65.1%) | 181 (34.9%) |
| 18 to 19 Year Olds | 223 (69.9%) | 96 (30.1%) |
| 20 to 24 Year Olds | 240 (59.3%) | 165 (40.7%) |
| 25 to 34 Year Olds | 0 (0.0%) | 21 (100.0%) |
| 35 Years and over | 23 (39.7%) | 35 (60.3%) |
| Total | 1,529 (67.0%) | 753 (33.0%) |
Educational Attainment by Field of Study in Blackhawk
Business (1,382 | 22.9%), engineering (669 | 11.1%), bio, nature & agricultural (608 | 10.1%), communications (512 | 8.5%), and education (389 | 6.5%) are the most common fields of study among 6,035 individuals in Blackhawk who have obtained a bachelor's degree or higher.
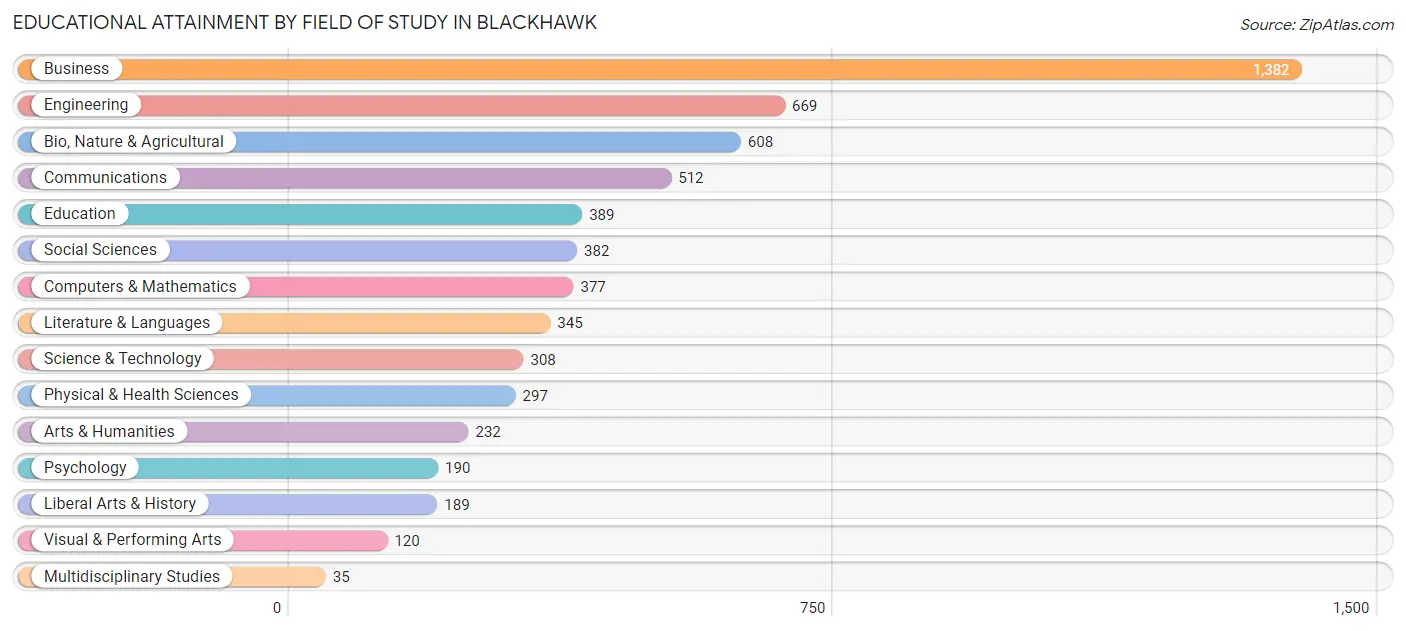
| Field of Study | # Graduates | % Graduates |
| Computers & Mathematics | 377 | 6.2% |
| Bio, Nature & Agricultural | 608 | 10.1% |
| Physical & Health Sciences | 297 | 4.9% |
| Psychology | 190 | 3.2% |
| Social Sciences | 382 | 6.3% |
| Engineering | 669 | 11.1% |
| Multidisciplinary Studies | 35 | 0.6% |
| Science & Technology | 308 | 5.1% |
| Business | 1,382 | 22.9% |
| Education | 389 | 6.5% |
| Literature & Languages | 345 | 5.7% |
| Liberal Arts & History | 189 | 3.1% |
| Visual & Performing Arts | 120 | 2.0% |
| Communications | 512 | 8.5% |
| Arts & Humanities | 232 | 3.8% |
| Total | 6,035 | 100.0% |
Transportation & Commute in Blackhawk
Vehicle Availability by Sex in Blackhawk
The most prevalent vehicle ownership categories in Blackhawk are males with 2 vehicles (1,270, accounting for 43.8%) and females with 2 vehicles (818, making up 64.9%).
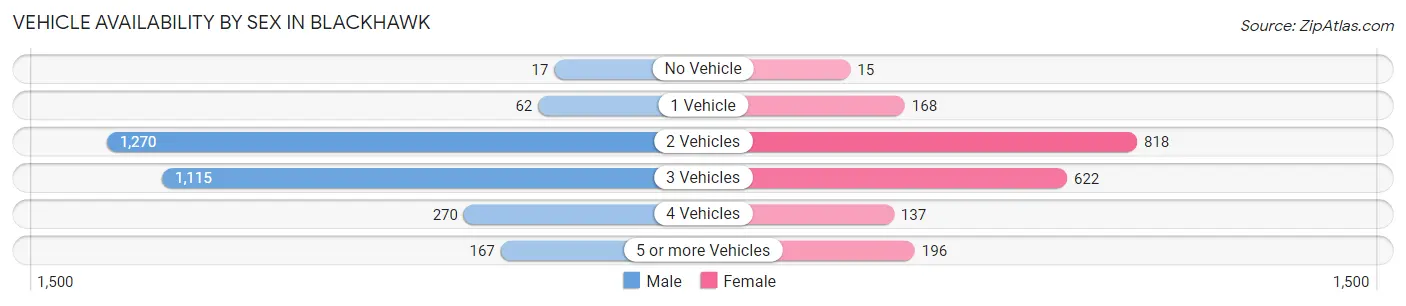
| Vehicles Available | Male | Female |
| No Vehicle | 17 (0.6%) | 15 (0.8%) |
| 1 Vehicle | 62 (2.1%) | 168 (8.6%) |
| 2 Vehicles | 1,270 (43.8%) | 818 (41.8%) |
| 3 Vehicles | 1,115 (38.4%) | 622 (31.8%) |
| 4 Vehicles | 270 (9.3%) | 137 (7.0%) |
| 5 or more Vehicles | 167 (5.8%) | 196 (10.0%) |
| Total | 2,901 (100.0%) | 1,956 (100.0%) |
Commute Time in Blackhawk
The most frequently occuring commute durations in Blackhawk are 60 to 89 minutes (556 commuters, 17.2%), 90 or more minutes (384 commuters, 11.9%), and 15 to 19 minutes (369 commuters, 11.4%).
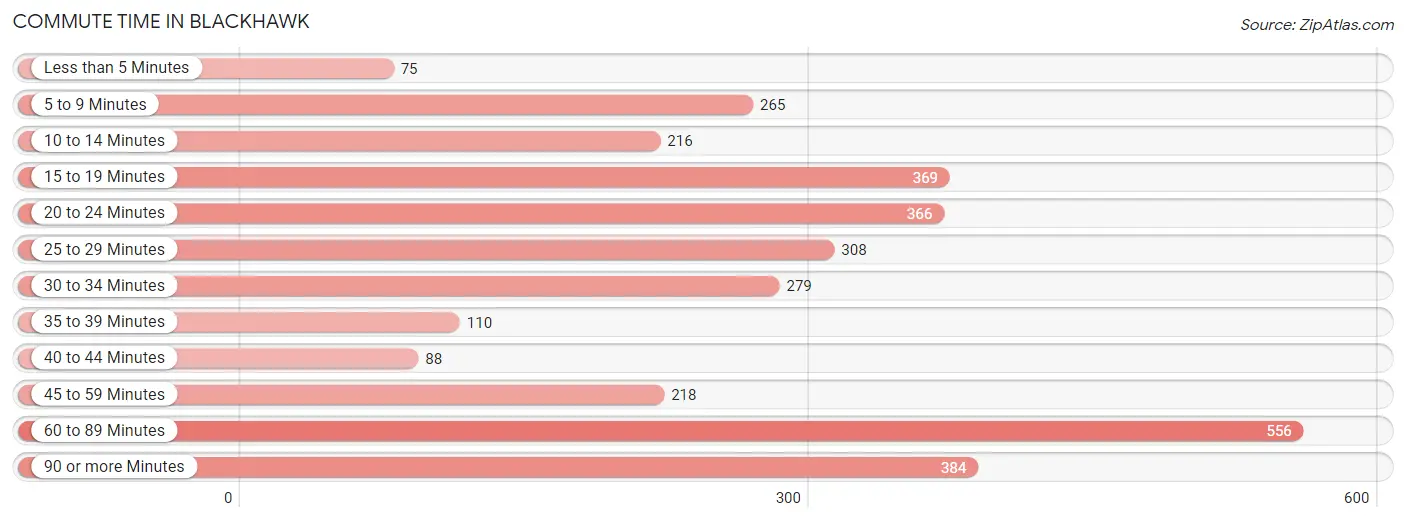
| Commute Time | # Commuters | % Commuters |
| Less than 5 Minutes | 75 | 2.3% |
| 5 to 9 Minutes | 265 | 8.2% |
| 10 to 14 Minutes | 216 | 6.7% |
| 15 to 19 Minutes | 369 | 11.4% |
| 20 to 24 Minutes | 366 | 11.3% |
| 25 to 29 Minutes | 308 | 9.5% |
| 30 to 34 Minutes | 279 | 8.6% |
| 35 to 39 Minutes | 110 | 3.4% |
| 40 to 44 Minutes | 88 | 2.7% |
| 45 to 59 Minutes | 218 | 6.7% |
| 60 to 89 Minutes | 556 | 17.2% |
| 90 or more Minutes | 384 | 11.9% |
Commute Time by Sex in Blackhawk
The most common commute times in Blackhawk are 60 to 89 minutes (407 commuters, 20.1%) for males and 15 to 19 minutes (202 commuters, 16.8%) for females.
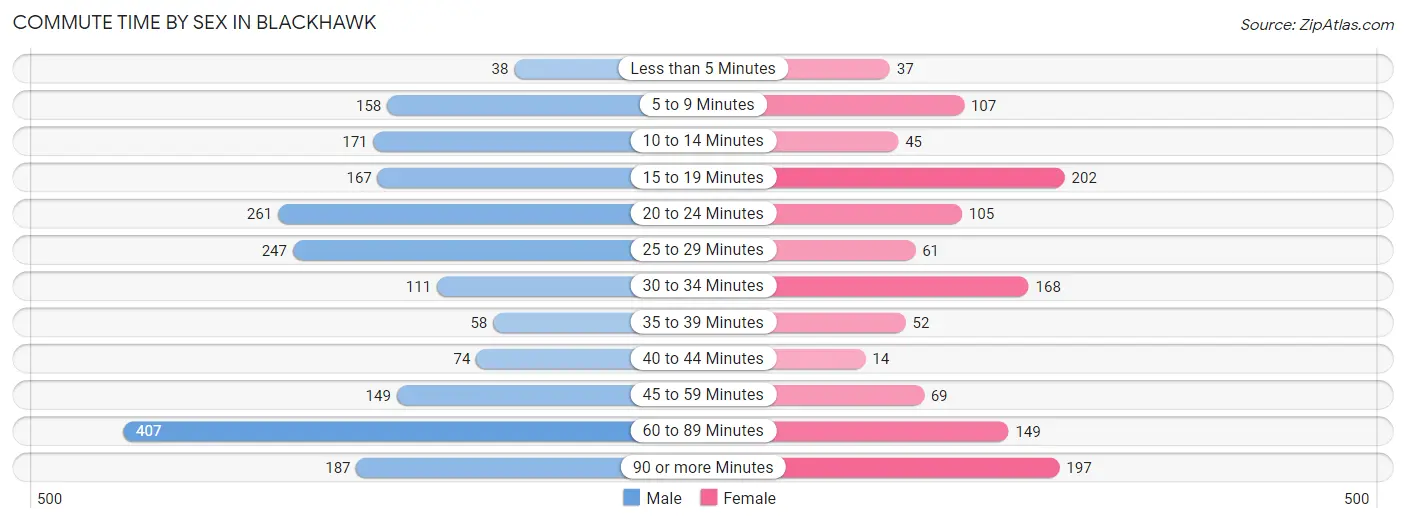
| Commute Time | Male | Female |
| Less than 5 Minutes | 38 (1.9%) | 37 (3.1%) |
| 5 to 9 Minutes | 158 (7.8%) | 107 (8.9%) |
| 10 to 14 Minutes | 171 (8.4%) | 45 (3.7%) |
| 15 to 19 Minutes | 167 (8.2%) | 202 (16.8%) |
| 20 to 24 Minutes | 261 (12.9%) | 105 (8.7%) |
| 25 to 29 Minutes | 247 (12.2%) | 61 (5.1%) |
| 30 to 34 Minutes | 111 (5.5%) | 168 (13.9%) |
| 35 to 39 Minutes | 58 (2.9%) | 52 (4.3%) |
| 40 to 44 Minutes | 74 (3.6%) | 14 (1.2%) |
| 45 to 59 Minutes | 149 (7.3%) | 69 (5.7%) |
| 60 to 89 Minutes | 407 (20.1%) | 149 (12.3%) |
| 90 or more Minutes | 187 (9.2%) | 197 (16.3%) |
Time of Departure to Work by Sex in Blackhawk
The most frequent times of departure to work in Blackhawk are 7:00 AM to 7:29 AM (325, 16.0%) for males and 8:00 AM to 8:29 AM (243, 20.2%) for females.
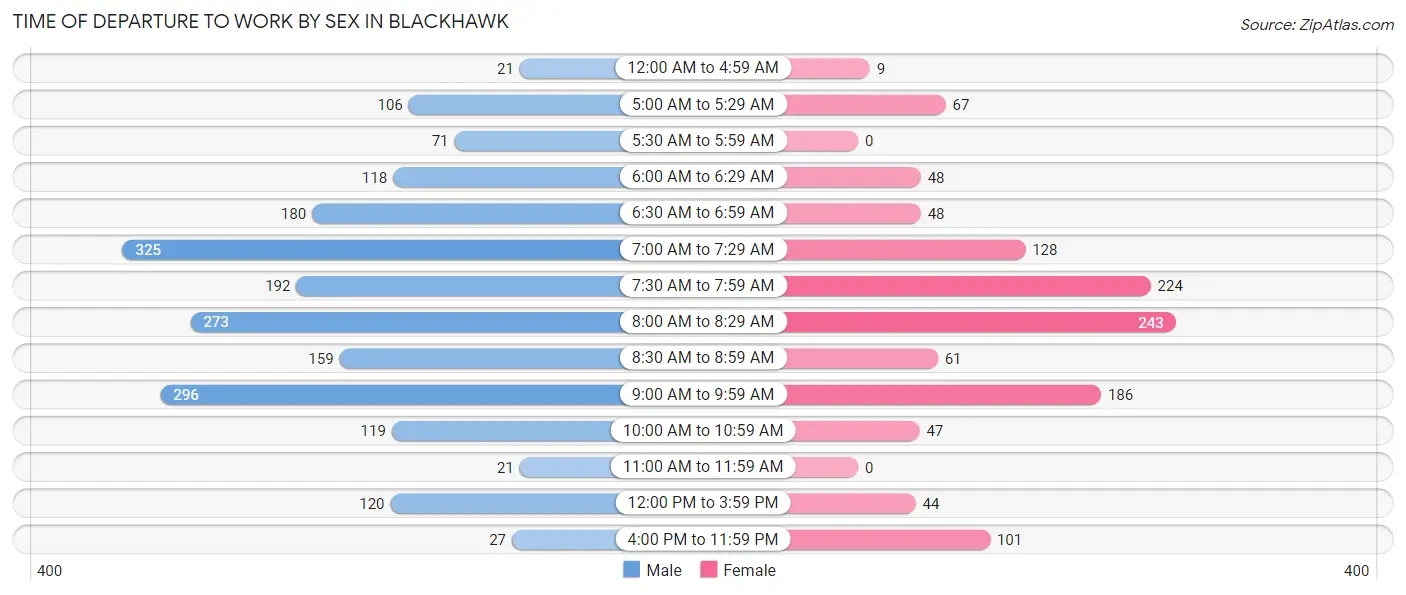
| Time of Departure | Male | Female |
| 12:00 AM to 4:59 AM | 21 (1.0%) | 9 (0.7%) |
| 5:00 AM to 5:29 AM | 106 (5.2%) | 67 (5.6%) |
| 5:30 AM to 5:59 AM | 71 (3.5%) | 0 (0.0%) |
| 6:00 AM to 6:29 AM | 118 (5.8%) | 48 (4.0%) |
| 6:30 AM to 6:59 AM | 180 (8.9%) | 48 (4.0%) |
| 7:00 AM to 7:29 AM | 325 (16.0%) | 128 (10.6%) |
| 7:30 AM to 7:59 AM | 192 (9.5%) | 224 (18.6%) |
| 8:00 AM to 8:29 AM | 273 (13.5%) | 243 (20.2%) |
| 8:30 AM to 8:59 AM | 159 (7.8%) | 61 (5.1%) |
| 9:00 AM to 9:59 AM | 296 (14.6%) | 186 (15.4%) |
| 10:00 AM to 10:59 AM | 119 (5.9%) | 47 (3.9%) |
| 11:00 AM to 11:59 AM | 21 (1.0%) | 0 (0.0%) |
| 12:00 PM to 3:59 PM | 120 (5.9%) | 44 (3.6%) |
| 4:00 PM to 11:59 PM | 27 (1.3%) | 101 (8.4%) |
| Total | 2,028 (100.0%) | 1,206 (100.0%) |
Housing Occupancy in Blackhawk
Occupancy by Ownership in Blackhawk
Of the total 3,918 dwellings in Blackhawk, owner-occupied units account for 3,450 (88.1%), while renter-occupied units make up 468 (11.9%).
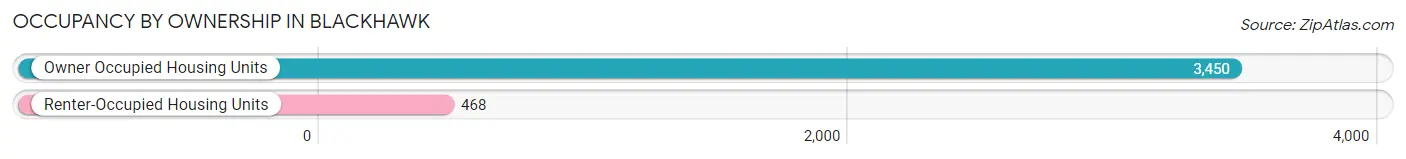
| Occupancy | # Housing Units | % Housing Units |
| Owner Occupied Housing Units | 3,450 | 88.1% |
| Renter-Occupied Housing Units | 468 | 11.9% |
| Total Occupied Housing Units | 3,918 | 100.0% |
Occupancy by Household Size in Blackhawk
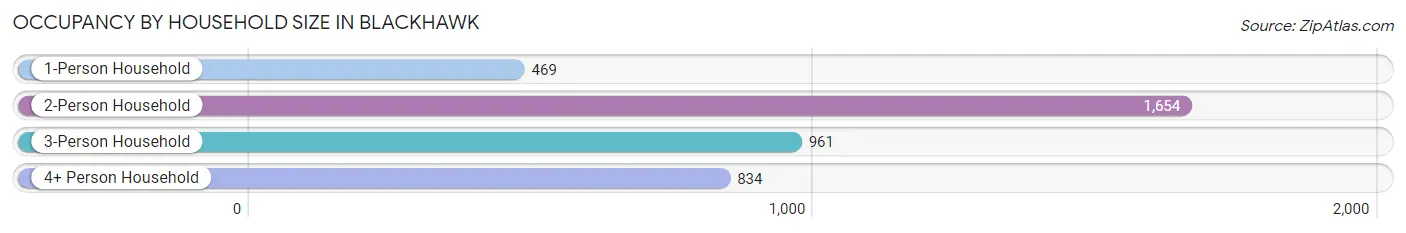
| Household Size | # Housing Units | % Housing Units |
| 1-Person Household | 469 | 12.0% |
| 2-Person Household | 1,654 | 42.2% |
| 3-Person Household | 961 | 24.5% |
| 4+ Person Household | 834 | 21.3% |
| Total Housing Units | 3,918 | 100.0% |
Occupancy by Ownership by Household Size in Blackhawk
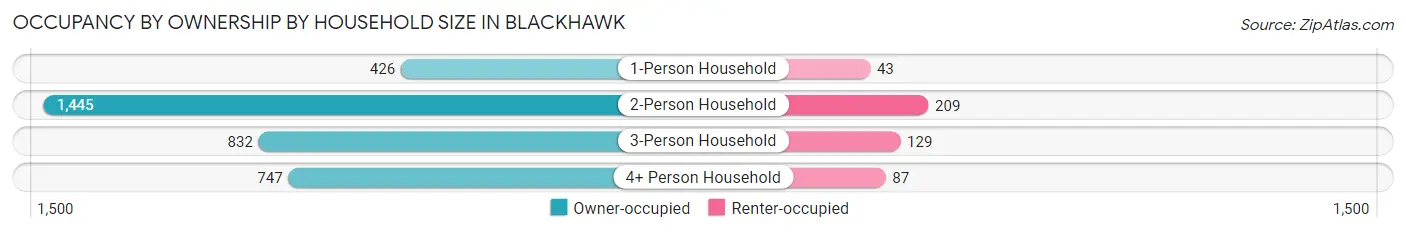
| Household Size | Owner-occupied | Renter-occupied |
| 1-Person Household | 426 (90.8%) | 43 (9.2%) |
| 2-Person Household | 1,445 (87.4%) | 209 (12.6%) |
| 3-Person Household | 832 (86.6%) | 129 (13.4%) |
| 4+ Person Household | 747 (89.6%) | 87 (10.4%) |
| Total Housing Units | 3,450 (88.1%) | 468 (11.9%) |
Occupancy by Educational Attainment in Blackhawk
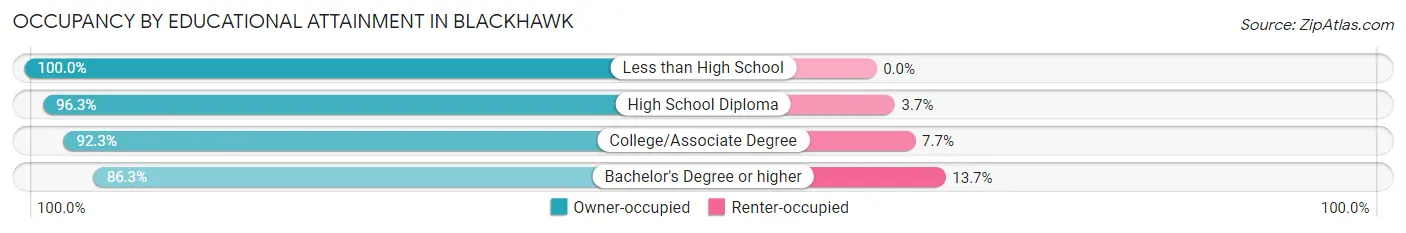
| Household Size | Owner-occupied | Renter-occupied |
| Less than High School | 45 (100.0%) | 0 (0.0%) |
| High School Diploma | 236 (96.3%) | 9 (3.7%) |
| College/Associate Degree | 597 (92.3%) | 50 (7.7%) |
| Bachelor's Degree or higher | 2,572 (86.3%) | 409 (13.7%) |
Occupancy by Age of Householder in Blackhawk
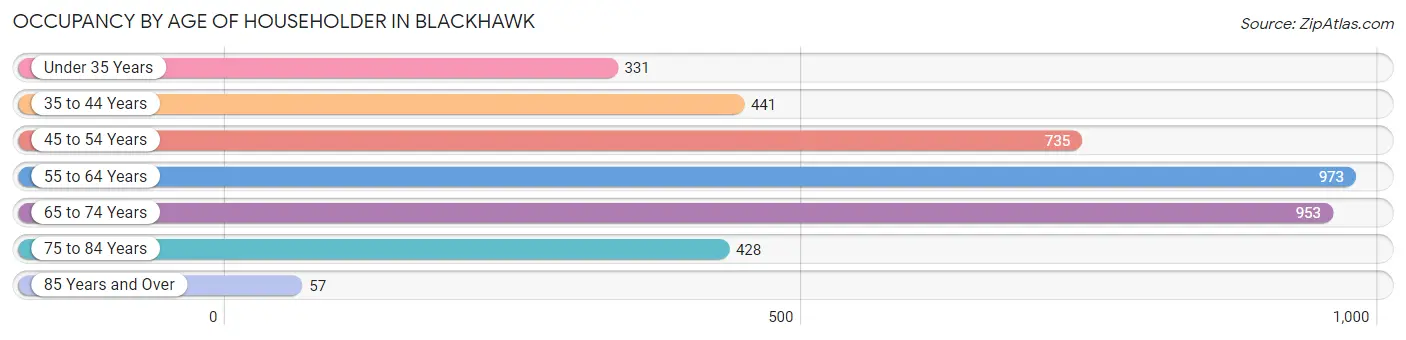
| Age Bracket | # Households | % Households |
| Under 35 Years | 331 | 8.5% |
| 35 to 44 Years | 441 | 11.3% |
| 45 to 54 Years | 735 | 18.8% |
| 55 to 64 Years | 973 | 24.8% |
| 65 to 74 Years | 953 | 24.3% |
| 75 to 84 Years | 428 | 10.9% |
| 85 Years and Over | 57 | 1.5% |
| Total | 3,918 | 100.0% |
Housing Finances in Blackhawk
Median Income by Occupancy in Blackhawk
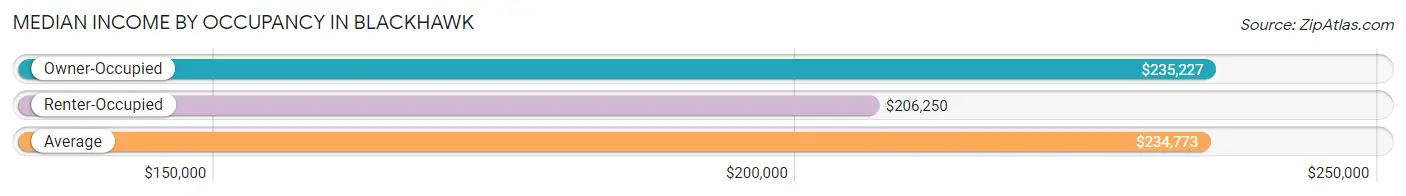
| Occupancy Type | # Households | Median Income |
| Owner-Occupied | 3,450 (88.1%) | $235,227 |
| Renter-Occupied | 468 (11.9%) | $206,250 |
| Average | 3,918 (100.0%) | $234,773 |
Occupancy by Householder Income Bracket in Blackhawk
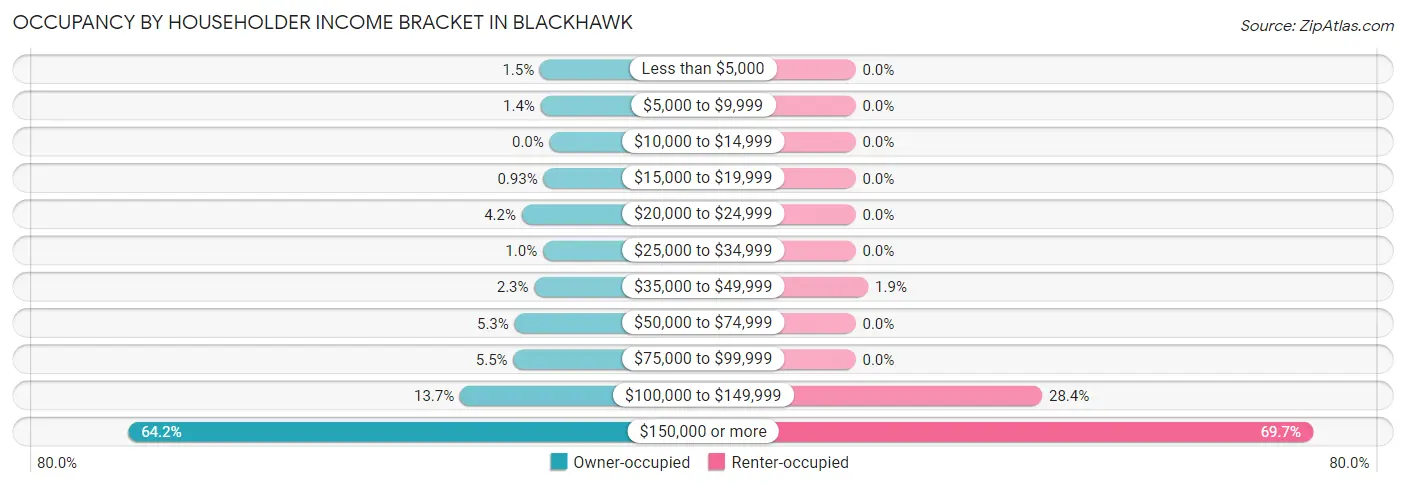
| Income Bracket | Owner-occupied | Renter-occupied |
| Less than $5,000 | 50 (1.5%) | 0 (0.0%) |
| $5,000 to $9,999 | 47 (1.4%) | 0 (0.0%) |
| $10,000 to $14,999 | 0 (0.0%) | 0 (0.0%) |
| $15,000 to $19,999 | 32 (0.9%) | 0 (0.0%) |
| $20,000 to $24,999 | 146 (4.2%) | 0 (0.0%) |
| $25,000 to $34,999 | 35 (1.0%) | 0 (0.0%) |
| $35,000 to $49,999 | 80 (2.3%) | 9 (1.9%) |
| $50,000 to $74,999 | 184 (5.3%) | 0 (0.0%) |
| $75,000 to $99,999 | 190 (5.5%) | 0 (0.0%) |
| $100,000 to $149,999 | 471 (13.7%) | 133 (28.4%) |
| $150,000 or more | 2,215 (64.2%) | 326 (69.7%) |
| Total | 3,450 (100.0%) | 468 (100.0%) |
Monthly Housing Cost Tiers in Blackhawk
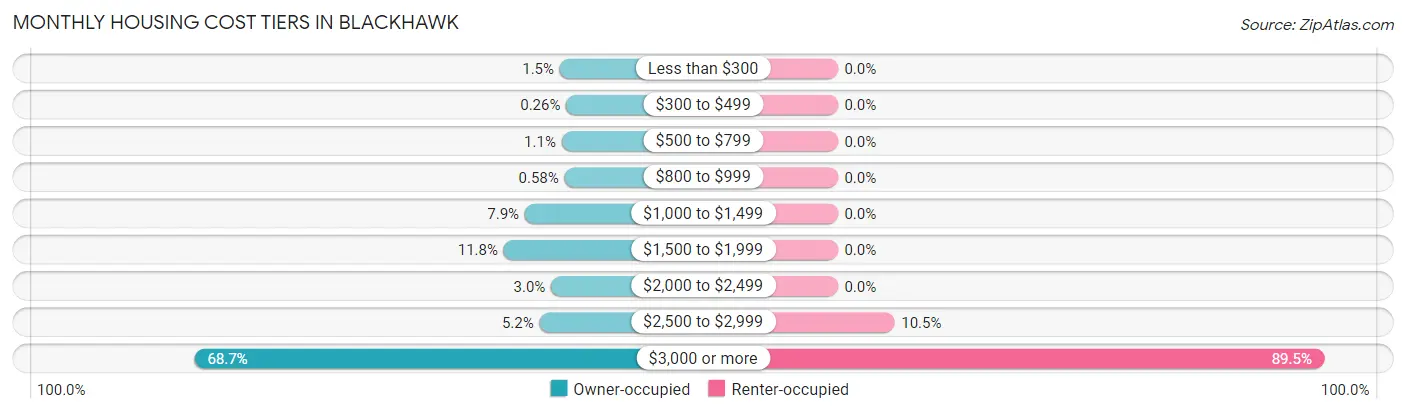
| Monthly Cost | Owner-occupied | Renter-occupied |
| Less than $300 | 50 (1.5%) | 0 (0.0%) |
| $300 to $499 | 9 (0.3%) | 0 (0.0%) |
| $500 to $799 | 38 (1.1%) | 0 (0.0%) |
| $800 to $999 | 20 (0.6%) | 0 (0.0%) |
| $1,000 to $1,499 | 272 (7.9%) | 0 (0.0%) |
| $1,500 to $1,999 | 406 (11.8%) | 0 (0.0%) |
| $2,000 to $2,499 | 105 (3.0%) | 0 (0.0%) |
| $2,500 to $2,999 | 179 (5.2%) | 49 (10.5%) |
| $3,000 or more | 2,371 (68.7%) | 419 (89.5%) |
| Total | 3,450 (100.0%) | 468 (100.0%) |
Physical Housing Characteristics in Blackhawk
Housing Structures in Blackhawk
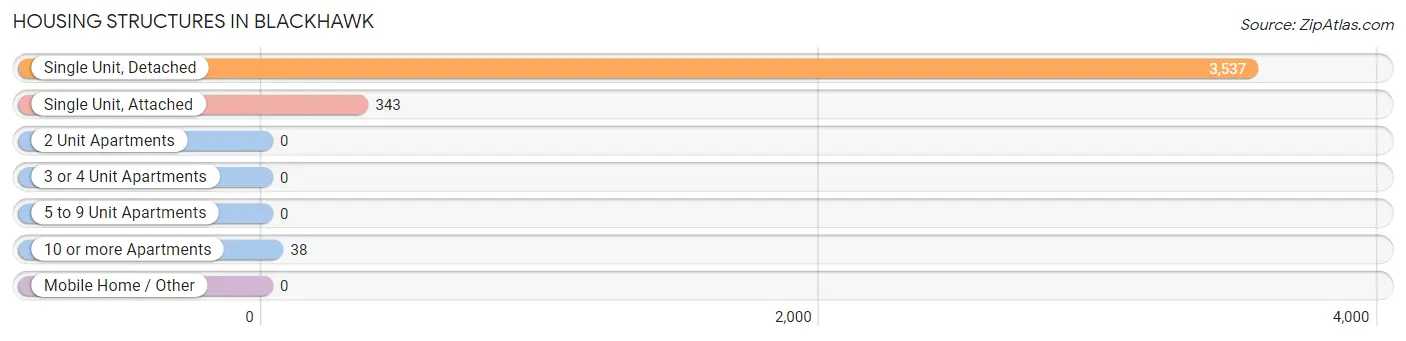
| Structure Type | # Housing Units | % Housing Units |
| Single Unit, Detached | 3,537 | 90.3% |
| Single Unit, Attached | 343 | 8.7% |
| 2 Unit Apartments | 0 | 0.0% |
| 3 or 4 Unit Apartments | 0 | 0.0% |
| 5 to 9 Unit Apartments | 0 | 0.0% |
| 10 or more Apartments | 38 | 1.0% |
| Mobile Home / Other | 0 | 0.0% |
| Total | 3,918 | 100.0% |
Housing Structures by Occupancy in Blackhawk
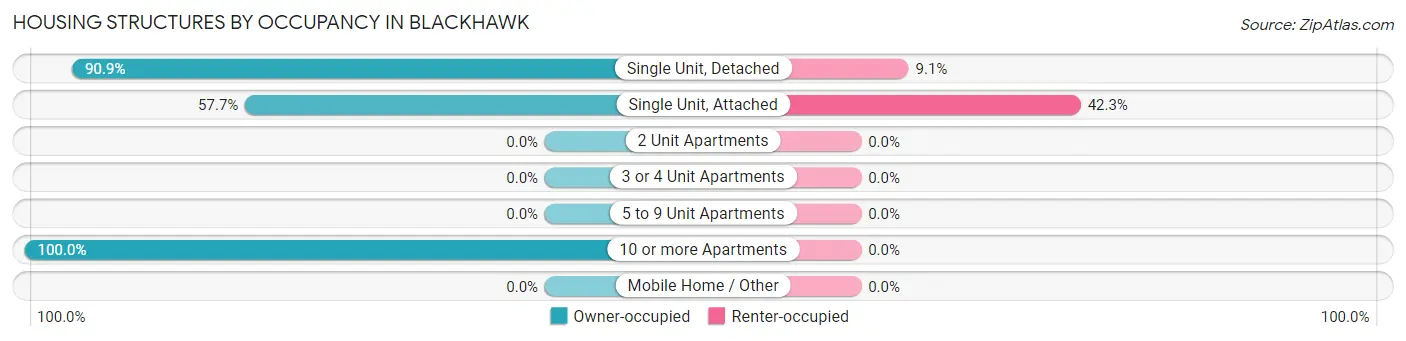
| Structure Type | Owner-occupied | Renter-occupied |
| Single Unit, Detached | 3,214 (90.9%) | 323 (9.1%) |
| Single Unit, Attached | 198 (57.7%) | 145 (42.3%) |
| 2 Unit Apartments | 0 (0.0%) | 0 (0.0%) |
| 3 or 4 Unit Apartments | 0 (0.0%) | 0 (0.0%) |
| 5 to 9 Unit Apartments | 0 (0.0%) | 0 (0.0%) |
| 10 or more Apartments | 38 (100.0%) | 0 (0.0%) |
| Mobile Home / Other | 0 (0.0%) | 0 (0.0%) |
| Total | 3,450 (88.1%) | 468 (11.9%) |
Housing Structures by Number of Rooms in Blackhawk
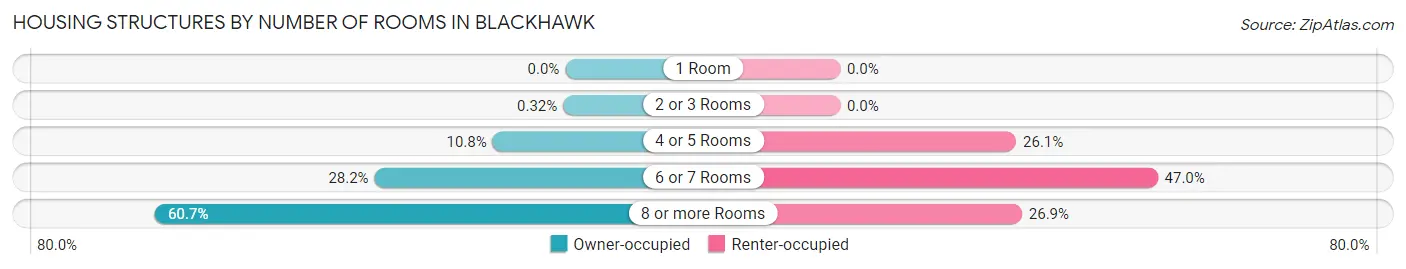
| Number of Rooms | Owner-occupied | Renter-occupied |
| 1 Room | 0 (0.0%) | 0 (0.0%) |
| 2 or 3 Rooms | 11 (0.3%) | 0 (0.0%) |
| 4 or 5 Rooms | 371 (10.7%) | 122 (26.1%) |
| 6 or 7 Rooms | 974 (28.2%) | 220 (47.0%) |
| 8 or more Rooms | 2,094 (60.7%) | 126 (26.9%) |
| Total | 3,450 (100.0%) | 468 (100.0%) |
Housing Structure by Heating Type in Blackhawk
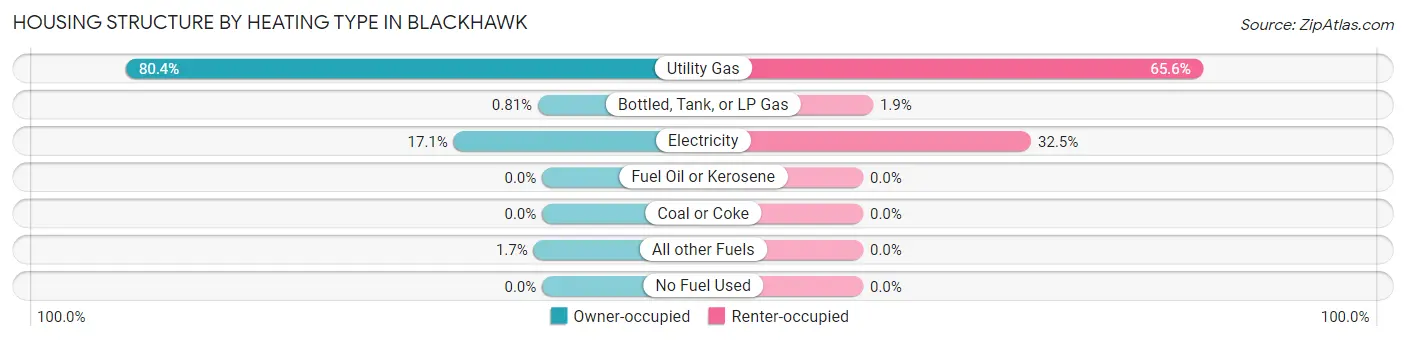
| Heating Type | Owner-occupied | Renter-occupied |
| Utility Gas | 2,775 (80.4%) | 307 (65.6%) |
| Bottled, Tank, or LP Gas | 28 (0.8%) | 9 (1.9%) |
| Electricity | 590 (17.1%) | 152 (32.5%) |
| Fuel Oil or Kerosene | 0 (0.0%) | 0 (0.0%) |
| Coal or Coke | 0 (0.0%) | 0 (0.0%) |
| All other Fuels | 57 (1.7%) | 0 (0.0%) |
| No Fuel Used | 0 (0.0%) | 0 (0.0%) |
| Total | 3,450 (100.0%) | 468 (100.0%) |
Household Vehicle Usage in Blackhawk
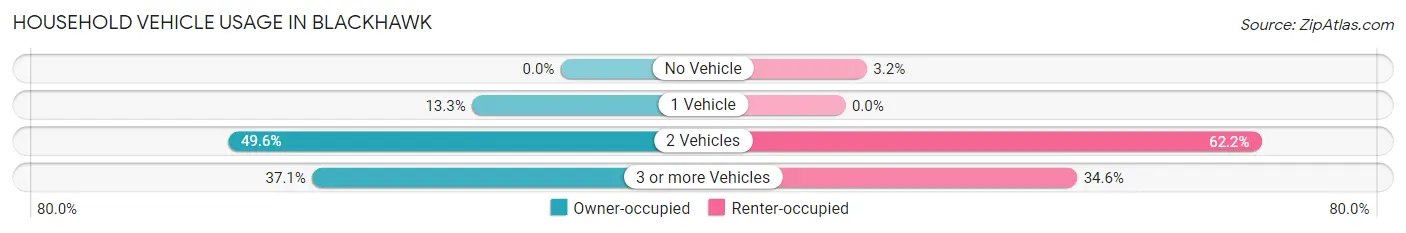
| Vehicles per Household | Owner-occupied | Renter-occupied |
| No Vehicle | 0 (0.0%) | 15 (3.2%) |
| 1 Vehicle | 457 (13.3%) | 0 (0.0%) |
| 2 Vehicles | 1,712 (49.6%) | 291 (62.2%) |
| 3 or more Vehicles | 1,281 (37.1%) | 162 (34.6%) |
| Total | 3,450 (100.0%) | 468 (100.0%) |
Real Estate & Mortgages in Blackhawk
Real Estate and Mortgage Overview in Blackhawk
| Characteristic | Without Mortgage | With Mortgage |
| Housing Units | 1,026 | 2,424 |
| Median Property Value | $1,706,900 | $1,686,000 |
| Median Household Income | $144,875 | $1,703 |
| Monthly Housing Costs | $1,501 | $2,213 |
| Real Estate Taxes | $10,001 | $0 |
Property Value by Mortgage Status in Blackhawk
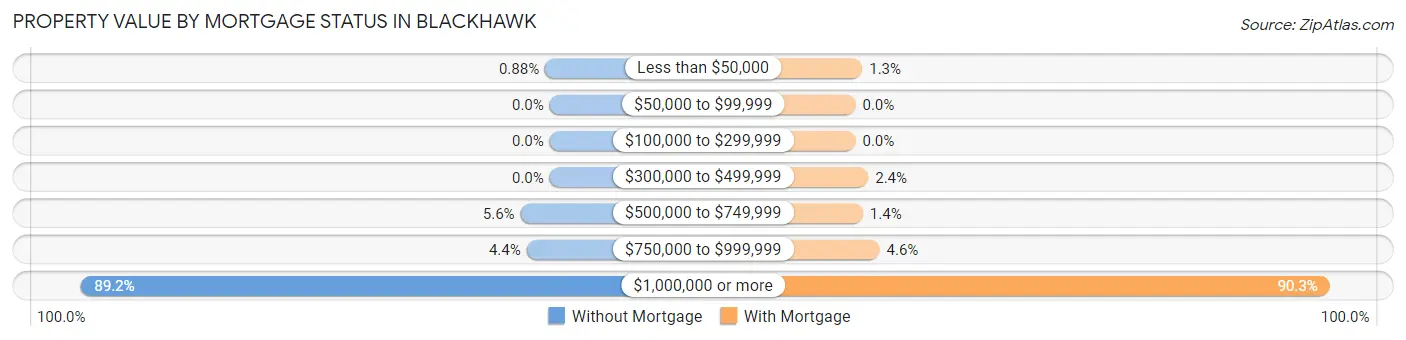
| Property Value | Without Mortgage | With Mortgage |
| Less than $50,000 | 9 (0.9%) | 31 (1.3%) |
| $50,000 to $99,999 | 0 (0.0%) | 0 (0.0%) |
| $100,000 to $299,999 | 0 (0.0%) | 0 (0.0%) |
| $300,000 to $499,999 | 0 (0.0%) | 59 (2.4%) |
| $500,000 to $749,999 | 57 (5.6%) | 34 (1.4%) |
| $750,000 to $999,999 | 45 (4.4%) | 111 (4.6%) |
| $1,000,000 or more | 915 (89.2%) | 2,189 (90.3%) |
| Total | 1,026 (100.0%) | 2,424 (100.0%) |
Household Income by Mortgage Status in Blackhawk
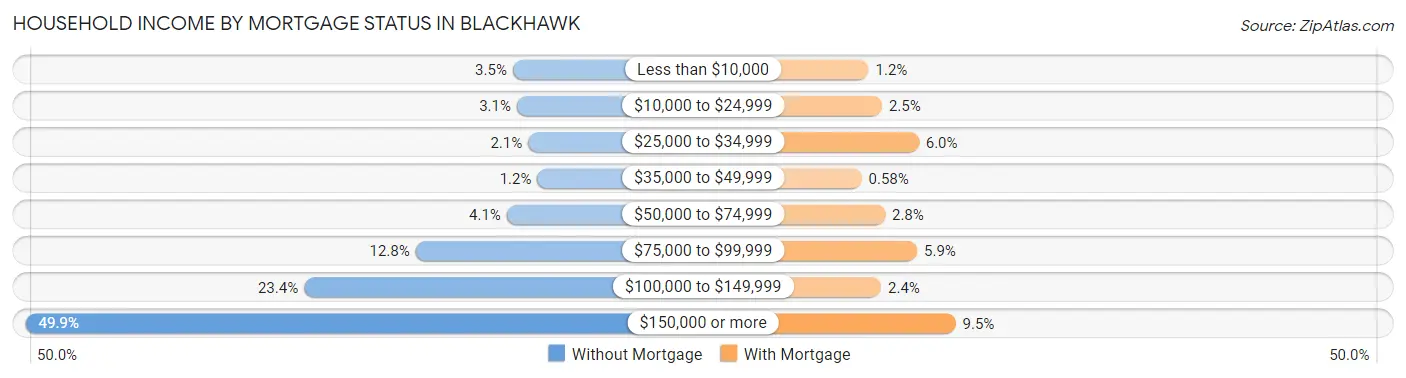
| Household Income | Without Mortgage | With Mortgage |
| Less than $10,000 | 36 (3.5%) | 30 (1.2%) |
| $10,000 to $24,999 | 32 (3.1%) | 61 (2.5%) |
| $25,000 to $34,999 | 21 (2.1%) | 146 (6.0%) |
| $35,000 to $49,999 | 12 (1.2%) | 14 (0.6%) |
| $50,000 to $74,999 | 42 (4.1%) | 68 (2.8%) |
| $75,000 to $99,999 | 131 (12.8%) | 142 (5.9%) |
| $100,000 to $149,999 | 240 (23.4%) | 59 (2.4%) |
| $150,000 or more | 512 (49.9%) | 231 (9.5%) |
| Total | 1,026 (100.0%) | 2,424 (100.0%) |
Property Value to Household Income Ratio in Blackhawk
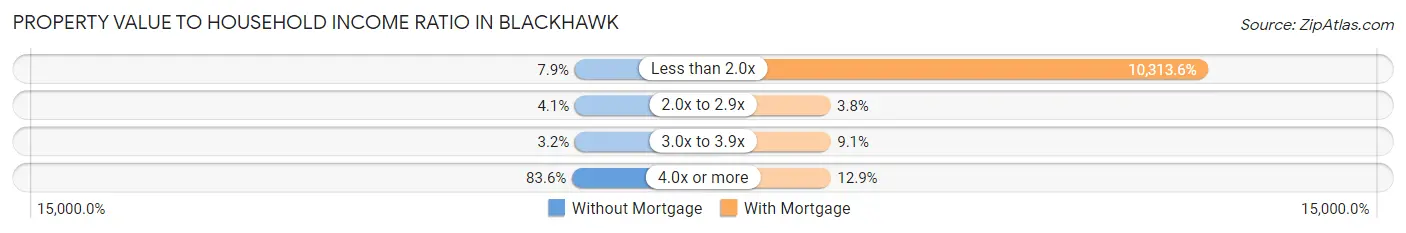
| Value-to-Income Ratio | Without Mortgage | With Mortgage |
| Less than 2.0x | 81 (7.9%) | 250,001 (10,313.6%) |
| 2.0x to 2.9x | 42 (4.1%) | 92 (3.8%) |
| 3.0x to 3.9x | 33 (3.2%) | 221 (9.1%) |
| 4.0x or more | 858 (83.6%) | 313 (12.9%) |
| Total | 1,026 (100.0%) | 2,424 (100.0%) |
Real Estate Taxes by Mortgage Status in Blackhawk
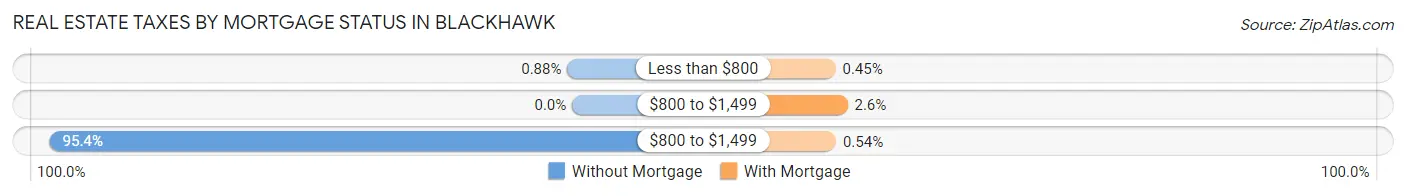
| Property Taxes | Without Mortgage | With Mortgage |
| Less than $800 | 9 (0.9%) | 11 (0.4%) |
| $800 to $1,499 | 0 (0.0%) | 64 (2.6%) |
| $800 to $1,499 | 979 (95.4%) | 13 (0.5%) |
| Total | 1,026 (100.0%) | 2,424 (100.0%) |
Health & Disability in Blackhawk
Health Insurance Coverage by Age in Blackhawk
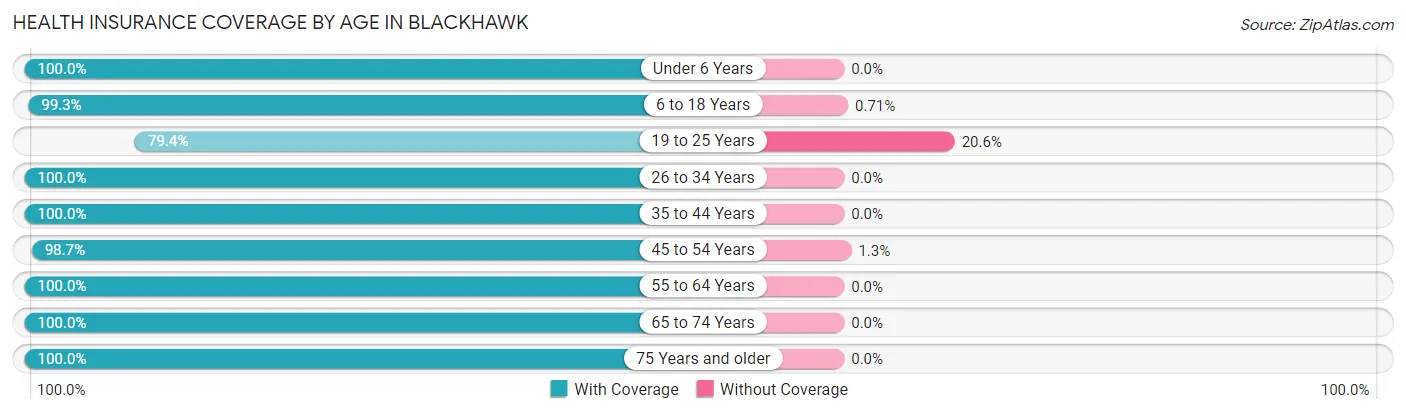
| Age Bracket | With Coverage | Without Coverage |
| Under 6 Years | 360 (100.0%) | 0 (0.0%) |
| 6 to 18 Years | 1,673 (99.3%) | 12 (0.7%) |
| 19 to 25 Years | 559 (79.4%) | 145 (20.6%) |
| 26 to 34 Years | 833 (100.0%) | 0 (0.0%) |
| 35 to 44 Years | 926 (100.0%) | 0 (0.0%) |
| 45 to 54 Years | 1,470 (98.7%) | 20 (1.3%) |
| 55 to 64 Years | 1,963 (100.0%) | 0 (0.0%) |
| 65 to 74 Years | 1,669 (100.0%) | 0 (0.0%) |
| 75 Years and older | 902 (100.0%) | 0 (0.0%) |
| Total | 10,355 (98.3%) | 177 (1.7%) |
Health Insurance Coverage by Citizenship Status in Blackhawk
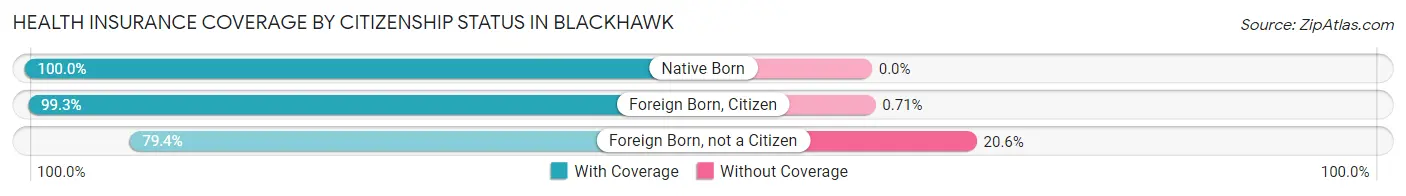
| Citizenship Status | With Coverage | Without Coverage |
| Native Born | 360 (100.0%) | 0 (0.0%) |
| Foreign Born, Citizen | 1,673 (99.3%) | 12 (0.7%) |
| Foreign Born, not a Citizen | 559 (79.4%) | 145 (20.6%) |
Health Insurance Coverage by Household Income in Blackhawk
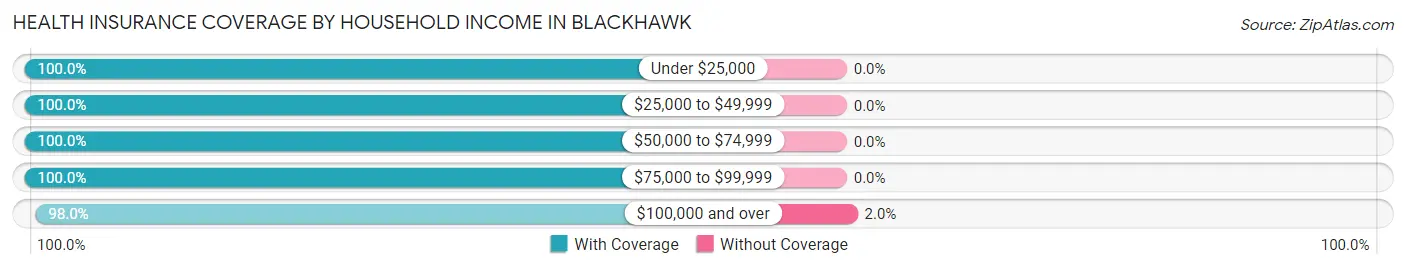
| Household Income | With Coverage | Without Coverage |
| Under $25,000 | 663 (100.0%) | 0 (0.0%) |
| $25,000 to $49,999 | 261 (100.0%) | 0 (0.0%) |
| $50,000 to $74,999 | 461 (100.0%) | 0 (0.0%) |
| $75,000 to $99,999 | 427 (100.0%) | 0 (0.0%) |
| $100,000 and over | 8,543 (98.0%) | 177 (2.0%) |
Public vs Private Health Insurance Coverage by Age in Blackhawk
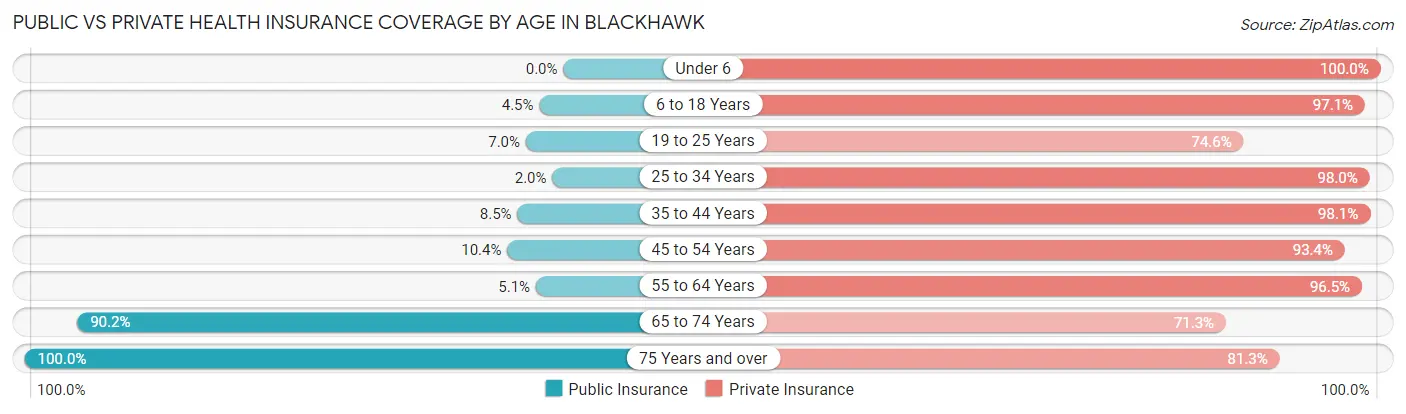
| Age Bracket | Public Insurance | Private Insurance |
| Under 6 | 0 (0.0%) | 360 (100.0%) |
| 6 to 18 Years | 75 (4.4%) | 1,636 (97.1%) |
| 19 to 25 Years | 49 (7.0%) | 525 (74.6%) |
| 25 to 34 Years | 17 (2.0%) | 816 (98.0%) |
| 35 to 44 Years | 79 (8.5%) | 908 (98.1%) |
| 45 to 54 Years | 155 (10.4%) | 1,391 (93.4%) |
| 55 to 64 Years | 100 (5.1%) | 1,895 (96.5%) |
| 65 to 74 Years | 1,506 (90.2%) | 1,190 (71.3%) |
| 75 Years and over | 902 (100.0%) | 733 (81.3%) |
| Total | 2,883 (27.4%) | 9,454 (89.8%) |
Disability Status by Sex by Age in Blackhawk
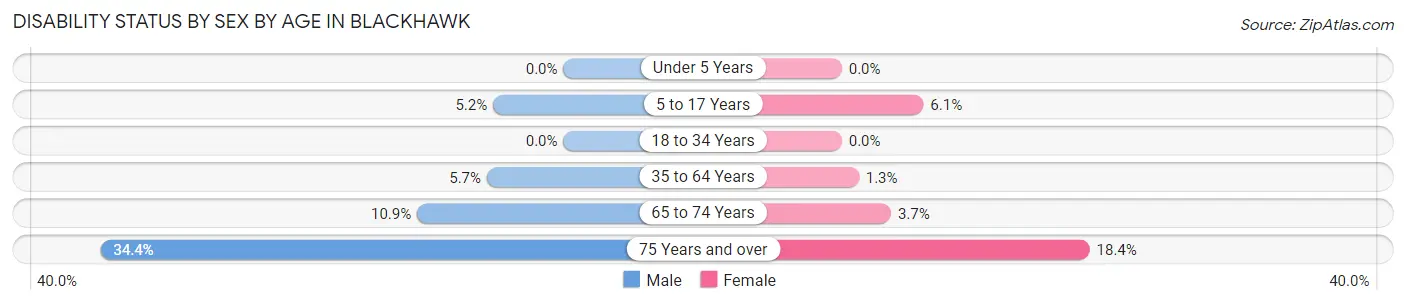
| Age Bracket | Male | Female |
| Under 5 Years | 0 (0.0%) | 0 (0.0%) |
| 5 to 17 Years | 34 (5.2%) | 47 (6.1%) |
| 18 to 34 Years | 0 (0.0%) | 0 (0.0%) |
| 35 to 64 Years | 118 (5.7%) | 29 (1.3%) |
| 65 to 74 Years | 86 (10.9%) | 32 (3.6%) |
| 75 Years and over | 155 (34.4%) | 83 (18.4%) |
Disability Class by Sex by Age in Blackhawk
Disability Class: Hearing Difficulty
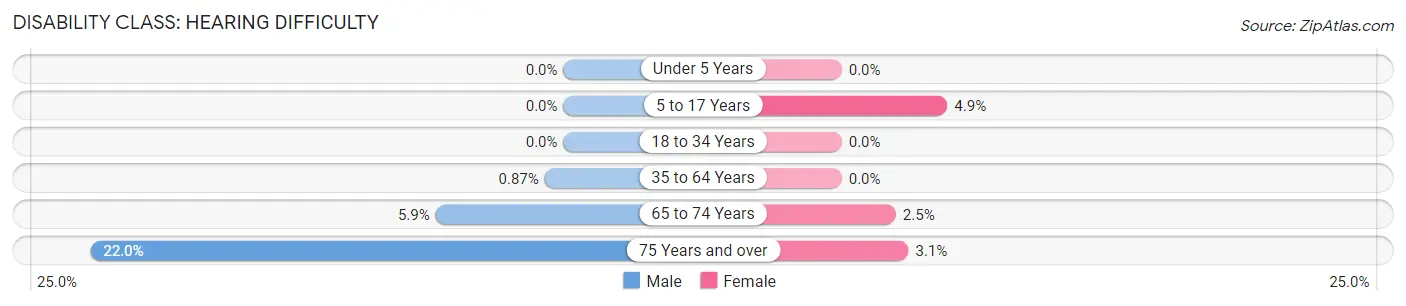
| Age Bracket | Male | Female |
| Under 5 Years | 0 (0.0%) | 0 (0.0%) |
| 5 to 17 Years | 0 (0.0%) | 38 (4.9%) |
| 18 to 34 Years | 0 (0.0%) | 0 (0.0%) |
| 35 to 64 Years | 18 (0.9%) | 0 (0.0%) |
| 65 to 74 Years | 47 (5.9%) | 22 (2.5%) |
| 75 Years and over | 99 (22.0%) | 14 (3.1%) |
Disability Class: Vision Difficulty
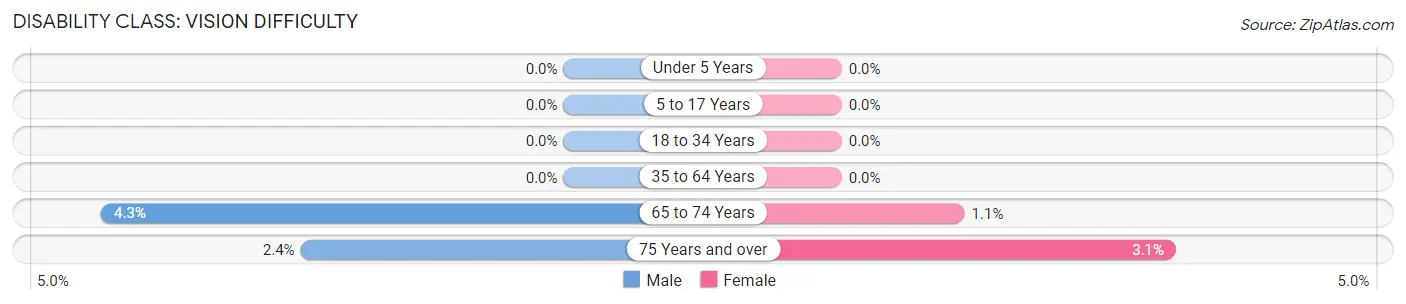
| Age Bracket | Male | Female |
| Under 5 Years | 0 (0.0%) | 0 (0.0%) |
| 5 to 17 Years | 0 (0.0%) | 0 (0.0%) |
| 18 to 34 Years | 0 (0.0%) | 0 (0.0%) |
| 35 to 64 Years | 0 (0.0%) | 0 (0.0%) |
| 65 to 74 Years | 34 (4.3%) | 10 (1.1%) |
| 75 Years and over | 11 (2.4%) | 14 (3.1%) |
Disability Class: Cognitive Difficulty
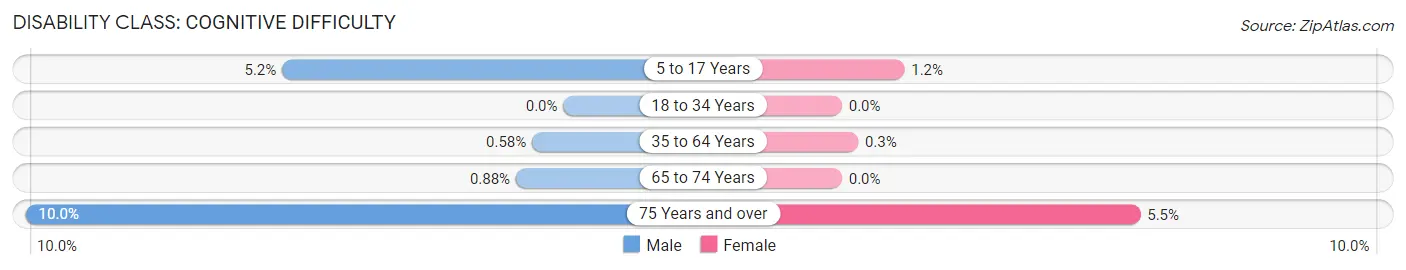
| Age Bracket | Male | Female |
| 5 to 17 Years | 34 (5.2%) | 9 (1.2%) |
| 18 to 34 Years | 0 (0.0%) | 0 (0.0%) |
| 35 to 64 Years | 12 (0.6%) | 7 (0.3%) |
| 65 to 74 Years | 7 (0.9%) | 0 (0.0%) |
| 75 Years and over | 45 (10.0%) | 25 (5.5%) |
Disability Class: Ambulatory Difficulty
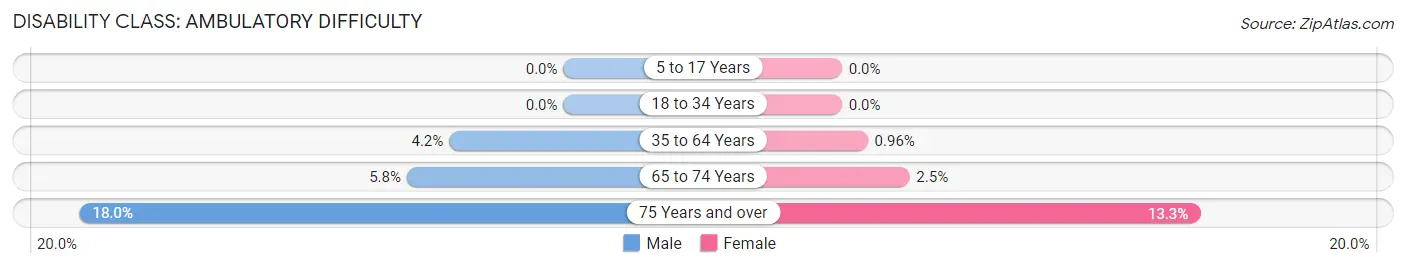
| Age Bracket | Male | Female |
| 5 to 17 Years | 0 (0.0%) | 0 (0.0%) |
| 18 to 34 Years | 0 (0.0%) | 0 (0.0%) |
| 35 to 64 Years | 88 (4.2%) | 22 (1.0%) |
| 65 to 74 Years | 46 (5.8%) | 22 (2.5%) |
| 75 Years and over | 81 (18.0%) | 60 (13.3%) |
Disability Class: Self-Care Difficulty
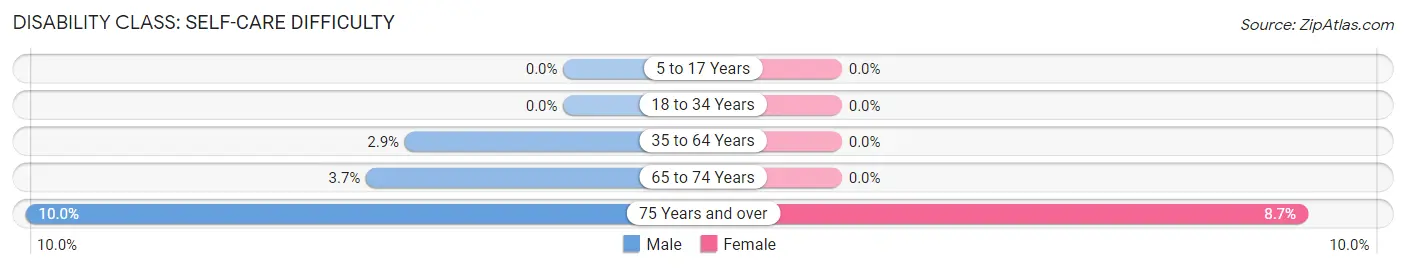
| Age Bracket | Male | Female |
| 5 to 17 Years | 0 (0.0%) | 0 (0.0%) |
| 18 to 34 Years | 0 (0.0%) | 0 (0.0%) |
| 35 to 64 Years | 61 (2.9%) | 0 (0.0%) |
| 65 to 74 Years | 29 (3.7%) | 0 (0.0%) |
| 75 Years and over | 45 (10.0%) | 39 (8.6%) |
Technology Access in Blackhawk
Computing Device Access in Blackhawk
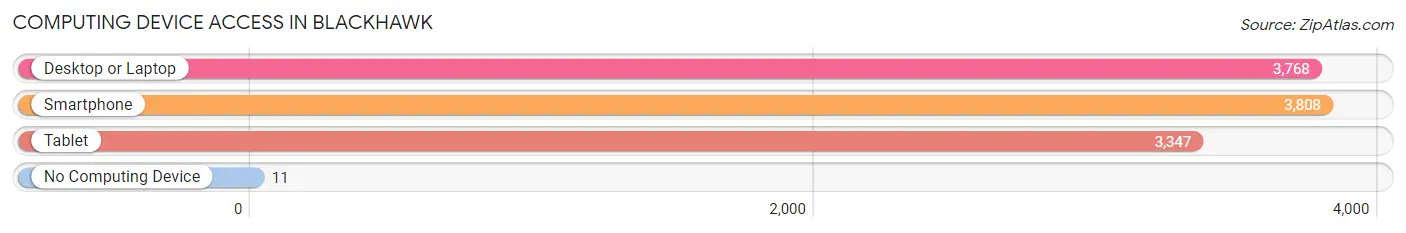
| Device Type | # Households | % Households |
| Desktop or Laptop | 3,768 | 96.2% |
| Smartphone | 3,808 | 97.2% |
| Tablet | 3,347 | 85.4% |
| No Computing Device | 11 | 0.3% |
| Total | 3,918 | 100.0% |
Internet Access in Blackhawk
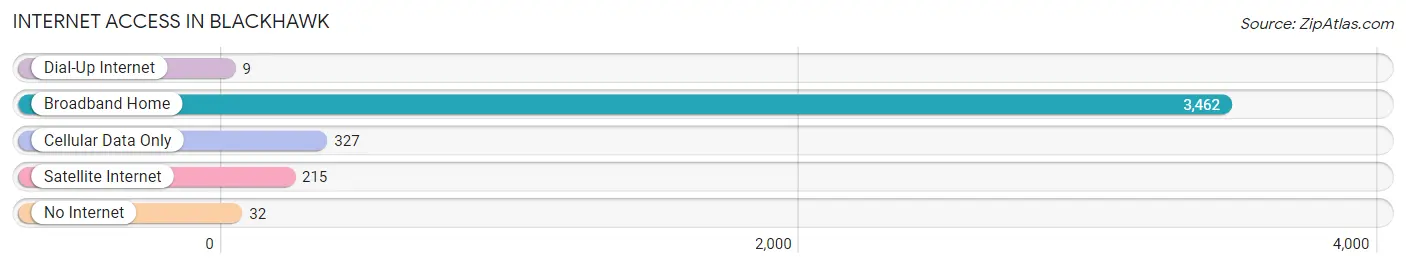
| Internet Type | # Households | % Households |
| Dial-Up Internet | 9 | 0.2% |
| Broadband Home | 3,462 | 88.4% |
| Cellular Data Only | 327 | 8.4% |
| Satellite Internet | 215 | 5.5% |
| No Internet | 32 | 0.8% |
| Total | 3,918 | 100.0% |
Blackhawk Summary
Blackhawk, California is a small unincorporated community located in Contra Costa County, California. It is situated in the foothills of the Diablo Range, approximately 25 miles east of San Francisco. The population of Blackhawk was estimated to be around 9,000 in 2020.
History
The area that is now Blackhawk was originally inhabited by the Ohlone people, who lived in the area for thousands of years before the arrival of Europeans. The first Europeans to settle in the area were Spanish missionaries, who established a mission in nearby San Ramon in 1797. The area was later settled by American pioneers in the mid-1800s, who established farms and ranches in the area.
In the early 1900s, the area was developed as a resort community by the Blackhawk Land Company. The company was founded by a group of wealthy San Francisco businessmen, who purchased the land and developed it into a resort community. The resort included a golf course, a hotel, and a casino. The resort was popular with wealthy San Franciscans, who would come to the area to escape the hustle and bustle of the city.
In the 1950s, the area was developed into a residential community. The Blackhawk Country Club was established in 1954, and the Blackhawk Plaza Shopping Center was built in the 1960s. The area has since grown into a suburban community, with a population of around 9,000.
Geography
Blackhawk is located in the foothills of the Diablo Range, approximately 25 miles east of San Francisco. The area is characterized by rolling hills and valleys, with elevations ranging from 500 to 1,000 feet. The area is home to several creeks and streams, including the San Ramon Creek, which flows through the area.
The climate in Blackhawk is mild, with temperatures ranging from the mid-50s to the mid-80s in the summer months. The area receives an average of 20 inches of rain per year.
Economy
The economy of Blackhawk is largely based on the service industry. The area is home to several restaurants, retail stores, and other businesses. The Blackhawk Plaza Shopping Center is the largest shopping center in the area, and is home to several major retailers, including Target, Safeway, and Walgreens.
The area is also home to several technology companies, including Oracle, which has its headquarters in nearby Redwood City. The area is also home to several wineries, including the Blackhawk Winery, which produces a variety of wines.
Demographics
The population of Blackhawk was estimated to be around 9,000 in 2020. The population is largely white (77.3%), with smaller percentages of Asian (13.2%), Hispanic (4.7%), and African American (2.3%) residents. The median household income in Blackhawk is $133,000, and the median home value is $1.2 million.
Conclusion
Blackhawk, California is a small unincorporated community located in Contra Costa County, California. It is situated in the foothills of the Diablo Range, approximately 25 miles east of San Francisco. The area was originally inhabited by the Ohlone people, and was later developed as a resort community by the Blackhawk Land Company in the early 1900s. The area has since grown into a suburban community, with a population of around 9,000. The economy of Blackhawk is largely based on the service industry, and the area is home to several technology companies, wineries, and other businesses. The population of Blackhawk is largely white, with smaller percentages of Asian, Hispanic, and African American residents.
Common Questions
What is Per Capita Income in Blackhawk?
Per Capita income in Blackhawk is $129,760.
What is the Median Family Income in Blackhawk?
Median Family Income in Blackhawk is $250,001.
What is the Median Household income in Blackhawk?
Median Household Income in Blackhawk is $234,773.
What is Income or Wage Gap in Blackhawk?
Income or Wage Gap in Blackhawk is 12.7%.
Women in Blackhawk earn 87.3 cents for every dollar earned by a man.
What is Family Income Deficit in Blackhawk?
Family Income Deficit in Blackhawk is $5,899.
Families that are below poverty line in Blackhawk earn $5,899 less on average than the poverty threshold level.
What is Inequality or Gini Index in Blackhawk?
Inequality or Gini Index in Blackhawk is 0.51.
What is the Total Population of Blackhawk?
Total Population of Blackhawk is 10,622.
What is the Total Male Population of Blackhawk?
Total Male Population of Blackhawk is 5,377.
What is the Total Female Population of Blackhawk?
Total Female Population of Blackhawk is 5,245.
What is the Ratio of Males per 100 Females in Blackhawk?
There are 102.52 Males per 100 Females in Blackhawk.
What is the Ratio of Females per 100 Males in Blackhawk?
There are 97.55 Females per 100 Males in Blackhawk.
What is the Median Population Age in Blackhawk?
Median Population Age in Blackhawk is 50.8 Years.
What is the Average Family Size in Blackhawk
Average Family Size in Blackhawk is 3.0 People.
What is the Average Household Size in Blackhawk
Average Household Size in Blackhawk is 2.7 People.
How Large is the Labor Force in Blackhawk?
There are 5,257 People in the Labor Forcein in Blackhawk.
What is the Percentage of People in the Labor Force in Blackhawk?
57.2% of People are in the Labor Force in Blackhawk.
What is the Unemployment Rate in Blackhawk?
Unemployment Rate in Blackhawk is 3.9%.