Black Point Green Point, CA Map & Demographics
Black Point Green Point Map
Black Point Green Point Overview
$92,913
PER CAPITA INCOME
$250,001
AVG FAMILY INCOME
$159,737
AVG HOUSEHOLD INCOME
9.7%
WAGE / INCOME GAP [ % ]
90.3¢/ $1
WAGE / INCOME GAP [ $ ]
0.44
INEQUALITY / GINI INDEX
1,684
TOTAL POPULATION
840
MALE POPULATION
844
FEMALE POPULATION
99.53
MALES / 100 FEMALES
100.48
FEMALES / 100 MALES
51.7
MEDIAN AGE
3.1
AVG FAMILY SIZE
2.4
AVG HOUSEHOLD SIZE
823
LABOR FORCE [ PEOPLE ]
56.3%
PERCENT IN LABOR FORCE
4.3%
UNEMPLOYMENT RATE
Income in Black Point Green Point
Income Overview in Black Point Green Point
Per Capita Income in Black Point Green Point is $92,913, while median incomes of families and households are $250,001 and $159,737 respectively.
| Characteristic | Number | Measure |
| Per Capita Income | 1,684 | $92,913 |
| Median Family Income | 379 | $250,001 |
| Mean Family Income | 379 | $283,329 |
| Median Household Income | 702 | $159,737 |
| Mean Household Income | 702 | $230,605 |
| Income Deficit | 379 | $0 |
| Wage / Income Gap (%) | 1,684 | 9.66% |
| Wage / Income Gap ($) | 1,684 | 90.34¢ per $1 |
| Gini / Inequality Index | 1,684 | 0.44 |
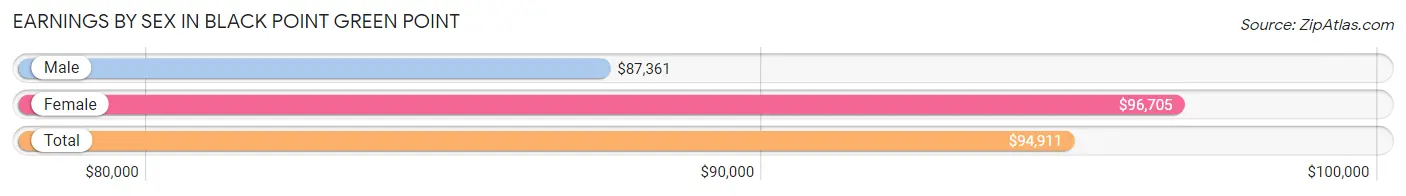
Earnings by Sex in Black Point Green Point
Average Earnings in Black Point Green Point are $94,911, $87,361 for men and $96,705 for women, a difference of 9.7%.
| Sex | Number | Average Earnings |
| Male | 483 (51.5%) | $87,361 |
| Female | 454 (48.4%) | $96,705 |
| Total | 937 (100.0%) | $94,911 |
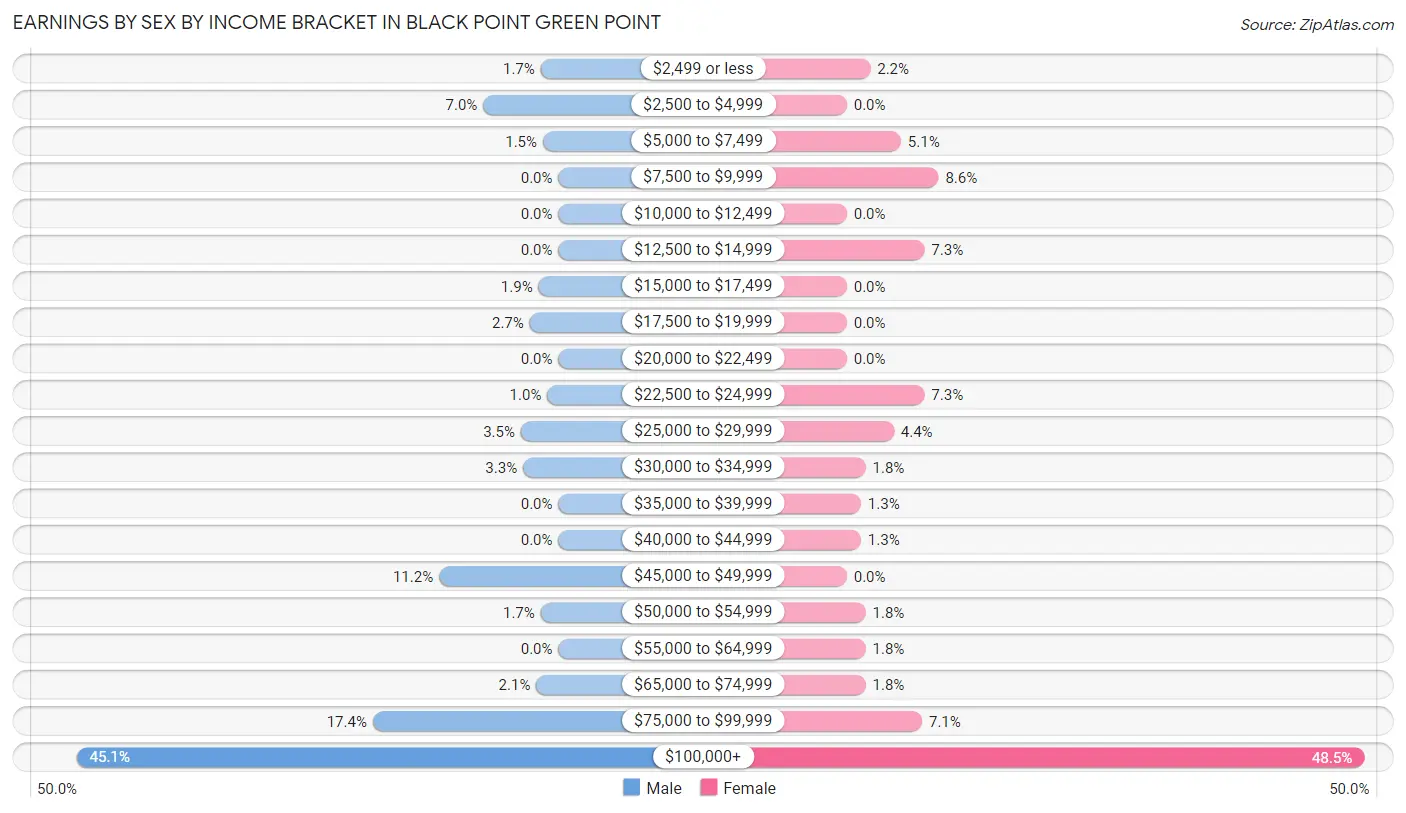
Earnings by Sex by Income Bracket in Black Point Green Point
The most common earnings brackets in Black Point Green Point are $100,000+ for men (218 | 45.1%) and $100,000+ for women (220 | 48.5%).
| Income | Male | Female |
| $2,499 or less | 8 (1.7%) | 10 (2.2%) |
| $2,500 to $4,999 | 34 (7.0%) | 0 (0.0%) |
| $5,000 to $7,499 | 7 (1.5%) | 23 (5.1%) |
| $7,500 to $9,999 | 0 (0.0%) | 39 (8.6%) |
| $10,000 to $12,499 | 0 (0.0%) | 0 (0.0%) |
| $12,500 to $14,999 | 0 (0.0%) | 33 (7.3%) |
| $15,000 to $17,499 | 9 (1.9%) | 0 (0.0%) |
| $17,500 to $19,999 | 13 (2.7%) | 0 (0.0%) |
| $20,000 to $22,499 | 0 (0.0%) | 0 (0.0%) |
| $22,500 to $24,999 | 5 (1.0%) | 33 (7.3%) |
| $25,000 to $29,999 | 17 (3.5%) | 20 (4.4%) |
| $30,000 to $34,999 | 16 (3.3%) | 8 (1.8%) |
| $35,000 to $39,999 | 0 (0.0%) | 6 (1.3%) |
| $40,000 to $44,999 | 0 (0.0%) | 6 (1.3%) |
| $45,000 to $49,999 | 54 (11.2%) | 0 (0.0%) |
| $50,000 to $54,999 | 8 (1.7%) | 8 (1.8%) |
| $55,000 to $64,999 | 0 (0.0%) | 8 (1.8%) |
| $65,000 to $74,999 | 10 (2.1%) | 8 (1.8%) |
| $75,000 to $99,999 | 84 (17.4%) | 32 (7.0%) |
| $100,000+ | 218 (45.1%) | 220 (48.5%) |
| Total | 483 (100.0%) | 454 (100.0%) |
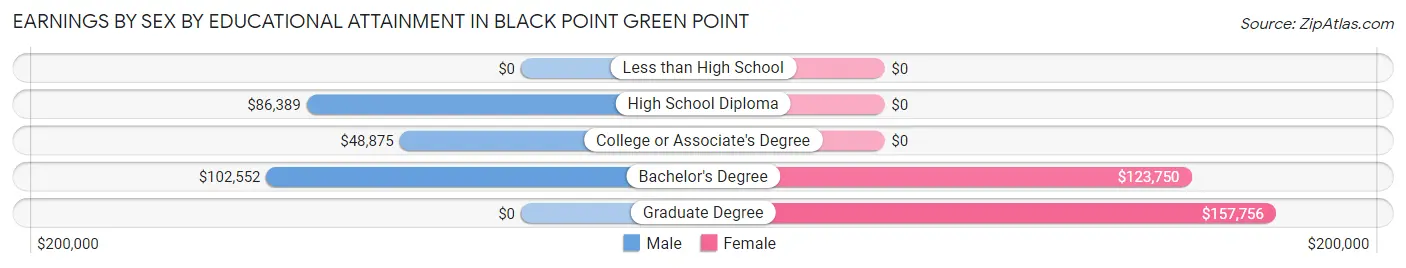
Earnings by Sex by Educational Attainment in Black Point Green Point
Average earnings in Black Point Green Point are $103,021 for men and $97,330 for women, a difference of 5.5%. Men with an educational attainment of bachelor's degree enjoy the highest average annual earnings of $102,552, while those with college or associate's degree education earn the least with $48,875. Women with an educational attainment of graduate degree earn the most with the average annual earnings of $157,756, while those with bachelor's degree education have the smallest earnings of $123,750.
| Educational Attainment | Male Income | Female Income |
| Less than High School | - | - |
| High School Diploma | $86,389 | $0 |
| College or Associate's Degree | $48,875 | $0 |
| Bachelor's Degree | $102,552 | $123,750 |
| Graduate Degree | - | - |
| Total | $103,021 | $97,330 |
Family Income in Black Point Green Point
Family Income Brackets in Black Point Green Point
According to the Black Point Green Point family income data, there are 206 families falling into the $200,000+ income range, which is the most common income bracket and makes up 54.3% of all families.

| Income Bracket | # Families | % Families |
| Less than $10,000 | 10 | 2.6% |
| $10,000 to $14,999 | 0 | 0.0% |
| $15,000 to $24,999 | 0 | 0.0% |
| $25,000 to $34,999 | 0 | 0.0% |
| $35,000 to $49,999 | 11 | 2.9% |
| $50,000 to $74,999 | 6 | 1.6% |
| $75,000 to $99,999 | 59 | 15.6% |
| $100,000 to $149,999 | 50 | 13.2% |
| $150,000 to $199,999 | 37 | 9.8% |
| $200,000+ | 206 | 54.4% |
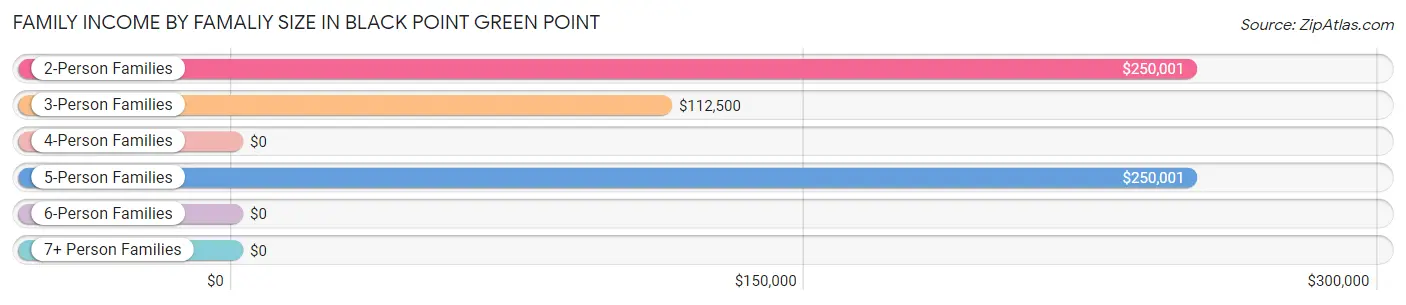
Family Income by Famaliy Size in Black Point Green Point
2-person families (198 | 52.2%) account for the highest median family income in Black Point Green Point with $250,001 per family, while 2-person families (198 | 52.2%) have the highest median income of $125,000 per family member.
| Income Bracket | # Families | Median Income |
| 2-Person Families | 198 (52.2%) | $250,001 |
| 3-Person Families | 100 (26.4%) | $112,500 |
| 4-Person Families | 0 (0.0%) | $0 |
| 5-Person Families | 72 (19.0%) | $250,001 |
| 6-Person Families | 9 (2.4%) | $0 |
| 7+ Person Families | 0 (0.0%) | $0 |
| Total | 379 (100.0%) | $250,001 |
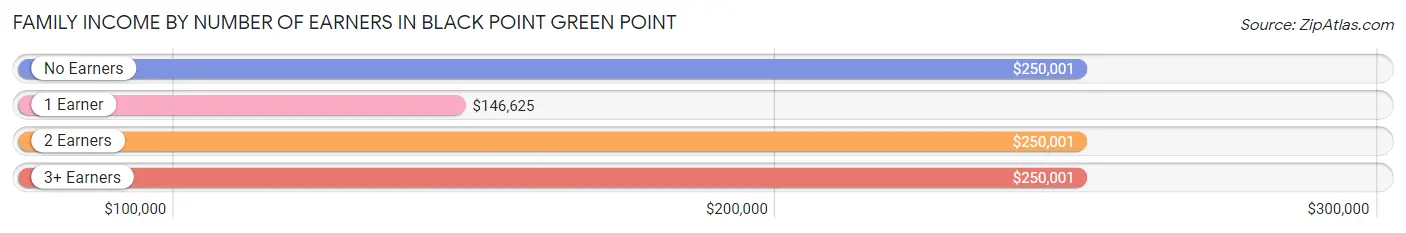
Family Income by Number of Earners in Black Point Green Point
The median family income in Black Point Green Point is $250,001, with families comprising no earners (100) having the highest median family income of $250,001, while families with 1 earner (139) have the lowest median family income of $146,625, accounting for 26.4% and 36.7% of families, respectively.
| Number of Earners | # Families | Median Income |
| No Earners | 100 (26.4%) | $250,001 |
| 1 Earner | 139 (36.7%) | $146,625 |
| 2 Earners | 80 (21.1%) | $250,001 |
| 3+ Earners | 60 (15.8%) | $250,001 |
| Total | 379 (100.0%) | $250,001 |
Household Income in Black Point Green Point
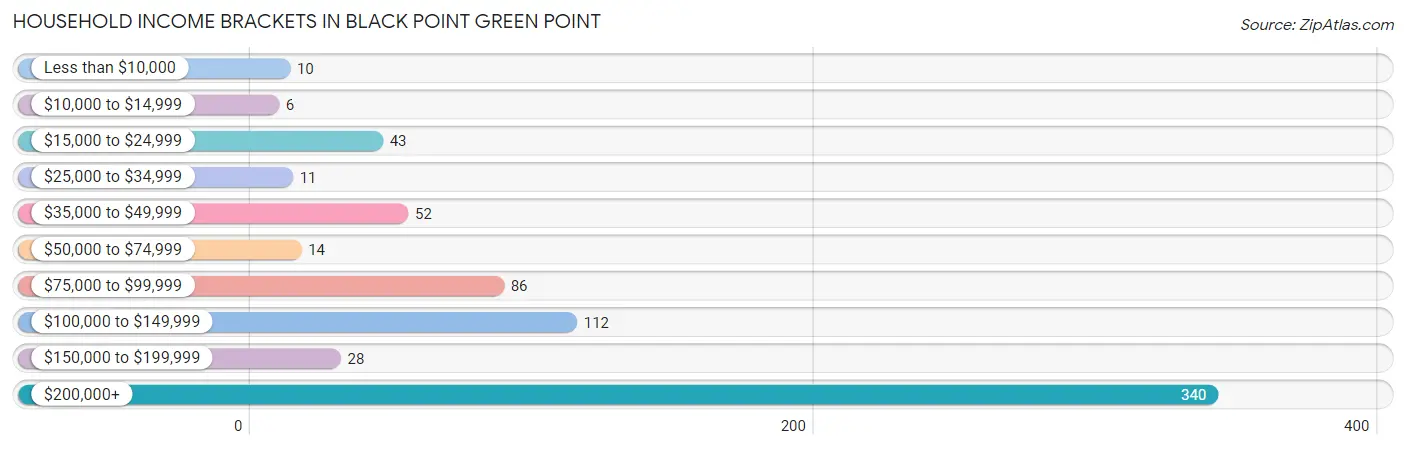
Household Income Brackets in Black Point Green Point
With 340 households falling in the category, the $200,000+ income range is the most frequent in Black Point Green Point, accounting for 48.4% of all households. In contrast, only 6 households (0.9%) fall into the $10,000 to $14,999 income bracket, making it the least populous group.
| Income Bracket | # Households | % Households |
| Less than $10,000 | 10 | 1.4% |
| $10,000 to $14,999 | 6 | 0.9% |
| $15,000 to $24,999 | 43 | 6.1% |
| $25,000 to $34,999 | 11 | 1.6% |
| $35,000 to $49,999 | 52 | 7.4% |
| $50,000 to $74,999 | 14 | 2.0% |
| $75,000 to $99,999 | 86 | 12.3% |
| $100,000 to $149,999 | 112 | 16.0% |
| $150,000 to $199,999 | 28 | 4.0% |
| $200,000+ | 340 | 48.4% |
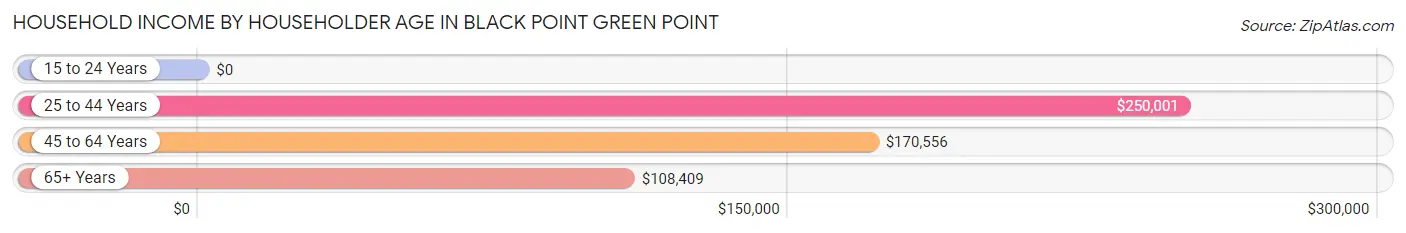
Household Income by Householder Age in Black Point Green Point
The median household income in Black Point Green Point is $159,737, with the highest median household income of $250,001 found in the 25 to 44 years age bracket for the primary householder. A total of 120 households (17.1%) fall into this category.
| Income Bracket | # Households | Median Income |
| 15 to 24 Years | 0 (0.0%) | $0 |
| 25 to 44 Years | 120 (17.1%) | $250,001 |
| 45 to 64 Years | 282 (40.2%) | $170,556 |
| 65+ Years | 300 (42.7%) | $108,409 |
| Total | 702 (100.0%) | $159,737 |
Poverty in Black Point Green Point
Income Below Poverty by Sex and Age in Black Point Green Point
With 1.2% poverty level for males and 1.9% for females among the residents of Black Point Green Point, 75 year old and over males and 65 to 74 year old females are the most vulnerable to poverty, with 10 males (15.1%) and 16 females (7.3%) in their respective age groups living below the poverty level.
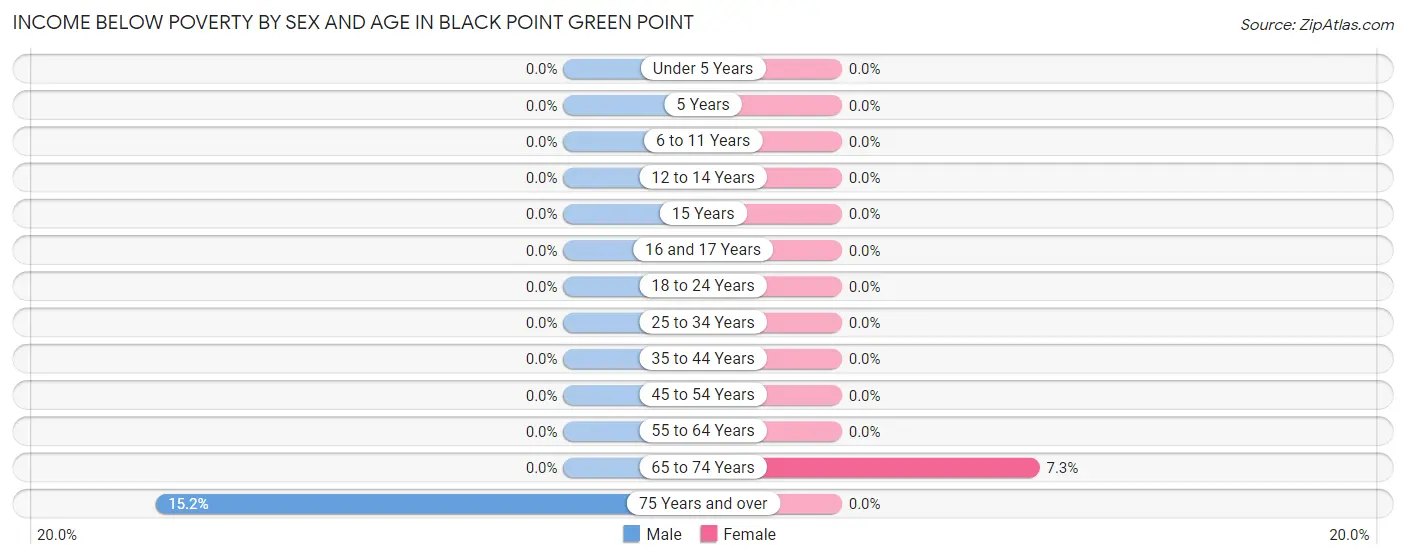
| Age Bracket | Male | Female |
| Under 5 Years | 0 (0.0%) | 0 (0.0%) |
| 5 Years | 0 (0.0%) | 0 (0.0%) |
| 6 to 11 Years | 0 (0.0%) | 0 (0.0%) |
| 12 to 14 Years | 0 (0.0%) | 0 (0.0%) |
| 15 Years | 0 (0.0%) | 0 (0.0%) |
| 16 and 17 Years | 0 (0.0%) | 0 (0.0%) |
| 18 to 24 Years | 0 (0.0%) | 0 (0.0%) |
| 25 to 34 Years | 0 (0.0%) | 0 (0.0%) |
| 35 to 44 Years | 0 (0.0%) | 0 (0.0%) |
| 45 to 54 Years | 0 (0.0%) | 0 (0.0%) |
| 55 to 64 Years | 0 (0.0%) | 0 (0.0%) |
| 65 to 74 Years | 0 (0.0%) | 16 (7.3%) |
| 75 Years and over | 10 (15.1%) | 0 (0.0%) |
| Total | 10 (1.2%) | 16 (1.9%) |
Income Above Poverty by Sex and Age in Black Point Green Point
According to the poverty statistics in Black Point Green Point, males aged under 5 years and females aged under 5 years are the age groups that are most secure financially, with 100.0% of males and 100.0% of females in these age groups living above the poverty line.
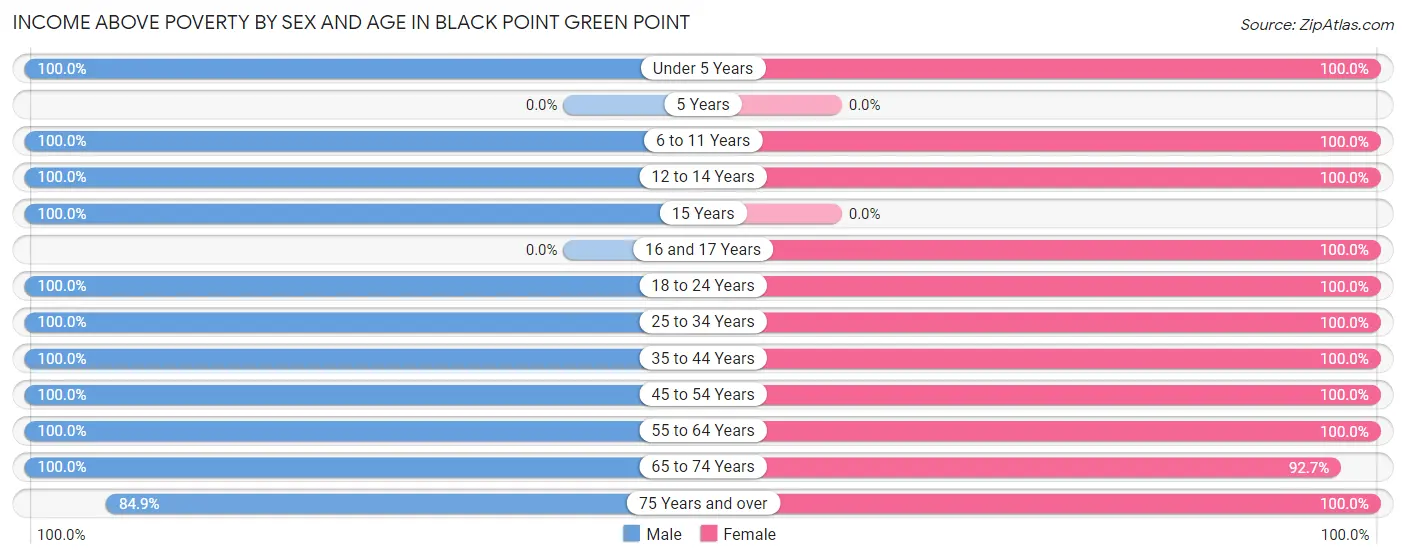
| Age Bracket | Male | Female |
| Under 5 Years | 26 (100.0%) | 9 (100.0%) |
| 5 Years | 0 (0.0%) | 0 (0.0%) |
| 6 to 11 Years | 34 (100.0%) | 10 (100.0%) |
| 12 to 14 Years | 12 (100.0%) | 84 (100.0%) |
| 15 Years | 48 (100.0%) | 0 (0.0%) |
| 16 and 17 Years | 0 (0.0%) | 35 (100.0%) |
| 18 to 24 Years | 82 (100.0%) | 24 (100.0%) |
| 25 to 34 Years | 130 (100.0%) | 38 (100.0%) |
| 35 to 44 Years | 28 (100.0%) | 57 (100.0%) |
| 45 to 54 Years | 107 (100.0%) | 194 (100.0%) |
| 55 to 64 Years | 78 (100.0%) | 97 (100.0%) |
| 65 to 74 Years | 229 (100.0%) | 202 (92.7%) |
| 75 Years and over | 56 (84.9%) | 78 (100.0%) |
| Total | 830 (98.8%) | 828 (98.1%) |
Income Below Poverty Among Married-Couple Families in Black Point Green Point
The poverty statistics for married-couple families in Black Point Green Point show that 2.9% or 10 of the total 346 families live below the poverty line. Families with no children have the highest poverty rate of 4.0%, comprising of 10 families. On the other hand, families with 1 or 2 children have the lowest poverty rate of 0.0%, which includes 0 families.
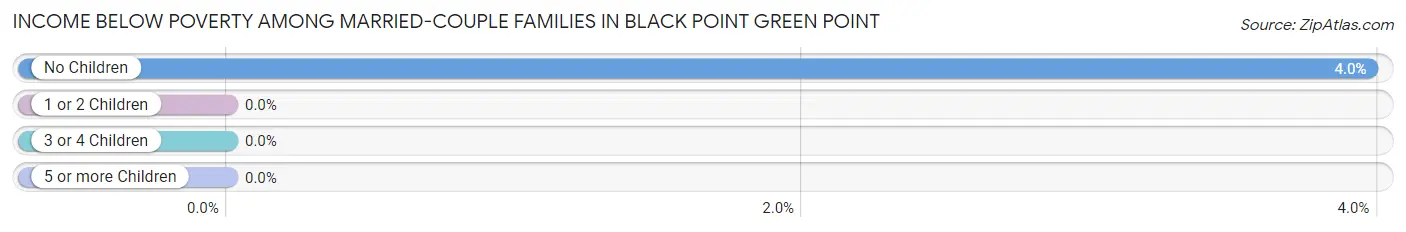
| Children | Above Poverty | Below Poverty |
| No Children | 242 (96.0%) | 10 (4.0%) |
| 1 or 2 Children | 73 (100.0%) | 0 (0.0%) |
| 3 or 4 Children | 21 (100.0%) | 0 (0.0%) |
| 5 or more Children | 0 (0.0%) | 0 (0.0%) |
| Total | 336 (97.1%) | 10 (2.9%) |
Income Below Poverty Among Single-Parent Households in Black Point Green Point
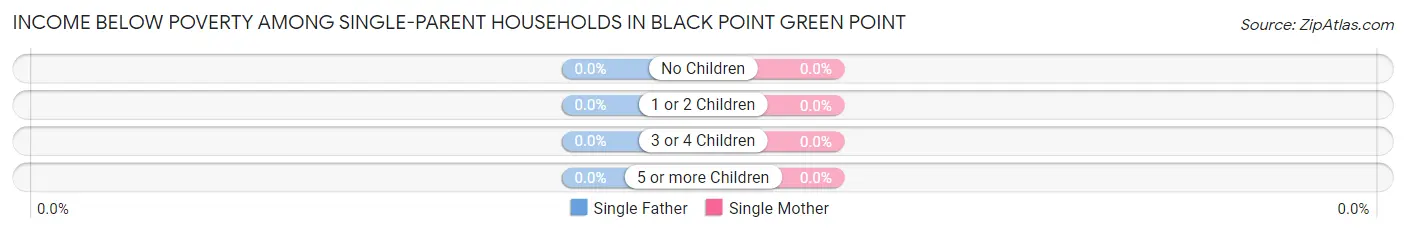
| Children | Single Father | Single Mother |
| No Children | 0 (0.0%) | 0 (0.0%) |
| 1 or 2 Children | 0 (0.0%) | 0 (0.0%) |
| 3 or 4 Children | 0 (0.0%) | 0 (0.0%) |
| 5 or more Children | 0 (0.0%) | 0 (0.0%) |
| Total | 0 (0.0%) | 0 (0.0%) |
Income Below Poverty Among Married-Couple vs Single-Parent Households in Black Point Green Point
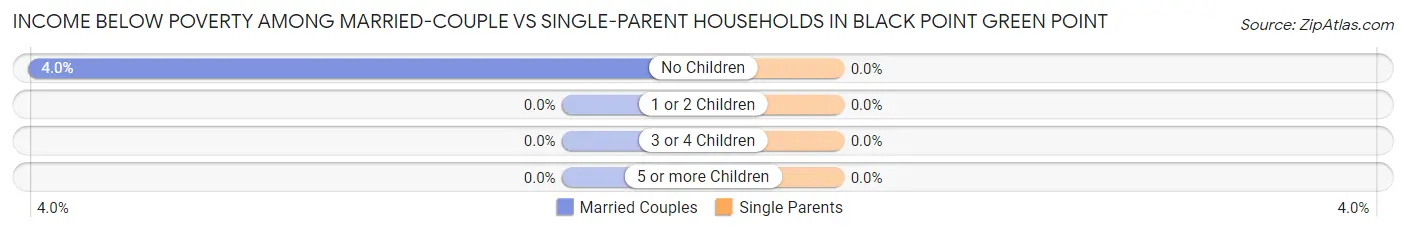
| Children | Married-Couple Families | Single-Parent Households |
| No Children | 10 (4.0%) | 0 (0.0%) |
| 1 or 2 Children | 0 (0.0%) | 0 (0.0%) |
| 3 or 4 Children | 0 (0.0%) | 0 (0.0%) |
| 5 or more Children | 0 (0.0%) | 0 (0.0%) |
| Total | 10 (2.9%) | 0 (0.0%) |
Race in Black Point Green Point
The most populous races in Black Point Green Point are White / Caucasian (1,144 | 67.9%), Asian (465 | 27.6%), and Hispanic or Latino (81 | 4.8%).
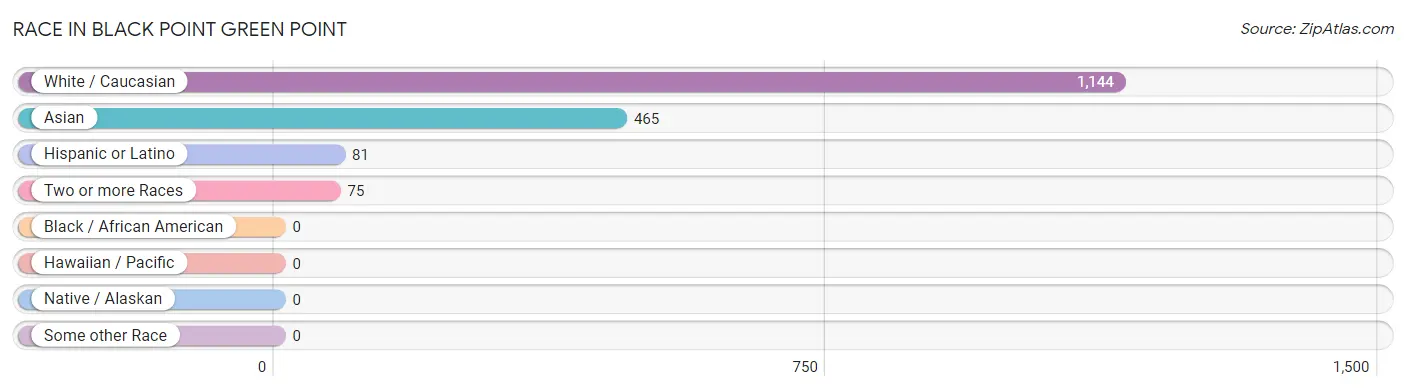
| Race | # Population | % Population |
| Asian | 465 | 27.6% |
| Black / African American | 0 | 0.0% |
| Hawaiian / Pacific | 0 | 0.0% |
| Hispanic or Latino | 81 | 4.8% |
| Native / Alaskan | 0 | 0.0% |
| White / Caucasian | 1,144 | 67.9% |
| Two or more Races | 75 | 4.4% |
| Some other Race | 0 | 0.0% |
| Total | 1,684 | 100.0% |
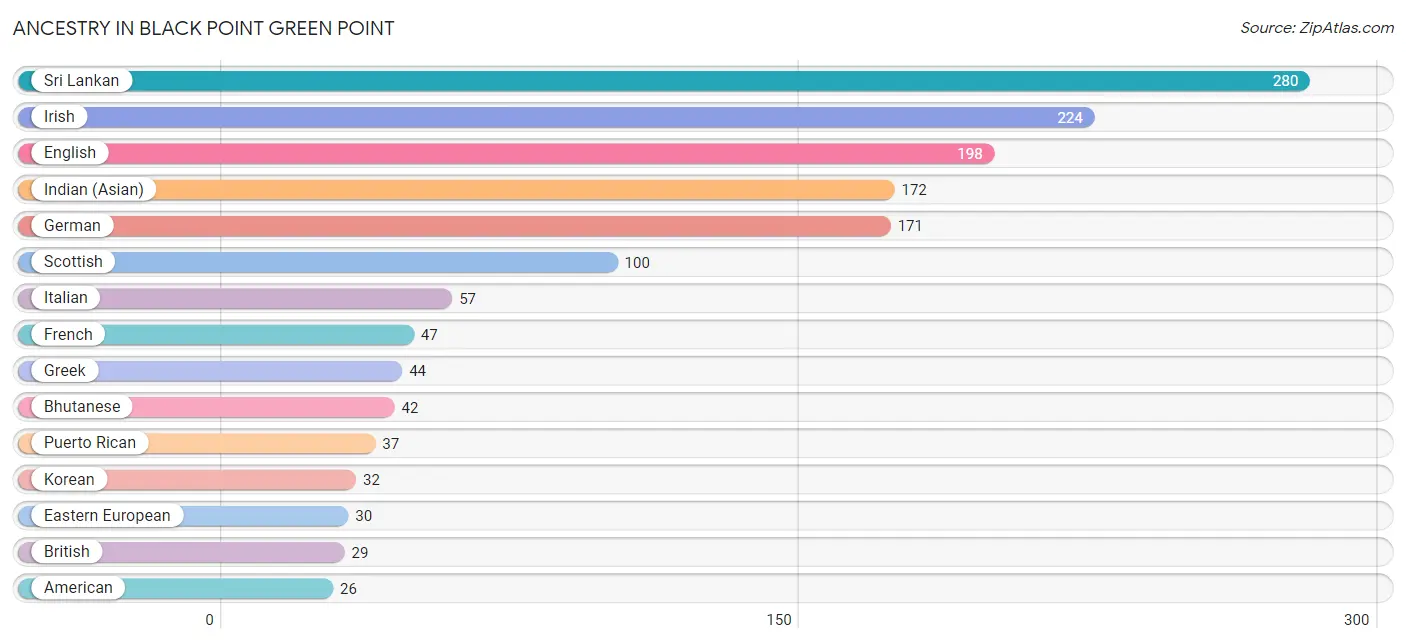
Ancestry in Black Point Green Point
The most populous ancestries reported in Black Point Green Point are Sri Lankan (280 | 16.6%), Irish (224 | 13.3%), English (198 | 11.8%), Indian (Asian) (172 | 10.2%), and German (171 | 10.2%), together accounting for 62.1% of all Black Point Green Point residents.
| Ancestry | # Population | % Population |
| Alaska Native | 4 | 0.2% |
| American | 26 | 1.5% |
| Bhutanese | 42 | 2.5% |
| British | 29 | 1.7% |
| Burmese | 26 | 1.5% |
| Celtic | 9 | 0.5% |
| Central American | 19 | 1.1% |
| Danish | 7 | 0.4% |
| Dutch | 22 | 1.3% |
| Eastern European | 30 | 1.8% |
| English | 198 | 11.8% |
| European | 19 | 1.1% |
| French | 47 | 2.8% |
| French Canadian | 11 | 0.6% |
| German | 171 | 10.2% |
| Greek | 44 | 2.6% |
| Indian (Asian) | 172 | 10.2% |
| Inupiat | 5 | 0.3% |
| Irish | 224 | 13.3% |
| Italian | 57 | 3.4% |
| Korean | 32 | 1.9% |
| Mexican | 6 | 0.4% |
| Polish | 11 | 0.6% |
| Portuguese | 6 | 0.4% |
| Puerto Rican | 37 | 2.2% |
| Russian | 19 | 1.1% |
| Salvadoran | 19 | 1.1% |
| Scottish | 100 | 5.9% |
| Sri Lankan | 280 | 16.6% |
| Swedish | 10 | 0.6% |
| Welsh | 25 | 1.5% | View All 31 Rows |
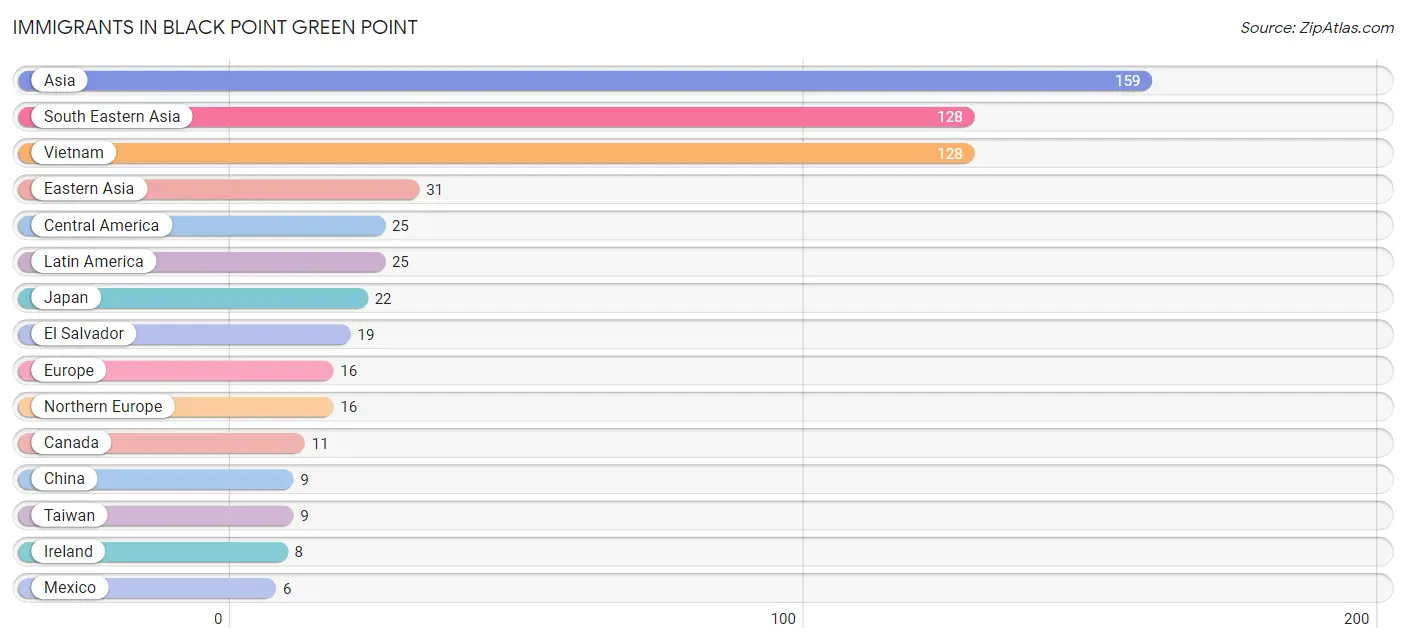
Immigrants in Black Point Green Point
The most numerous immigrant groups reported in Black Point Green Point came from Asia (159 | 9.4%), South Eastern Asia (128 | 7.6%), Vietnam (128 | 7.6%), Eastern Asia (31 | 1.8%), and Central America (25 | 1.5%), together accounting for 28.0% of all Black Point Green Point residents.
| Immigration Origin | # Population | % Population |
| Asia | 159 | 9.4% |
| Canada | 11 | 0.6% |
| Central America | 25 | 1.5% |
| China | 9 | 0.5% |
| Eastern Asia | 31 | 1.8% |
| El Salvador | 19 | 1.1% |
| Europe | 16 | 0.9% |
| Ireland | 8 | 0.5% |
| Japan | 22 | 1.3% |
| Latin America | 25 | 1.5% |
| Mexico | 6 | 0.4% |
| Northern Europe | 16 | 0.9% |
| South Eastern Asia | 128 | 7.6% |
| Taiwan | 9 | 0.5% |
| Vietnam | 128 | 7.6% | View All 15 Rows |
Sex and Age in Black Point Green Point
Sex and Age in Black Point Green Point
The most populous age groups in Black Point Green Point are 65 to 69 Years (146 | 17.4%) for men and 65 to 69 Years (142 | 16.8%) for women.
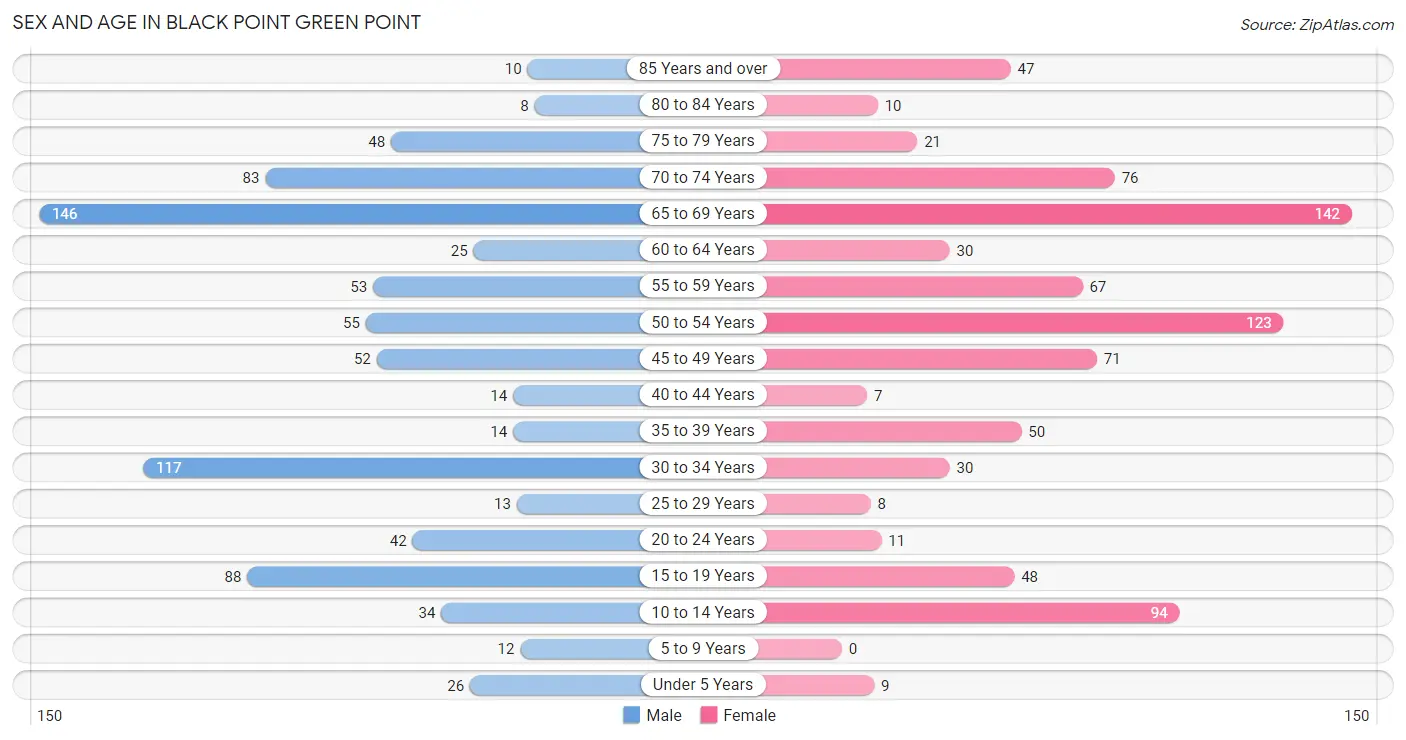
| Age Bracket | Male | Female |
| Under 5 Years | 26 (3.1%) | 9 (1.1%) |
| 5 to 9 Years | 12 (1.4%) | 0 (0.0%) |
| 10 to 14 Years | 34 (4.1%) | 94 (11.1%) |
| 15 to 19 Years | 88 (10.5%) | 48 (5.7%) |
| 20 to 24 Years | 42 (5.0%) | 11 (1.3%) |
| 25 to 29 Years | 13 (1.5%) | 8 (0.9%) |
| 30 to 34 Years | 117 (13.9%) | 30 (3.5%) |
| 35 to 39 Years | 14 (1.7%) | 50 (5.9%) |
| 40 to 44 Years | 14 (1.7%) | 7 (0.8%) |
| 45 to 49 Years | 52 (6.2%) | 71 (8.4%) |
| 50 to 54 Years | 55 (6.6%) | 123 (14.6%) |
| 55 to 59 Years | 53 (6.3%) | 67 (7.9%) |
| 60 to 64 Years | 25 (3.0%) | 30 (3.5%) |
| 65 to 69 Years | 146 (17.4%) | 142 (16.8%) |
| 70 to 74 Years | 83 (9.9%) | 76 (9.0%) |
| 75 to 79 Years | 48 (5.7%) | 21 (2.5%) |
| 80 to 84 Years | 8 (0.9%) | 10 (1.2%) |
| 85 Years and over | 10 (1.2%) | 47 (5.6%) |
| Total | 840 (100.0%) | 844 (100.0%) |
Families and Households in Black Point Green Point
Median Family Size in Black Point Green Point
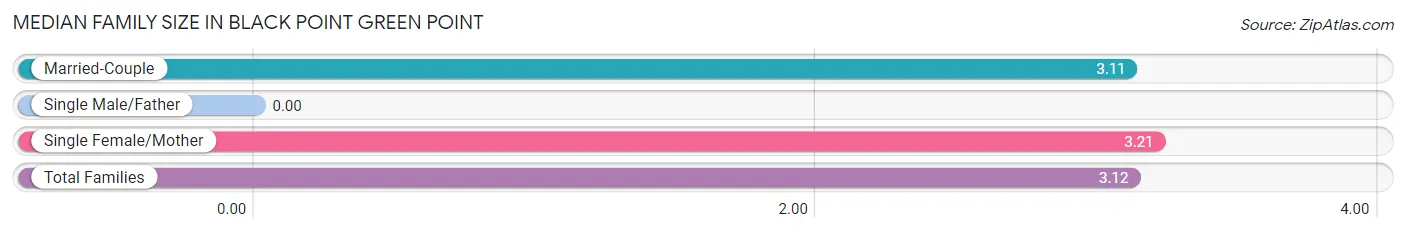
| Family Type | # Families | Family Size |
| Married-Couple | 346 (91.3%) | 3.11 |
| Single Male/Father | 0 (0.0%) | - |
| Single Female/Mother | 33 (8.7%) | 3.21 |
| Total Families | 379 (100.0%) | 3.12 |
Median Household Size in Black Point Green Point
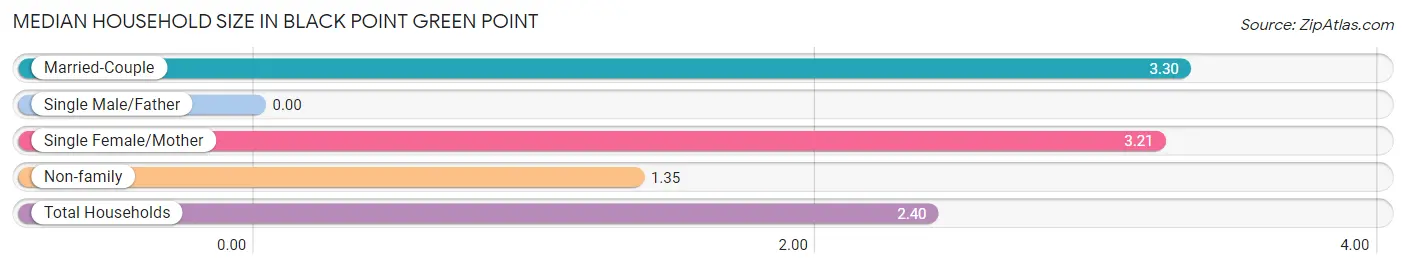
| Household Type | # Households | Household Size |
| Married-Couple | 346 (49.3%) | 3.30 |
| Single Male/Father | 0 (0.0%) | - |
| Single Female/Mother | 33 (4.7%) | 3.21 |
| Non-family | 323 (46.0%) | 1.35 |
| Total Households | 702 (100.0%) | 2.40 |
Household Size by Marriage Status in Black Point Green Point
Out of a total of 702 households in Black Point Green Point, 379 (54.0%) are family households, while 323 (46.0%) are nonfamily households. The most numerous type of family households are 2-person households, comprising 158, and the most common type of nonfamily households are 1-person households, comprising 190.
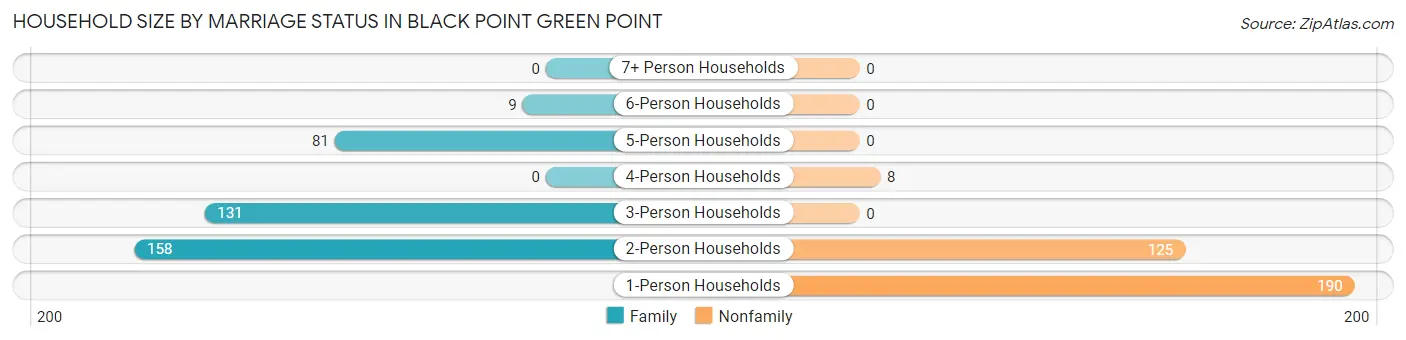
| Household Size | Family Households | Nonfamily Households |
| 1-Person Households | - | 190 (27.1%) |
| 2-Person Households | 158 (22.5%) | 125 (17.8%) |
| 3-Person Households | 131 (18.7%) | 0 (0.0%) |
| 4-Person Households | 0 (0.0%) | 8 (1.1%) |
| 5-Person Households | 81 (11.5%) | 0 (0.0%) |
| 6-Person Households | 9 (1.3%) | 0 (0.0%) |
| 7+ Person Households | 0 (0.0%) | 0 (0.0%) |
| Total | 379 (54.0%) | 323 (46.0%) |
Female Fertility in Black Point Green Point
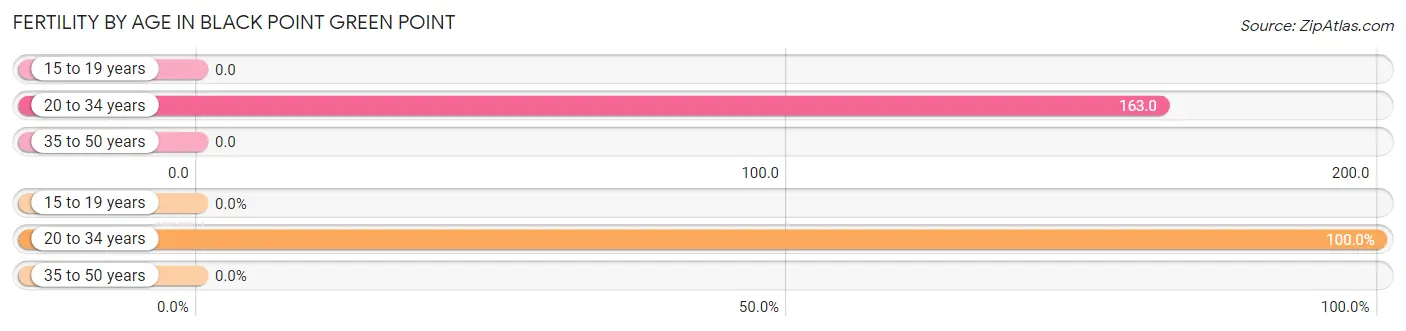
Fertility by Age in Black Point Green Point
Average fertility rate in Black Point Green Point is 30.0 births per 1,000 women. Women in the age bracket of 20 to 34 years have the highest fertility rate with 163.0 births per 1,000 women. Women in the age bracket of 20 to 34 years acount for 100.0% of all women with births.
| Age Bracket | Women with Births | Births / 1,000 Women |
| 15 to 19 years | 0 (0.0%) | 0.0 |
| 20 to 34 years | 8 (100.0%) | 163.0 |
| 35 to 50 years | 0 (0.0%) | 0.0 |
| Total | 8 (100.0%) | 30.0 |
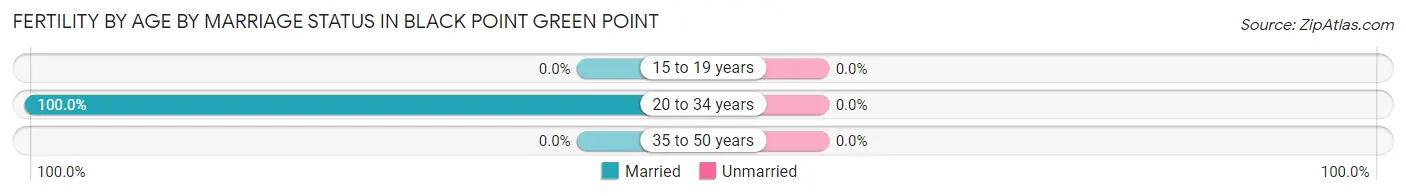
Fertility by Age by Marriage Status in Black Point Green Point
| Age Bracket | Married | Unmarried |
| 15 to 19 years | 0 (0.0%) | 0 (0.0%) |
| 20 to 34 years | 8 (100.0%) | 0 (0.0%) |
| 35 to 50 years | 0 (0.0%) | 0 (0.0%) |
| Total | 8 (100.0%) | 0 (0.0%) |
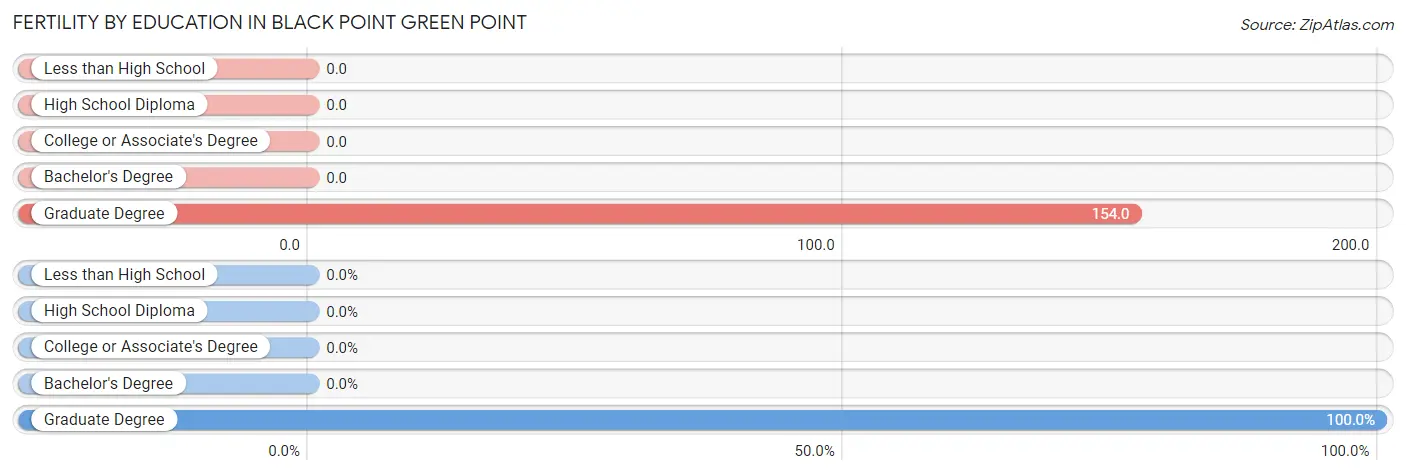
Fertility by Education in Black Point Green Point
| Educational Attainment | Women with Births | Births / 1,000 Women |
| Less than High School | 0 (0.0%) | 0.0 |
| High School Diploma | 0 (0.0%) | 0.0 |
| College or Associate's Degree | 0 (0.0%) | 0.0 |
| Bachelor's Degree | 0 (0.0%) | 0.0 |
| Graduate Degree | 8 (100.0%) | 154.0 |
| Total | 8 (100.0%) | 30.0 |
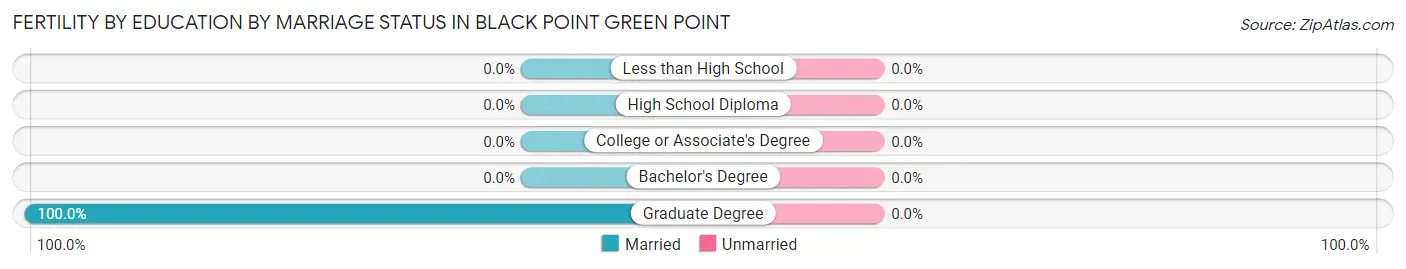
Fertility by Education by Marriage Status in Black Point Green Point
| Educational Attainment | Married | Unmarried |
| Less than High School | 0 (0.0%) | 0 (0.0%) |
| High School Diploma | 0 (0.0%) | 0 (0.0%) |
| College or Associate's Degree | 0 (0.0%) | 0 (0.0%) |
| Bachelor's Degree | 0 (0.0%) | 0 (0.0%) |
| Graduate Degree | 8 (100.0%) | 0 (0.0%) |
| Total | 8 (100.0%) | 0 (0.0%) |
Employment Characteristics in Black Point Green Point
Employment by Class of Employer in Black Point Green Point
Among the 776 employed individuals in Black Point Green Point, private company employees (405 | 52.2%), self-employed (incorporated) (196 | 25.3%), and self-employed (not incorporated) (119 | 15.3%) make up the most common classes of employment.
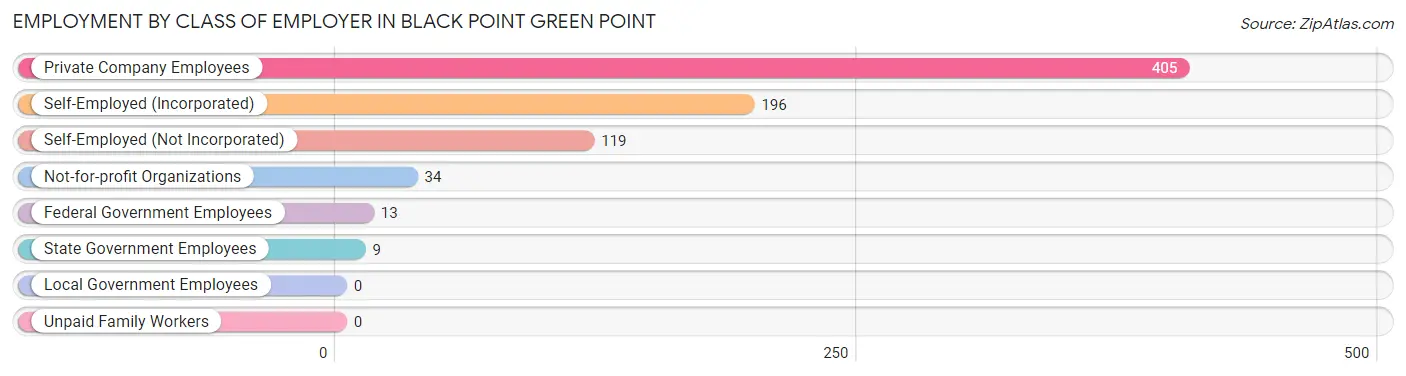
| Employer Class | # Employees | % Employees |
| Private Company Employees | 405 | 52.2% |
| Self-Employed (Incorporated) | 196 | 25.3% |
| Self-Employed (Not Incorporated) | 119 | 15.3% |
| Not-for-profit Organizations | 34 | 4.4% |
| Local Government Employees | 0 | 0.0% |
| State Government Employees | 9 | 1.2% |
| Federal Government Employees | 13 | 1.7% |
| Unpaid Family Workers | 0 | 0.0% |
| Total | 776 | 100.0% |
Employment Status by Age in Black Point Green Point
According to the labor force statistics for Black Point Green Point, out of the total population over 16 years of age (1,461), 56.3% or 823 individuals are in the labor force, with 4.3% or 35 of them unemployed. The age group with the highest labor force participation rate is 25 to 29 years, with 100.0% or 21 individuals in the labor force. Within the labor force, the 20 to 24 years age range has the highest percentage of unemployed individuals, with 20.6% or 7 of them being unemployed.
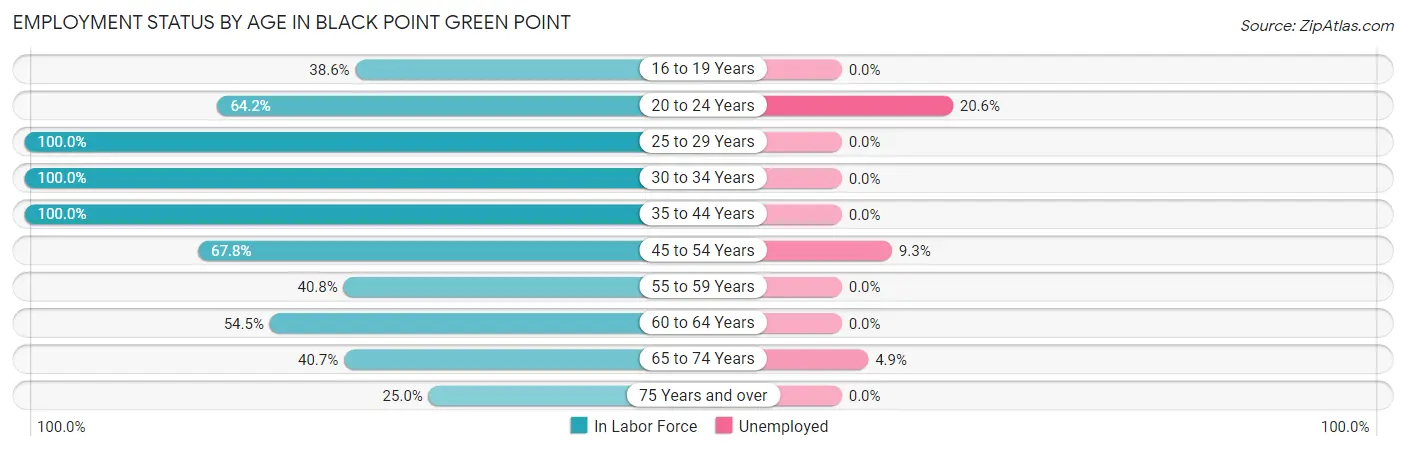
| Age Bracket | In Labor Force | Unemployed |
| 16 to 19 Years | 34 (38.6%) | 0 (0.0%) |
| 20 to 24 Years | 34 (64.2%) | 7 (20.6%) |
| 25 to 29 Years | 21 (100.0%) | 0 (0.0%) |
| 30 to 34 Years | 147 (100.0%) | 0 (0.0%) |
| 35 to 44 Years | 85 (100.0%) | 0 (0.0%) |
| 45 to 54 Years | 204 (67.8%) | 19 (9.3%) |
| 55 to 59 Years | 49 (40.8%) | 0 (0.0%) |
| 60 to 64 Years | 30 (54.5%) | 0 (0.0%) |
| 65 to 74 Years | 182 (40.7%) | 9 (4.9%) |
| 75 Years and over | 36 (25.0%) | 0 (0.0%) |
| Total | 823 (56.3%) | 35 (4.3%) |
Employment Status by Educational Attainment in Black Point Green Point
According to labor force statistics for Black Point Green Point, 73.5% of individuals (536) out of the total population between 25 and 64 years of age (729) are in the labor force, with 3.5% or 19 of them being unemployed. The group with the highest labor force participation rate are those with the educational attainment of less than high school, with 92.2% or 95 individuals in the labor force. Within the labor force, individuals with high school diploma education have the highest percentage of unemployment, with 45.2% or 19 of them being unemployed.
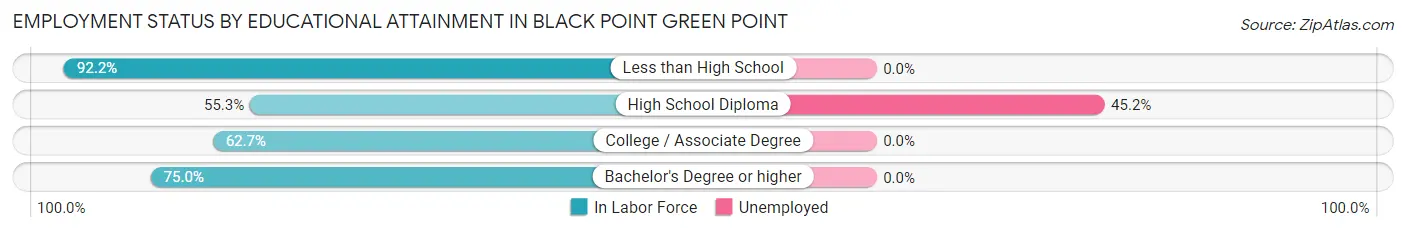
| Educational Attainment | In Labor Force | Unemployed |
| Less than High School | 95 (92.2%) | 0 (0.0%) |
| High School Diploma | 42 (55.3%) | 34 (45.2%) |
| College / Associate Degree | 69 (62.7%) | 0 (0.0%) |
| Bachelor's Degree or higher | 330 (75.0%) | 0 (0.0%) |
| Total | 536 (73.5%) | 26 (3.5%) |
Employment Occupations by Sex in Black Point Green Point
Management, Business, Science and Arts Occupations
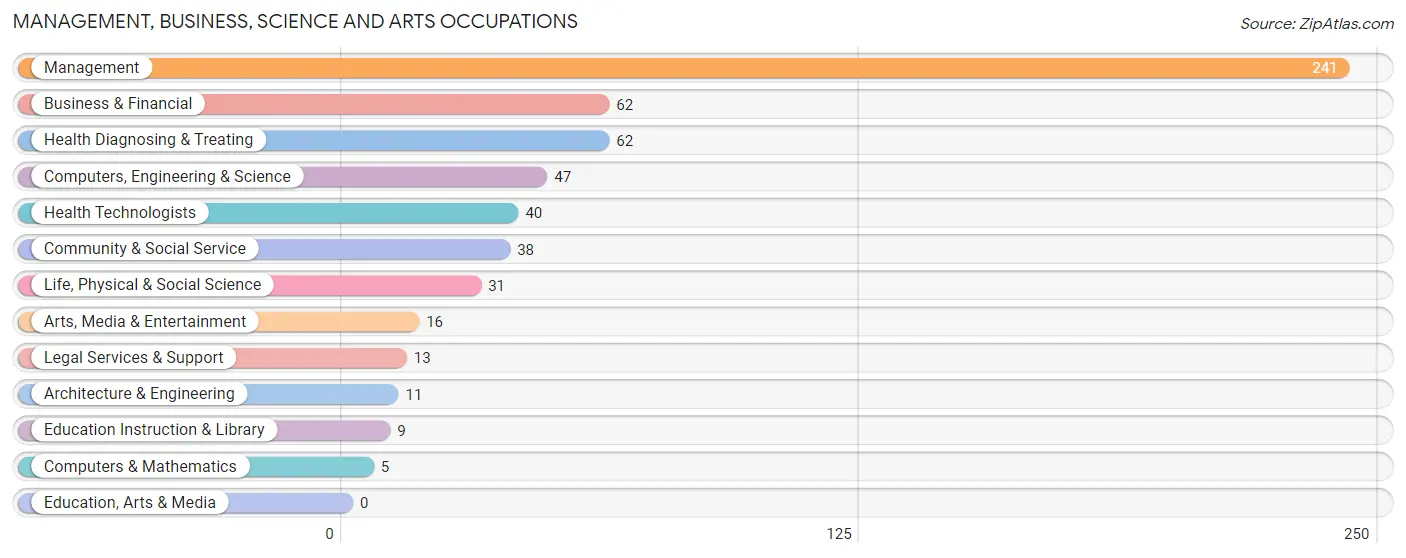
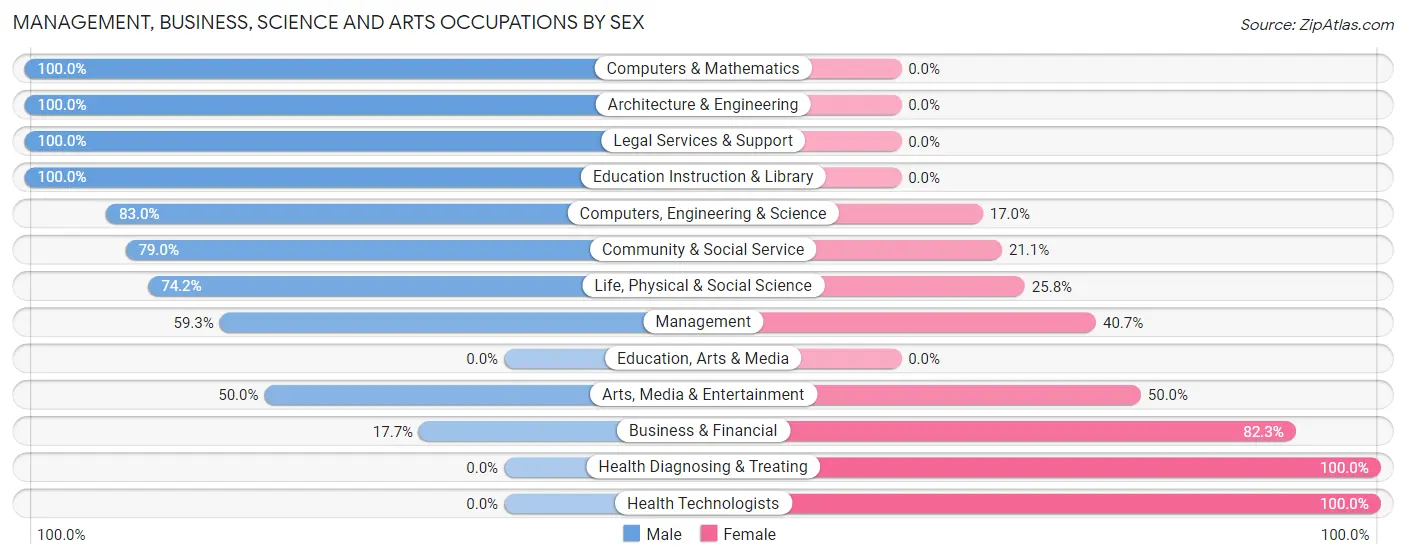
The most common Management, Business, Science and Arts occupations in Black Point Green Point are Management (241 | 30.6%), Business & Financial (62 | 7.9%), Health Diagnosing & Treating (62 | 7.9%), Computers, Engineering & Science (47 | 6.0%), and Health Technologists (40 | 5.1%).
Management, Business, Science and Arts Occupations by Sex
Within the Management, Business, Science and Arts occupations in Black Point Green Point, the most male-oriented occupations are Computers & Mathematics (100.0%), Architecture & Engineering (100.0%), and Legal Services & Support (100.0%), while the most female-oriented occupations are Health Diagnosing & Treating (100.0%), Health Technologists (100.0%), and Business & Financial (82.3%).
| Occupation | Male | Female |
| Management | 143 (59.3%) | 98 (40.7%) |
| Business & Financial | 11 (17.7%) | 51 (82.3%) |
| Computers, Engineering & Science | 39 (83.0%) | 8 (17.0%) |
| Computers & Mathematics | 5 (100.0%) | 0 (0.0%) |
| Architecture & Engineering | 11 (100.0%) | 0 (0.0%) |
| Life, Physical & Social Science | 23 (74.2%) | 8 (25.8%) |
| Community & Social Service | 30 (78.9%) | 8 (21.0%) |
| Education, Arts & Media | 0 (0.0%) | 0 (0.0%) |
| Legal Services & Support | 13 (100.0%) | 0 (0.0%) |
| Education Instruction & Library | 9 (100.0%) | 0 (0.0%) |
| Arts, Media & Entertainment | 8 (50.0%) | 8 (50.0%) |
| Health Diagnosing & Treating | 0 (0.0%) | 62 (100.0%) |
| Health Technologists | 0 (0.0%) | 40 (100.0%) |
| Total (Category) | 223 (49.6%) | 227 (50.4%) |
| Total (Overall) | 458 (58.2%) | 329 (41.8%) |
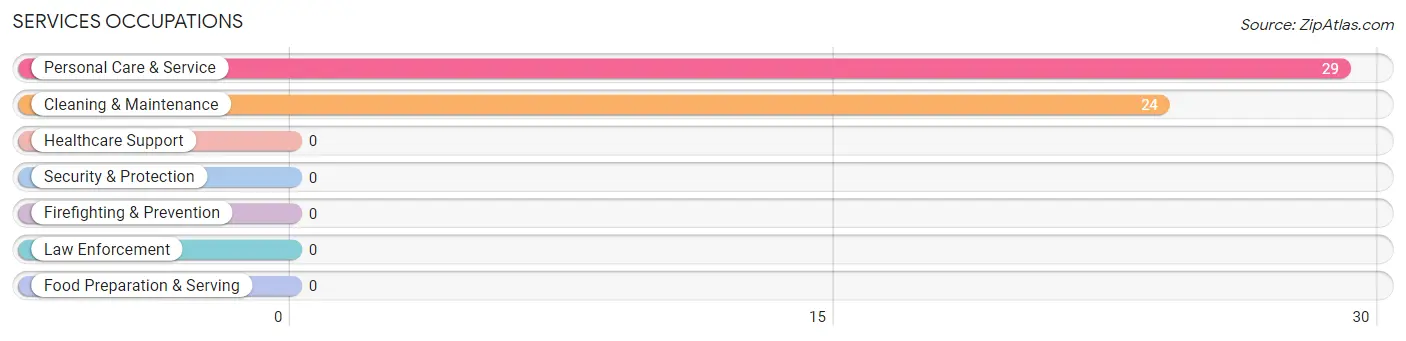
Services Occupations
The most common Services occupations in Black Point Green Point are Personal Care & Service (29 | 3.7%), and Cleaning & Maintenance (24 | 3.0%).
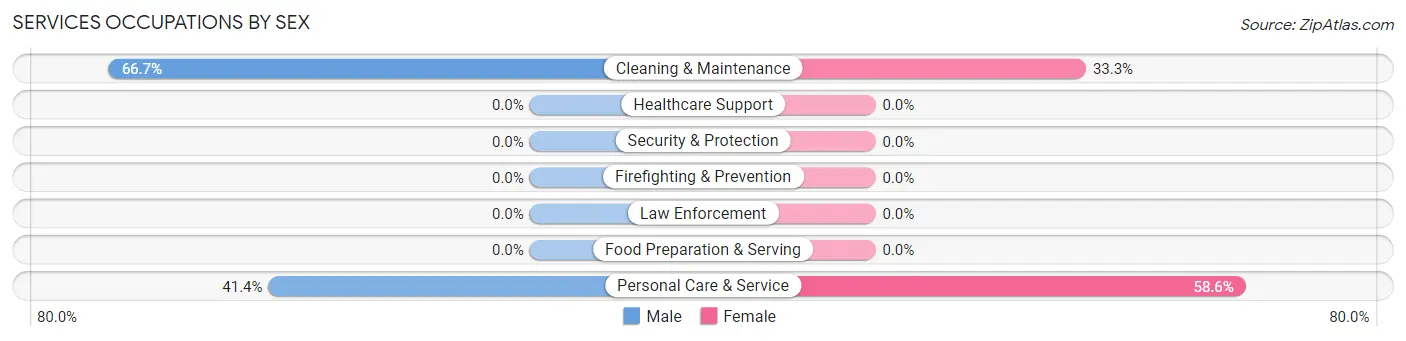
Services Occupations by Sex
Within the Services occupations in Black Point Green Point, the most male-oriented occupations are Cleaning & Maintenance (66.7%), and Personal Care & Service (41.4%), while the most female-oriented occupations are Personal Care & Service (58.6%), and Cleaning & Maintenance (33.3%).
| Occupation | Male | Female |
| Healthcare Support | 0 (0.0%) | 0 (0.0%) |
| Security & Protection | 0 (0.0%) | 0 (0.0%) |
| Firefighting & Prevention | 0 (0.0%) | 0 (0.0%) |
| Law Enforcement | 0 (0.0%) | 0 (0.0%) |
| Food Preparation & Serving | 0 (0.0%) | 0 (0.0%) |
| Cleaning & Maintenance | 16 (66.7%) | 8 (33.3%) |
| Personal Care & Service | 12 (41.4%) | 17 (58.6%) |
| Total (Category) | 28 (52.8%) | 25 (47.2%) |
| Total (Overall) | 458 (58.2%) | 329 (41.8%) |
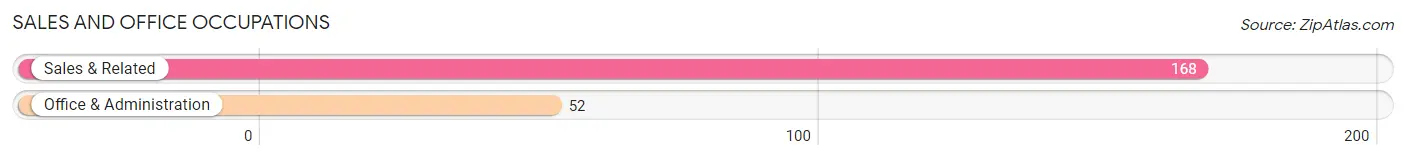
Sales and Office Occupations
The most common Sales and Office occupations in Black Point Green Point are Sales & Related (168 | 21.3%), and Office & Administration (52 | 6.6%).
Sales and Office Occupations by Sex
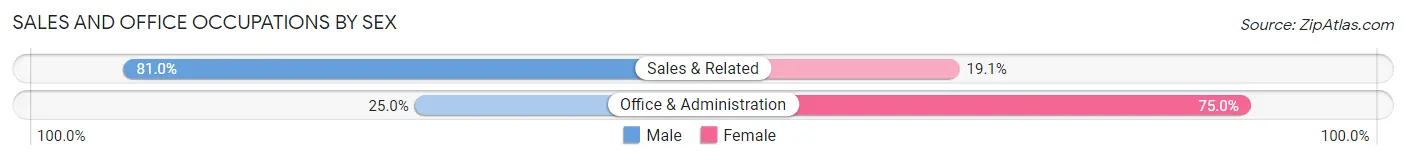
| Occupation | Male | Female |
| Sales & Related | 136 (80.9%) | 32 (19.1%) |
| Office & Administration | 13 (25.0%) | 39 (75.0%) |
| Total (Category) | 149 (67.7%) | 71 (32.3%) |
| Total (Overall) | 458 (58.2%) | 329 (41.8%) |
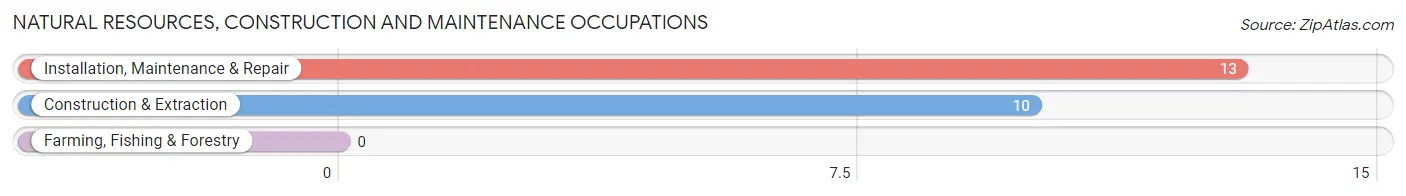
Natural Resources, Construction and Maintenance Occupations
The most common Natural Resources, Construction and Maintenance occupations in Black Point Green Point are Installation, Maintenance & Repair (13 | 1.7%), and Construction & Extraction (10 | 1.3%).
Natural Resources, Construction and Maintenance Occupations by Sex
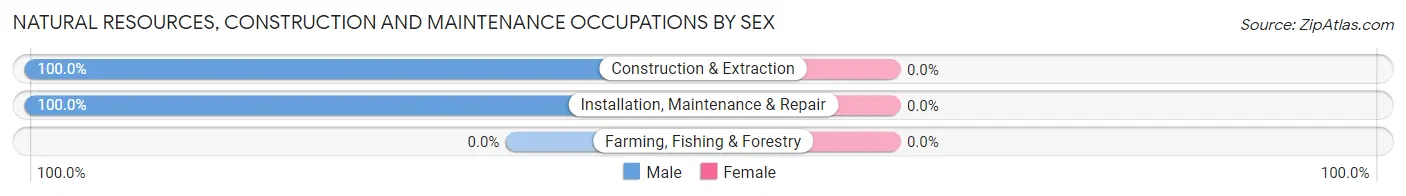
| Occupation | Male | Female |
| Farming, Fishing & Forestry | 0 (0.0%) | 0 (0.0%) |
| Construction & Extraction | 10 (100.0%) | 0 (0.0%) |
| Installation, Maintenance & Repair | 13 (100.0%) | 0 (0.0%) |
| Total (Category) | 23 (100.0%) | 0 (0.0%) |
| Total (Overall) | 458 (58.2%) | 329 (41.8%) |
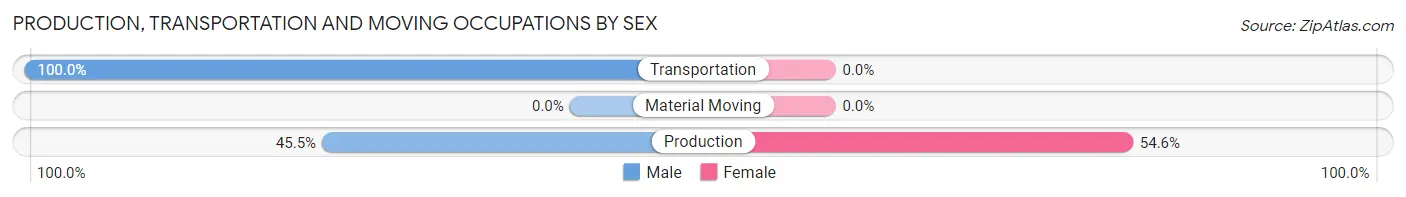
Production, Transportation and Moving Occupations
The most common Production, Transportation and Moving occupations in Black Point Green Point are Transportation (30 | 3.8%), and Production (11 | 1.4%).
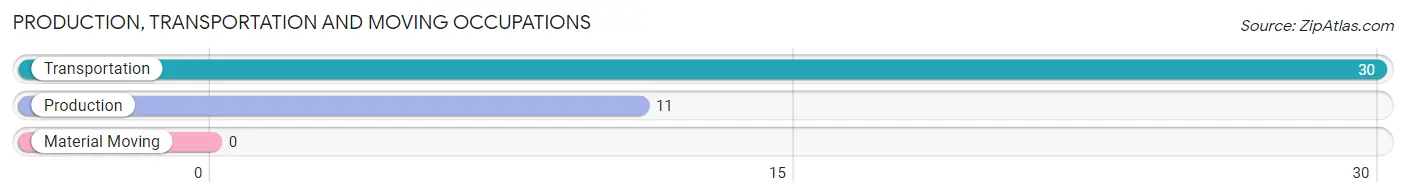
Production, Transportation and Moving Occupations by Sex
| Occupation | Male | Female |
| Production | 5 (45.5%) | 6 (54.5%) |
| Transportation | 30 (100.0%) | 0 (0.0%) |
| Material Moving | 0 (0.0%) | 0 (0.0%) |
| Total (Category) | 35 (85.4%) | 6 (14.6%) |
| Total (Overall) | 458 (58.2%) | 329 (41.8%) |
Employment Industries by Sex in Black Point Green Point
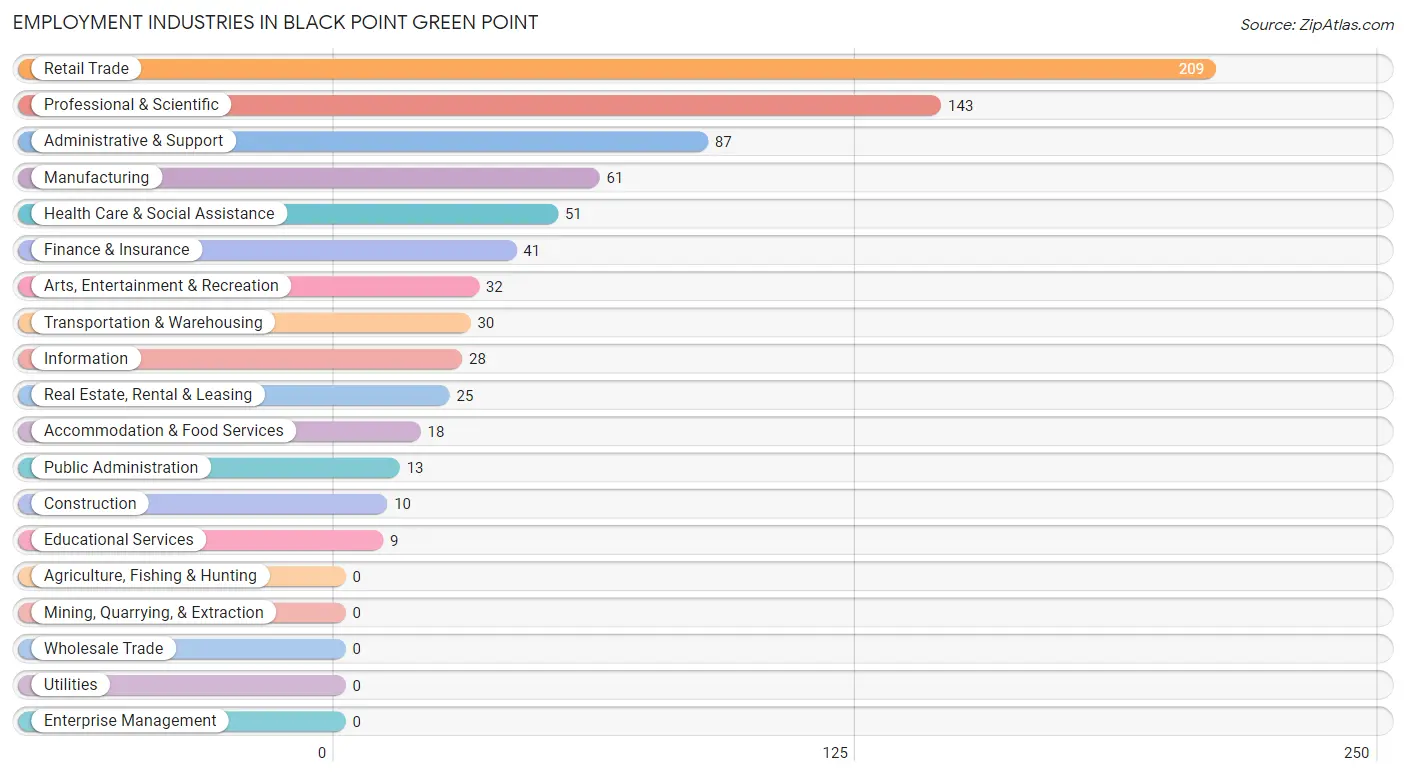
Employment Industries in Black Point Green Point
The major employment industries in Black Point Green Point include Retail Trade (209 | 26.6%), Professional & Scientific (143 | 18.2%), Administrative & Support (87 | 11.1%), Manufacturing (61 | 7.7%), and Health Care & Social Assistance (51 | 6.5%).
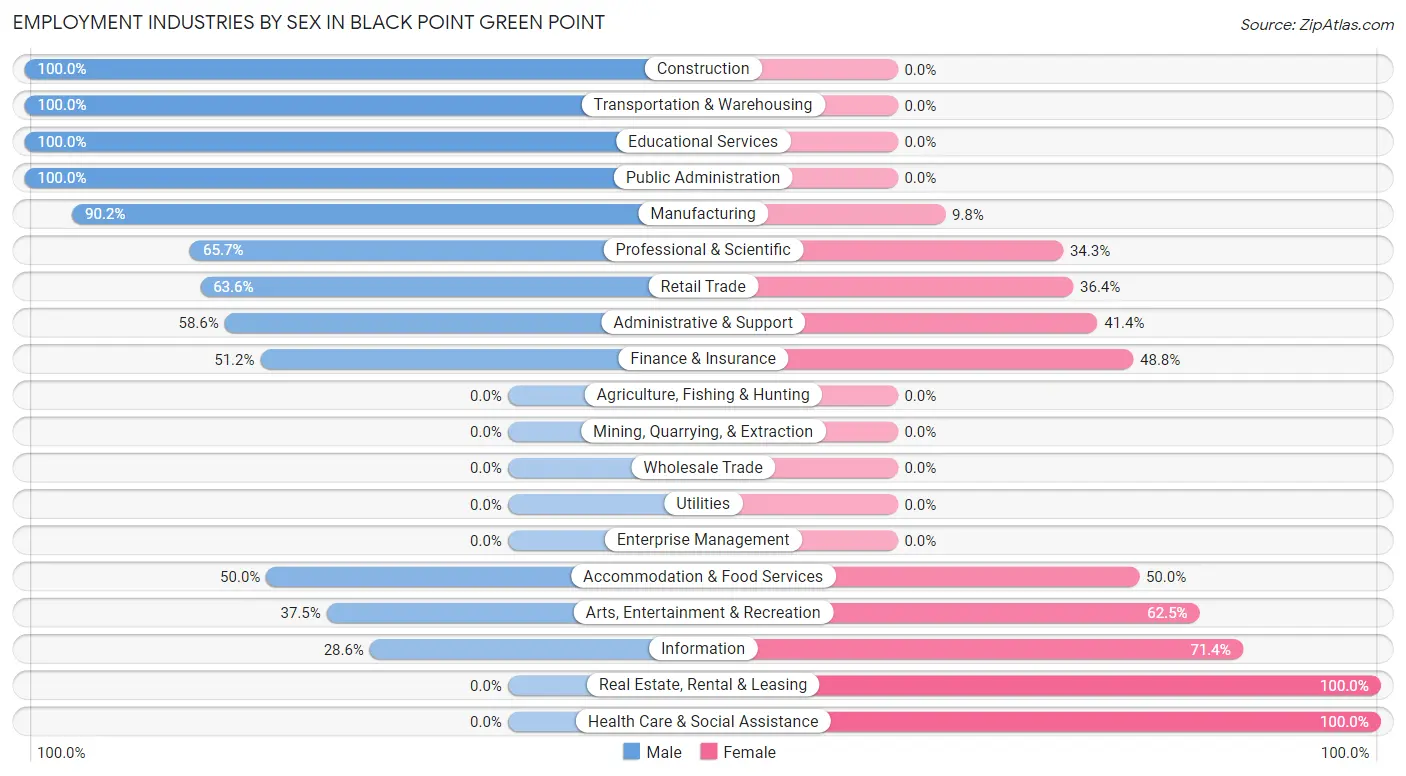
Employment Industries by Sex in Black Point Green Point
The Black Point Green Point industries that see more men than women are Construction (100.0%), Transportation & Warehousing (100.0%), and Educational Services (100.0%), whereas the industries that tend to have a higher number of women are Real Estate, Rental & Leasing (100.0%), Health Care & Social Assistance (100.0%), and Information (71.4%).
| Industry | Male | Female |
| Agriculture, Fishing & Hunting | 0 (0.0%) | 0 (0.0%) |
| Mining, Quarrying, & Extraction | 0 (0.0%) | 0 (0.0%) |
| Construction | 10 (100.0%) | 0 (0.0%) |
| Manufacturing | 55 (90.2%) | 6 (9.8%) |
| Wholesale Trade | 0 (0.0%) | 0 (0.0%) |
| Retail Trade | 133 (63.6%) | 76 (36.4%) |
| Transportation & Warehousing | 30 (100.0%) | 0 (0.0%) |
| Utilities | 0 (0.0%) | 0 (0.0%) |
| Information | 8 (28.6%) | 20 (71.4%) |
| Finance & Insurance | 21 (51.2%) | 20 (48.8%) |
| Real Estate, Rental & Leasing | 0 (0.0%) | 25 (100.0%) |
| Professional & Scientific | 94 (65.7%) | 49 (34.3%) |
| Enterprise Management | 0 (0.0%) | 0 (0.0%) |
| Administrative & Support | 51 (58.6%) | 36 (41.4%) |
| Educational Services | 9 (100.0%) | 0 (0.0%) |
| Health Care & Social Assistance | 0 (0.0%) | 51 (100.0%) |
| Arts, Entertainment & Recreation | 12 (37.5%) | 20 (62.5%) |
| Accommodation & Food Services | 9 (50.0%) | 9 (50.0%) |
| Public Administration | 13 (100.0%) | 0 (0.0%) |
| Total | 458 (58.2%) | 329 (41.8%) |
Education in Black Point Green Point
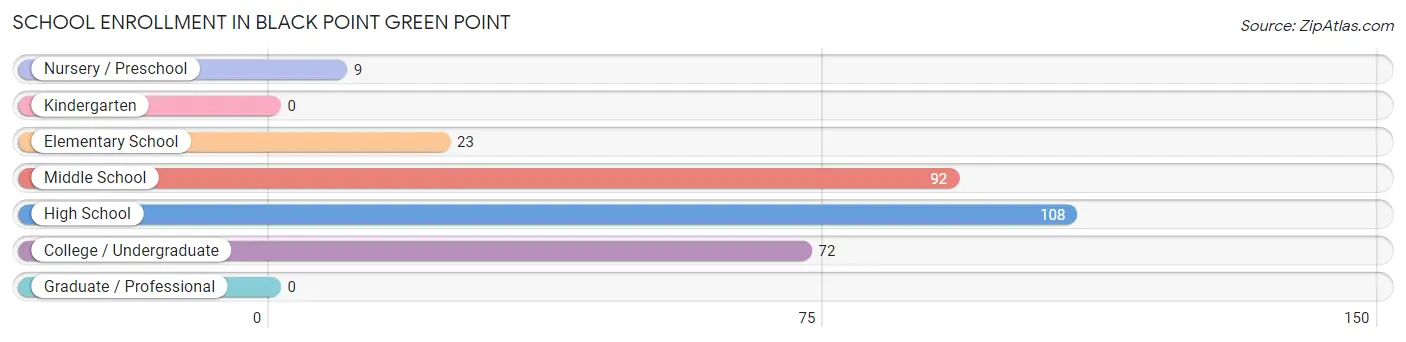
School Enrollment in Black Point Green Point
The most common levels of schooling among the 304 students in Black Point Green Point are high school (108 | 35.5%), middle school (92 | 30.3%), and college / undergraduate (72 | 23.7%).
| School Level | # Students | % Students |
| Nursery / Preschool | 9 | 3.0% |
| Kindergarten | 0 | 0.0% |
| Elementary School | 23 | 7.6% |
| Middle School | 92 | 30.3% |
| High School | 108 | 35.5% |
| College / Undergraduate | 72 | 23.7% |
| Graduate / Professional | 0 | 0.0% |
| Total | 304 | 100.0% |
School Enrollment by Age by Funding Source in Black Point Green Point
Out of a total of 304 students who are enrolled in schools in Black Point Green Point, 22 (7.2%) attend a private institution, while the remaining 282 (92.8%) are enrolled in public schools. The age group of 3 to 4 year olds has the highest likelihood of being enrolled in private schools, with 9 (100.0% in the age bracket) enrolled. Conversely, the age group of 5 to 9 year old has the lowest likelihood of being enrolled in a private school, with 12 (100.0% in the age bracket) attending a public institution.
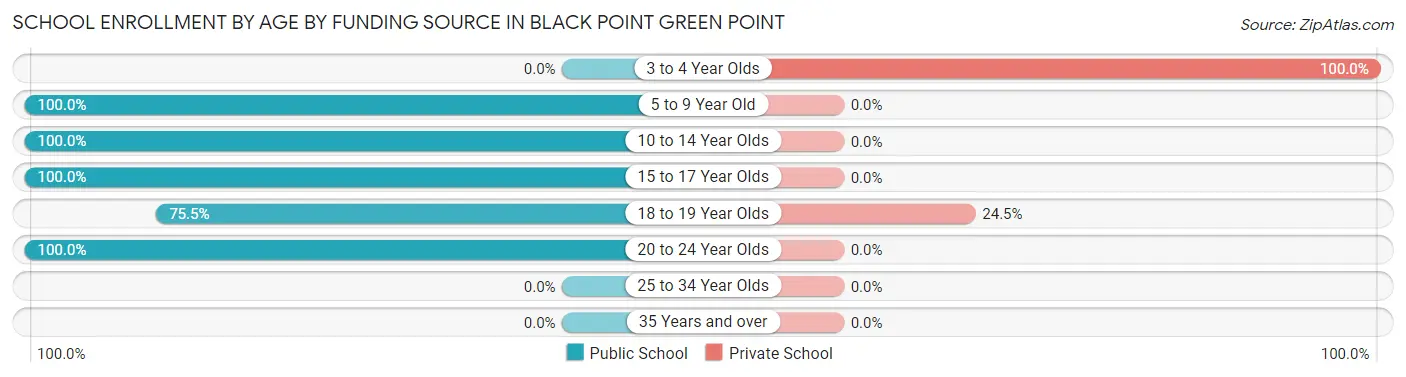
| Age Bracket | Public School | Private School |
| 3 to 4 Year Olds | 0 (0.0%) | 9 (100.0%) |
| 5 to 9 Year Old | 12 (100.0%) | 0 (0.0%) |
| 10 to 14 Year Olds | 128 (100.0%) | 0 (0.0%) |
| 15 to 17 Year Olds | 83 (100.0%) | 0 (0.0%) |
| 18 to 19 Year Olds | 40 (75.5%) | 13 (24.5%) |
| 20 to 24 Year Olds | 19 (100.0%) | 0 (0.0%) |
| 25 to 34 Year Olds | 0 (0.0%) | 0 (0.0%) |
| 35 Years and over | 0 (0.0%) | 0 (0.0%) |
| Total | 282 (92.8%) | 22 (7.2%) |
Educational Attainment by Field of Study in Black Point Green Point
Bio, nature & agricultural (198 | 24.5%), business (153 | 18.9%), computers & mathematics (78 | 9.7%), education (72 | 8.9%), and science & technology (67 | 8.3%) are the most common fields of study among 808 individuals in Black Point Green Point who have obtained a bachelor's degree or higher.
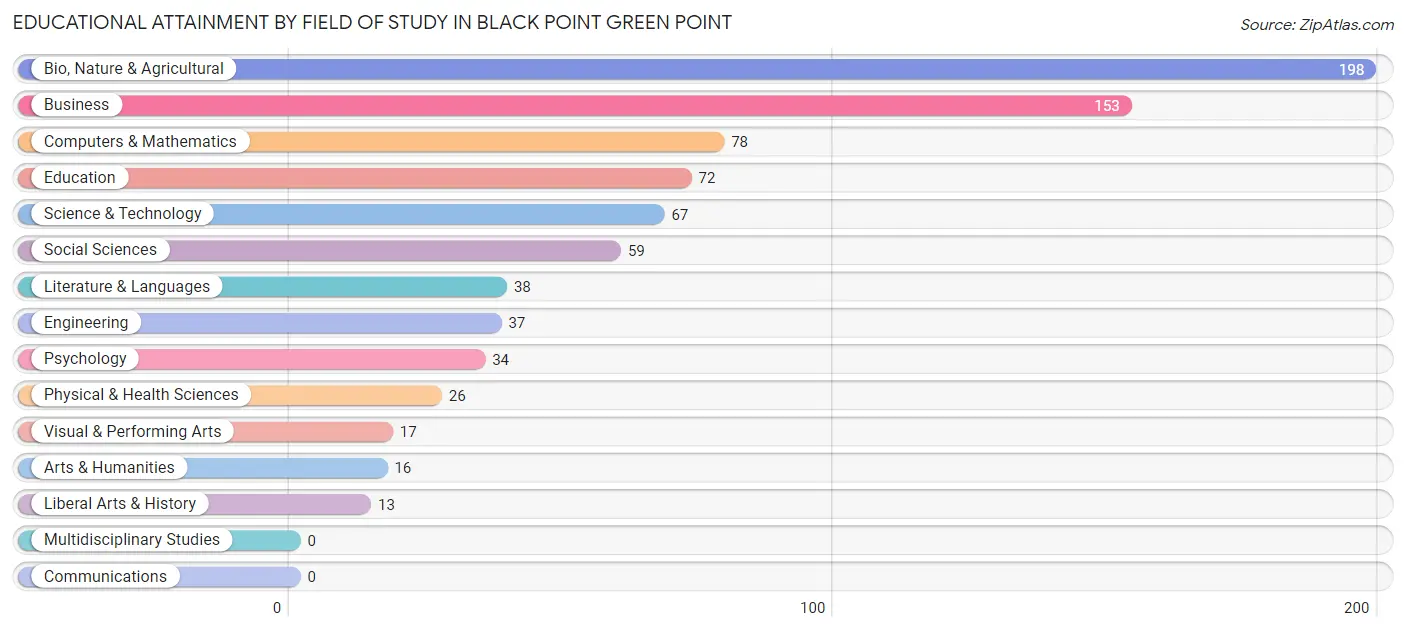
| Field of Study | # Graduates | % Graduates |
| Computers & Mathematics | 78 | 9.7% |
| Bio, Nature & Agricultural | 198 | 24.5% |
| Physical & Health Sciences | 26 | 3.2% |
| Psychology | 34 | 4.2% |
| Social Sciences | 59 | 7.3% |
| Engineering | 37 | 4.6% |
| Multidisciplinary Studies | 0 | 0.0% |
| Science & Technology | 67 | 8.3% |
| Business | 153 | 18.9% |
| Education | 72 | 8.9% |
| Literature & Languages | 38 | 4.7% |
| Liberal Arts & History | 13 | 1.6% |
| Visual & Performing Arts | 17 | 2.1% |
| Communications | 0 | 0.0% |
| Arts & Humanities | 16 | 2.0% |
| Total | 808 | 100.0% |
Transportation & Commute in Black Point Green Point
Vehicle Availability by Sex in Black Point Green Point
The most prevalent vehicle ownership categories in Black Point Green Point are males with 4 vehicles (190, accounting for 41.5%) and females with 4 vehicles (81, making up 59.8%).
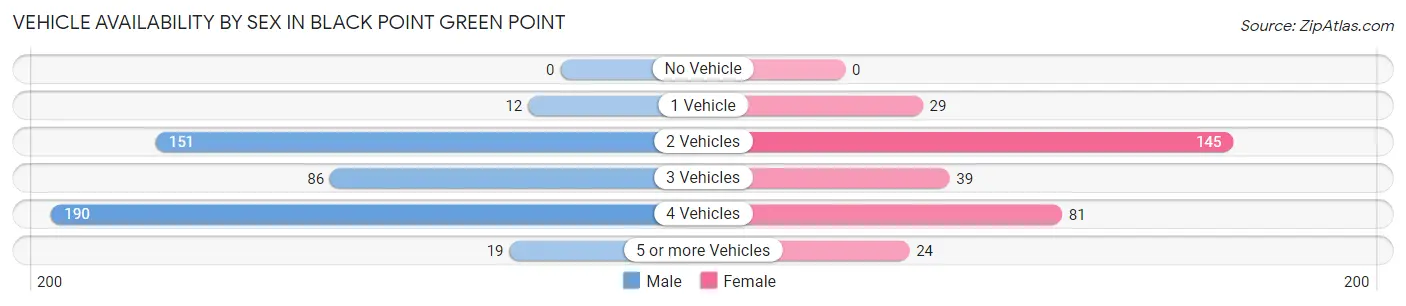
| Vehicles Available | Male | Female |
| No Vehicle | 0 (0.0%) | 0 (0.0%) |
| 1 Vehicle | 12 (2.6%) | 29 (9.1%) |
| 2 Vehicles | 151 (33.0%) | 145 (45.6%) |
| 3 Vehicles | 86 (18.8%) | 39 (12.3%) |
| 4 Vehicles | 190 (41.5%) | 81 (25.5%) |
| 5 or more Vehicles | 19 (4.2%) | 24 (7.5%) |
| Total | 458 (100.0%) | 318 (100.0%) |
Commute Time in Black Point Green Point
The most frequently occuring commute durations in Black Point Green Point are 25 to 29 minutes (101 commuters, 16.8%), 15 to 19 minutes (96 commuters, 16.0%), and 20 to 24 minutes (85 commuters, 14.2%).
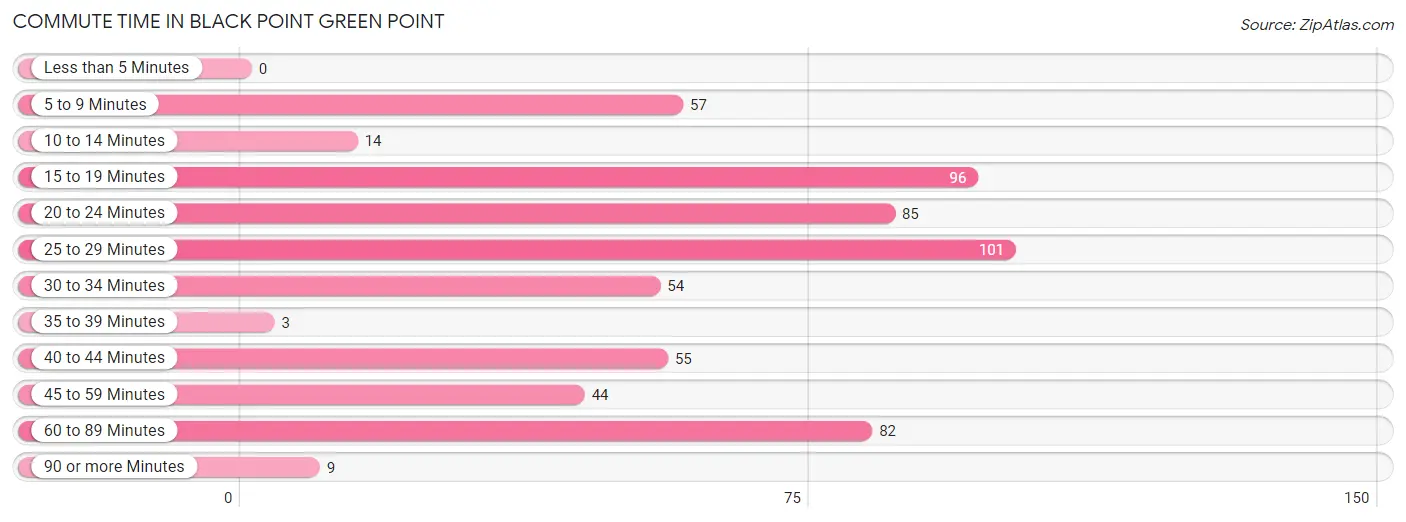
| Commute Time | # Commuters | % Commuters |
| Less than 5 Minutes | 0 | 0.0% |
| 5 to 9 Minutes | 57 | 9.5% |
| 10 to 14 Minutes | 14 | 2.3% |
| 15 to 19 Minutes | 96 | 16.0% |
| 20 to 24 Minutes | 85 | 14.2% |
| 25 to 29 Minutes | 101 | 16.8% |
| 30 to 34 Minutes | 54 | 9.0% |
| 35 to 39 Minutes | 3 | 0.5% |
| 40 to 44 Minutes | 55 | 9.2% |
| 45 to 59 Minutes | 44 | 7.3% |
| 60 to 89 Minutes | 82 | 13.7% |
| 90 or more Minutes | 9 | 1.5% |
Commute Time by Sex in Black Point Green Point
The most common commute times in Black Point Green Point are 25 to 29 minutes (85 commuters, 21.8%) for males and 5 to 9 minutes (44 commuters, 20.9%) for females.
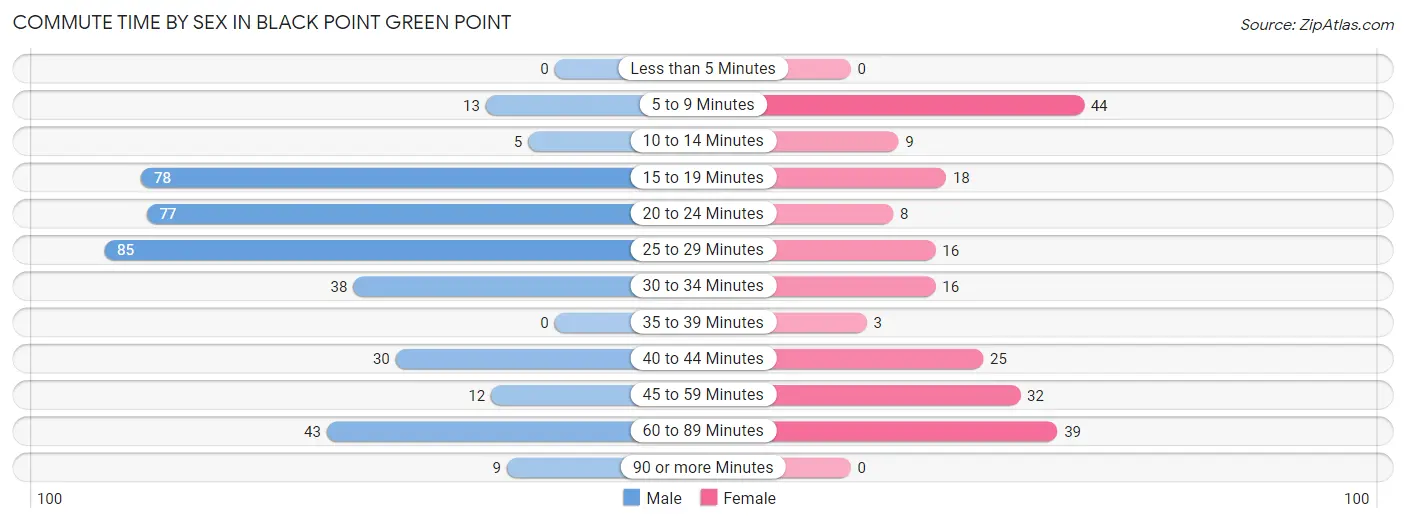
| Commute Time | Male | Female |
| Less than 5 Minutes | 0 (0.0%) | 0 (0.0%) |
| 5 to 9 Minutes | 13 (3.3%) | 44 (20.9%) |
| 10 to 14 Minutes | 5 (1.3%) | 9 (4.3%) |
| 15 to 19 Minutes | 78 (20.0%) | 18 (8.6%) |
| 20 to 24 Minutes | 77 (19.7%) | 8 (3.8%) |
| 25 to 29 Minutes | 85 (21.8%) | 16 (7.6%) |
| 30 to 34 Minutes | 38 (9.7%) | 16 (7.6%) |
| 35 to 39 Minutes | 0 (0.0%) | 3 (1.4%) |
| 40 to 44 Minutes | 30 (7.7%) | 25 (11.9%) |
| 45 to 59 Minutes | 12 (3.1%) | 32 (15.2%) |
| 60 to 89 Minutes | 43 (11.0%) | 39 (18.6%) |
| 90 or more Minutes | 9 (2.3%) | 0 (0.0%) |
Time of Departure to Work by Sex in Black Point Green Point
The most frequent times of departure to work in Black Point Green Point are 8:00 AM to 8:29 AM (171, 43.9%) for males and 8:30 AM to 8:59 AM (51, 24.3%) for females.
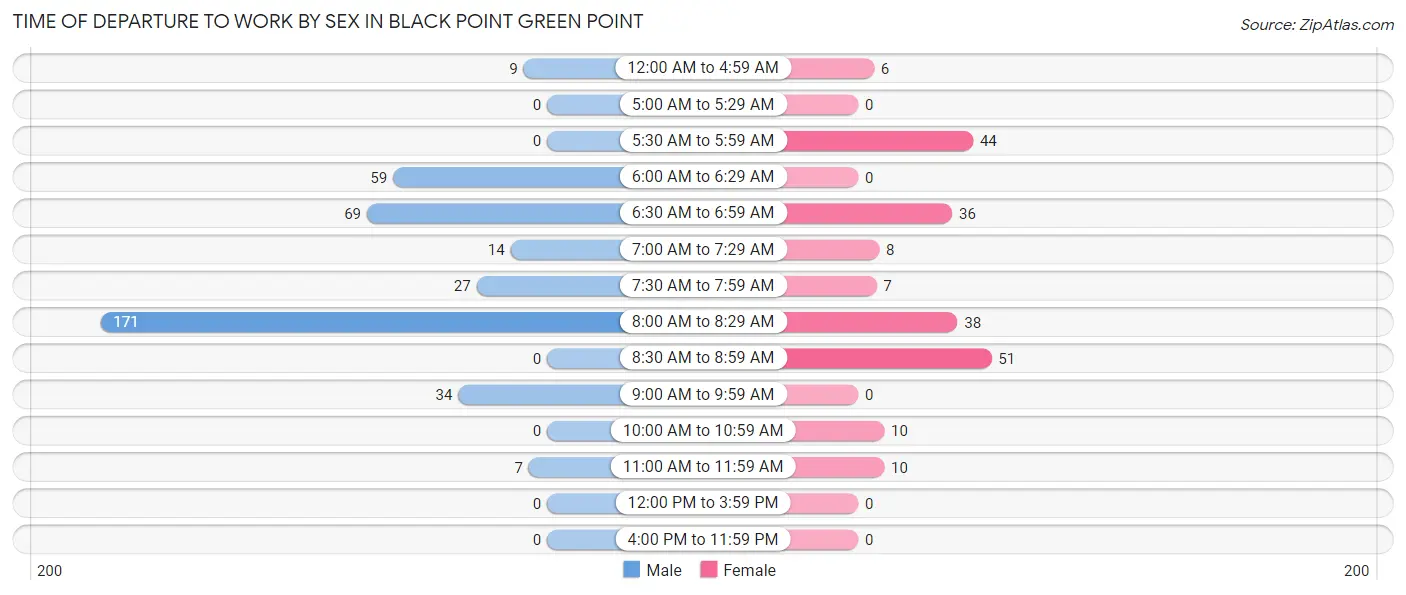
| Time of Departure | Male | Female |
| 12:00 AM to 4:59 AM | 9 (2.3%) | 6 (2.9%) |
| 5:00 AM to 5:29 AM | 0 (0.0%) | 0 (0.0%) |
| 5:30 AM to 5:59 AM | 0 (0.0%) | 44 (20.9%) |
| 6:00 AM to 6:29 AM | 59 (15.1%) | 0 (0.0%) |
| 6:30 AM to 6:59 AM | 69 (17.7%) | 36 (17.1%) |
| 7:00 AM to 7:29 AM | 14 (3.6%) | 8 (3.8%) |
| 7:30 AM to 7:59 AM | 27 (6.9%) | 7 (3.3%) |
| 8:00 AM to 8:29 AM | 171 (43.9%) | 38 (18.1%) |
| 8:30 AM to 8:59 AM | 0 (0.0%) | 51 (24.3%) |
| 9:00 AM to 9:59 AM | 34 (8.7%) | 0 (0.0%) |
| 10:00 AM to 10:59 AM | 0 (0.0%) | 10 (4.8%) |
| 11:00 AM to 11:59 AM | 7 (1.8%) | 10 (4.8%) |
| 12:00 PM to 3:59 PM | 0 (0.0%) | 0 (0.0%) |
| 4:00 PM to 11:59 PM | 0 (0.0%) | 0 (0.0%) |
| Total | 390 (100.0%) | 210 (100.0%) |
Housing Occupancy in Black Point Green Point
Occupancy by Ownership in Black Point Green Point
Of the total 702 dwellings in Black Point Green Point, owner-occupied units account for 606 (86.3%), while renter-occupied units make up 96 (13.7%).
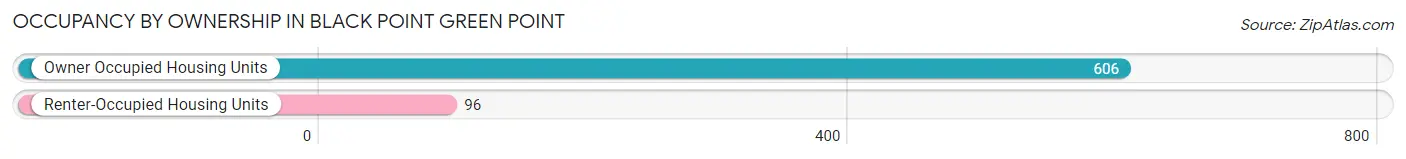
| Occupancy | # Housing Units | % Housing Units |
| Owner Occupied Housing Units | 606 | 86.3% |
| Renter-Occupied Housing Units | 96 | 13.7% |
| Total Occupied Housing Units | 702 | 100.0% |
Occupancy by Household Size in Black Point Green Point
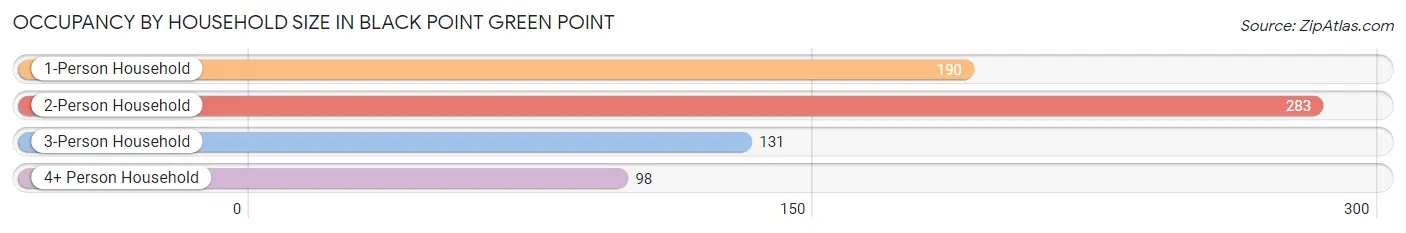
| Household Size | # Housing Units | % Housing Units |
| 1-Person Household | 190 | 27.1% |
| 2-Person Household | 283 | 40.3% |
| 3-Person Household | 131 | 18.7% |
| 4+ Person Household | 98 | 14.0% |
| Total Housing Units | 702 | 100.0% |
Occupancy by Ownership by Household Size in Black Point Green Point
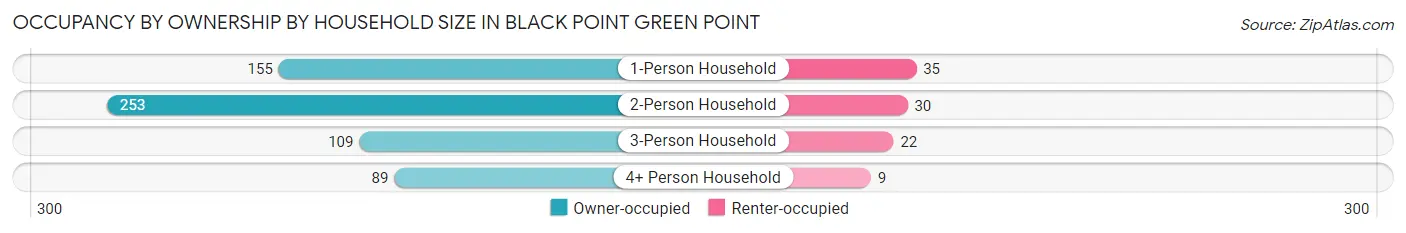
| Household Size | Owner-occupied | Renter-occupied |
| 1-Person Household | 155 (81.6%) | 35 (18.4%) |
| 2-Person Household | 253 (89.4%) | 30 (10.6%) |
| 3-Person Household | 109 (83.2%) | 22 (16.8%) |
| 4+ Person Household | 89 (90.8%) | 9 (9.2%) |
| Total Housing Units | 606 (86.3%) | 96 (13.7%) |
Occupancy by Educational Attainment in Black Point Green Point
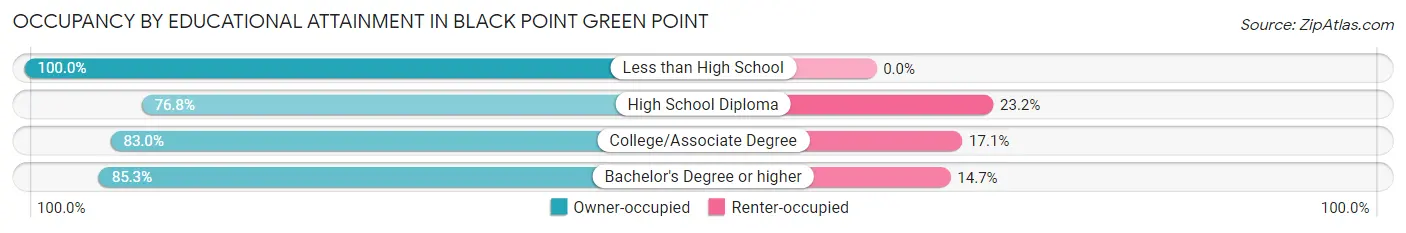
| Household Size | Owner-occupied | Renter-occupied |
| Less than High School | 110 (100.0%) | 0 (0.0%) |
| High School Diploma | 53 (76.8%) | 16 (23.2%) |
| College/Associate Degree | 107 (83.0%) | 22 (17.1%) |
| Bachelor's Degree or higher | 336 (85.3%) | 58 (14.7%) |
Occupancy by Age of Householder in Black Point Green Point
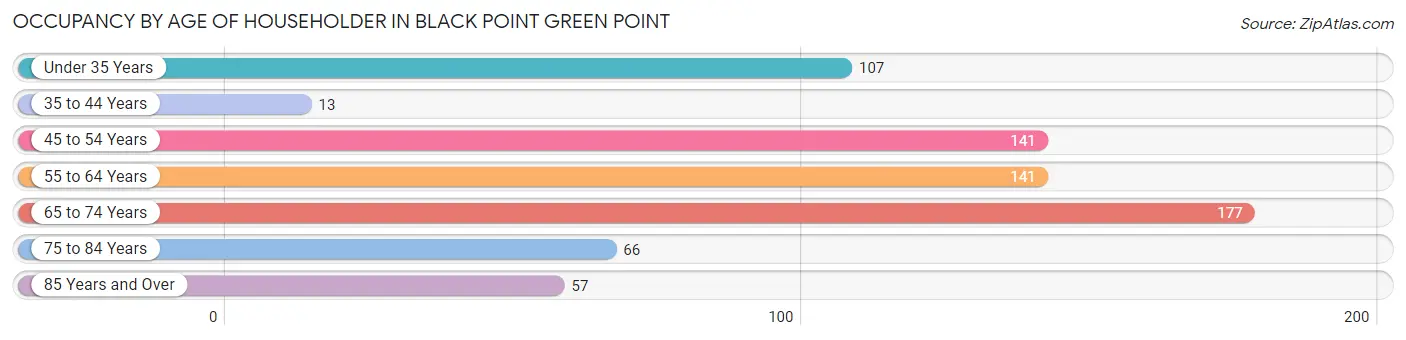
| Age Bracket | # Households | % Households |
| Under 35 Years | 107 | 15.2% |
| 35 to 44 Years | 13 | 1.8% |
| 45 to 54 Years | 141 | 20.1% |
| 55 to 64 Years | 141 | 20.1% |
| 65 to 74 Years | 177 | 25.2% |
| 75 to 84 Years | 66 | 9.4% |
| 85 Years and Over | 57 | 8.1% |
| Total | 702 | 100.0% |
Housing Finances in Black Point Green Point
Median Income by Occupancy in Black Point Green Point
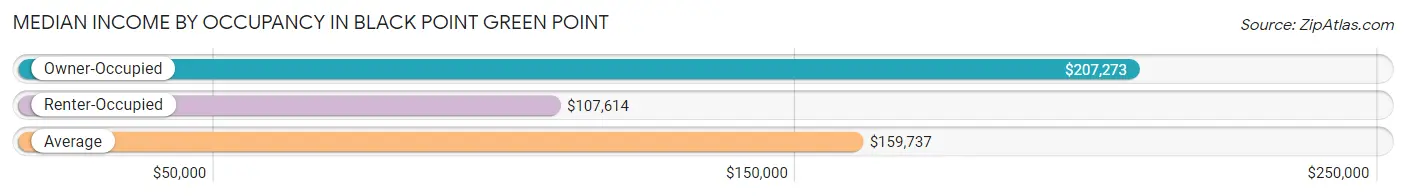
| Occupancy Type | # Households | Median Income |
| Owner-Occupied | 606 (86.3%) | $207,273 |
| Renter-Occupied | 96 (13.7%) | $107,614 |
| Average | 702 (100.0%) | $159,737 |
Occupancy by Householder Income Bracket in Black Point Green Point
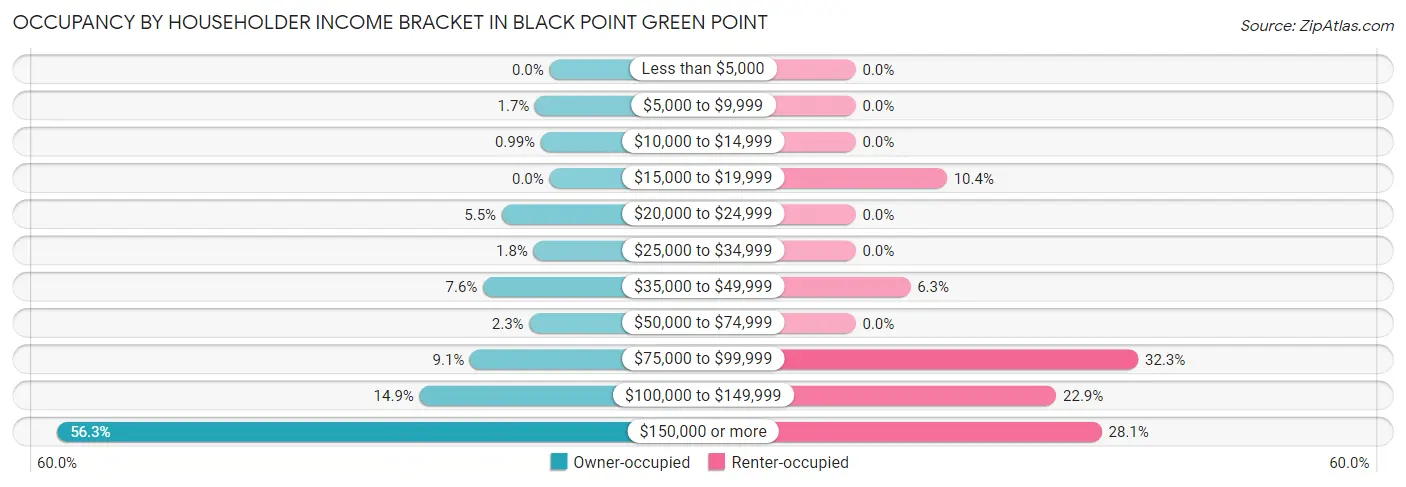
| Income Bracket | Owner-occupied | Renter-occupied |
| Less than $5,000 | 0 (0.0%) | 0 (0.0%) |
| $5,000 to $9,999 | 10 (1.7%) | 0 (0.0%) |
| $10,000 to $14,999 | 6 (1.0%) | 0 (0.0%) |
| $15,000 to $19,999 | 0 (0.0%) | 10 (10.4%) |
| $20,000 to $24,999 | 33 (5.4%) | 0 (0.0%) |
| $25,000 to $34,999 | 11 (1.8%) | 0 (0.0%) |
| $35,000 to $49,999 | 46 (7.6%) | 6 (6.2%) |
| $50,000 to $74,999 | 14 (2.3%) | 0 (0.0%) |
| $75,000 to $99,999 | 55 (9.1%) | 31 (32.3%) |
| $100,000 to $149,999 | 90 (14.8%) | 22 (22.9%) |
| $150,000 or more | 341 (56.3%) | 27 (28.1%) |
| Total | 606 (100.0%) | 96 (100.0%) |
Monthly Housing Cost Tiers in Black Point Green Point
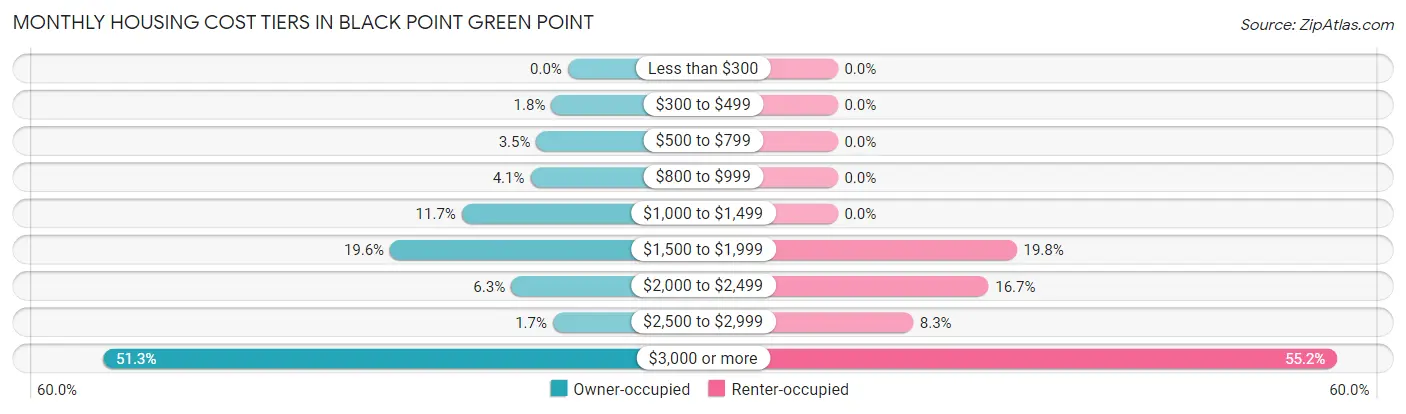
| Monthly Cost | Owner-occupied | Renter-occupied |
| Less than $300 | 0 (0.0%) | 0 (0.0%) |
| $300 to $499 | 11 (1.8%) | 0 (0.0%) |
| $500 to $799 | 21 (3.5%) | 0 (0.0%) |
| $800 to $999 | 25 (4.1%) | 0 (0.0%) |
| $1,000 to $1,499 | 71 (11.7%) | 0 (0.0%) |
| $1,500 to $1,999 | 119 (19.6%) | 19 (19.8%) |
| $2,000 to $2,499 | 38 (6.3%) | 16 (16.7%) |
| $2,500 to $2,999 | 10 (1.7%) | 8 (8.3%) |
| $3,000 or more | 311 (51.3%) | 53 (55.2%) |
| Total | 606 (100.0%) | 96 (100.0%) |
Physical Housing Characteristics in Black Point Green Point
Housing Structures in Black Point Green Point
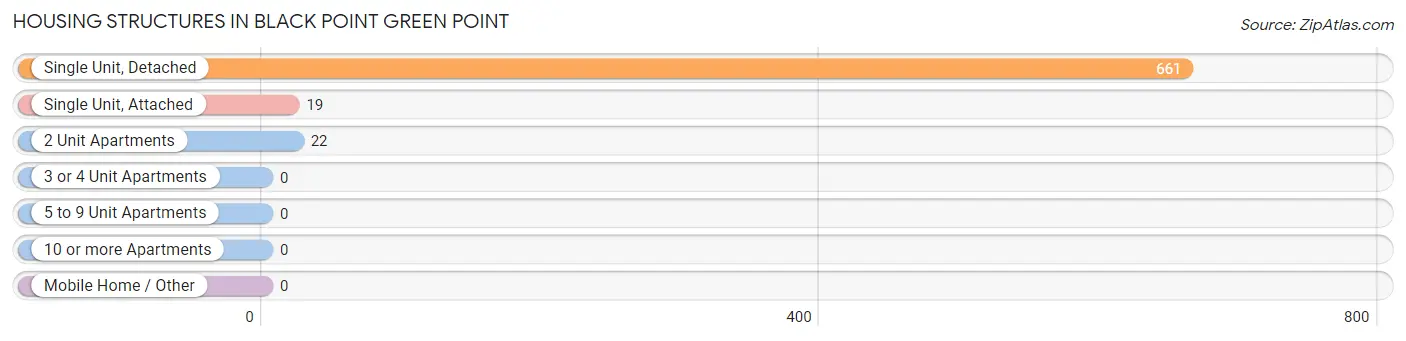
| Structure Type | # Housing Units | % Housing Units |
| Single Unit, Detached | 661 | 94.2% |
| Single Unit, Attached | 19 | 2.7% |
| 2 Unit Apartments | 22 | 3.1% |
| 3 or 4 Unit Apartments | 0 | 0.0% |
| 5 to 9 Unit Apartments | 0 | 0.0% |
| 10 or more Apartments | 0 | 0.0% |
| Mobile Home / Other | 0 | 0.0% |
| Total | 702 | 100.0% |
Housing Structures by Occupancy in Black Point Green Point
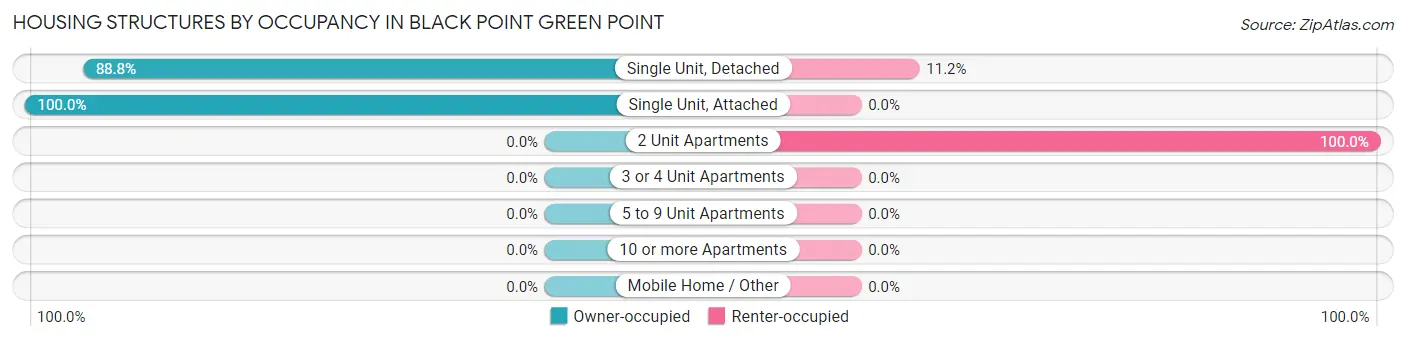
| Structure Type | Owner-occupied | Renter-occupied |
| Single Unit, Detached | 587 (88.8%) | 74 (11.2%) |
| Single Unit, Attached | 19 (100.0%) | 0 (0.0%) |
| 2 Unit Apartments | 0 (0.0%) | 22 (100.0%) |
| 3 or 4 Unit Apartments | 0 (0.0%) | 0 (0.0%) |
| 5 to 9 Unit Apartments | 0 (0.0%) | 0 (0.0%) |
| 10 or more Apartments | 0 (0.0%) | 0 (0.0%) |
| Mobile Home / Other | 0 (0.0%) | 0 (0.0%) |
| Total | 606 (86.3%) | 96 (13.7%) |
Housing Structures by Number of Rooms in Black Point Green Point
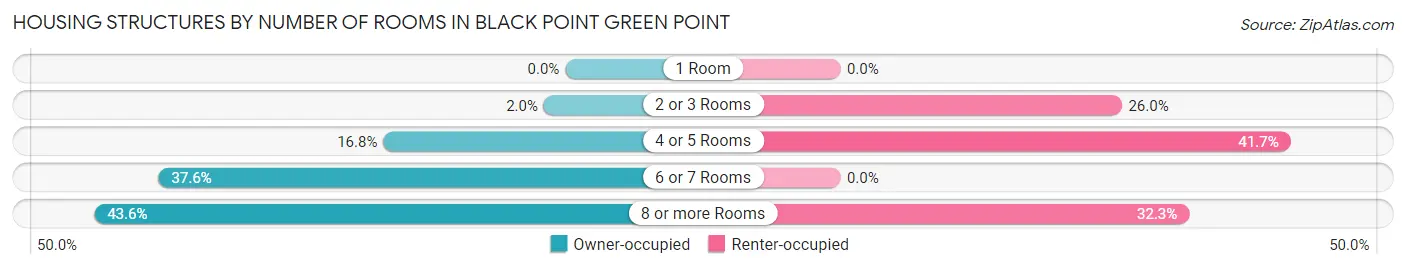
| Number of Rooms | Owner-occupied | Renter-occupied |
| 1 Room | 0 (0.0%) | 0 (0.0%) |
| 2 or 3 Rooms | 12 (2.0%) | 25 (26.0%) |
| 4 or 5 Rooms | 102 (16.8%) | 40 (41.7%) |
| 6 or 7 Rooms | 228 (37.6%) | 0 (0.0%) |
| 8 or more Rooms | 264 (43.6%) | 31 (32.3%) |
| Total | 606 (100.0%) | 96 (100.0%) |
Housing Structure by Heating Type in Black Point Green Point
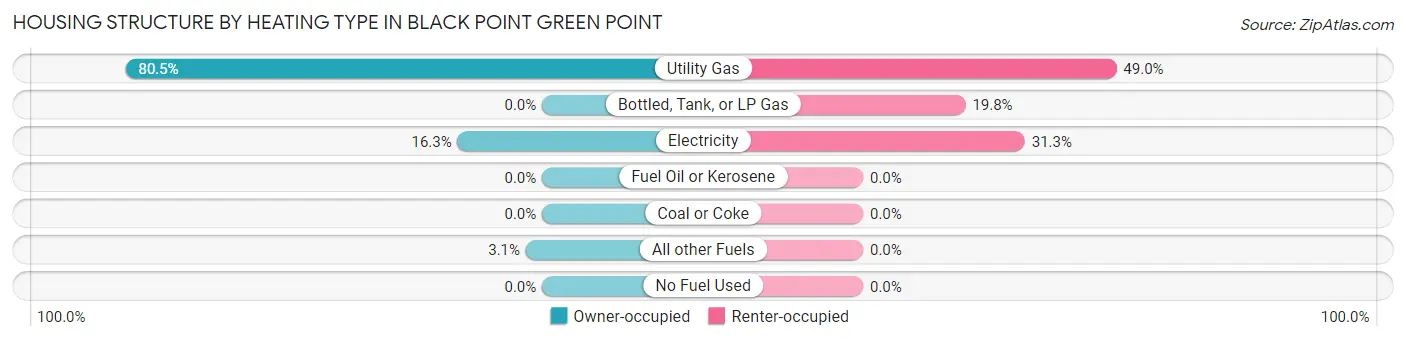
| Heating Type | Owner-occupied | Renter-occupied |
| Utility Gas | 488 (80.5%) | 47 (49.0%) |
| Bottled, Tank, or LP Gas | 0 (0.0%) | 19 (19.8%) |
| Electricity | 99 (16.3%) | 30 (31.2%) |
| Fuel Oil or Kerosene | 0 (0.0%) | 0 (0.0%) |
| Coal or Coke | 0 (0.0%) | 0 (0.0%) |
| All other Fuels | 19 (3.1%) | 0 (0.0%) |
| No Fuel Used | 0 (0.0%) | 0 (0.0%) |
| Total | 606 (100.0%) | 96 (100.0%) |
Household Vehicle Usage in Black Point Green Point
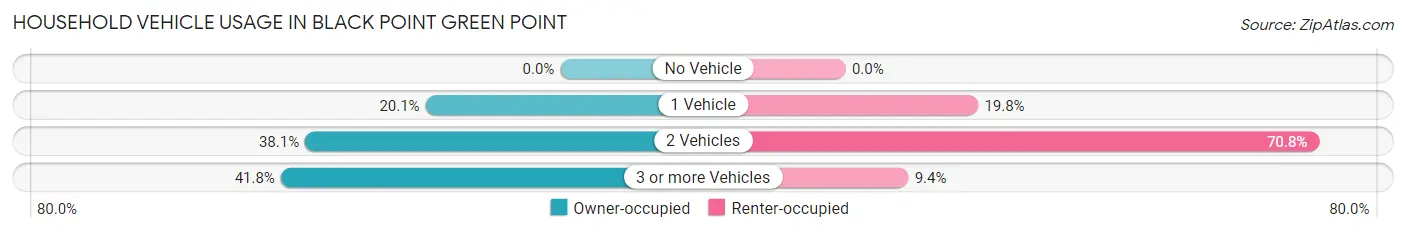
| Vehicles per Household | Owner-occupied | Renter-occupied |
| No Vehicle | 0 (0.0%) | 0 (0.0%) |
| 1 Vehicle | 122 (20.1%) | 19 (19.8%) |
| 2 Vehicles | 231 (38.1%) | 68 (70.8%) |
| 3 or more Vehicles | 253 (41.7%) | 9 (9.4%) |
| Total | 606 (100.0%) | 96 (100.0%) |
Real Estate & Mortgages in Black Point Green Point
Real Estate and Mortgage Overview in Black Point Green Point
| Characteristic | Without Mortgage | With Mortgage |
| Housing Units | 247 | 359 |
| Median Property Value | $1,668,800 | $1,453,900 |
| Median Household Income | $250,001 | $204 |
| Monthly Housing Costs | $1,501 | $283 |
| Real Estate Taxes | $10,001 | $0 |
Property Value by Mortgage Status in Black Point Green Point
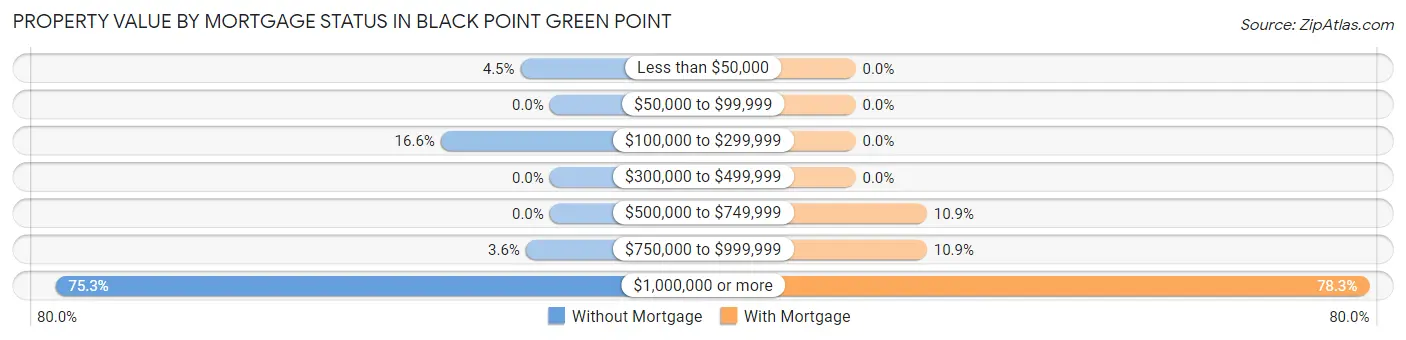
| Property Value | Without Mortgage | With Mortgage |
| Less than $50,000 | 11 (4.4%) | 0 (0.0%) |
| $50,000 to $99,999 | 0 (0.0%) | 0 (0.0%) |
| $100,000 to $299,999 | 41 (16.6%) | 0 (0.0%) |
| $300,000 to $499,999 | 0 (0.0%) | 0 (0.0%) |
| $500,000 to $749,999 | 0 (0.0%) | 39 (10.9%) |
| $750,000 to $999,999 | 9 (3.6%) | 39 (10.9%) |
| $1,000,000 or more | 186 (75.3%) | 281 (78.3%) |
| Total | 247 (100.0%) | 359 (100.0%) |
Household Income by Mortgage Status in Black Point Green Point
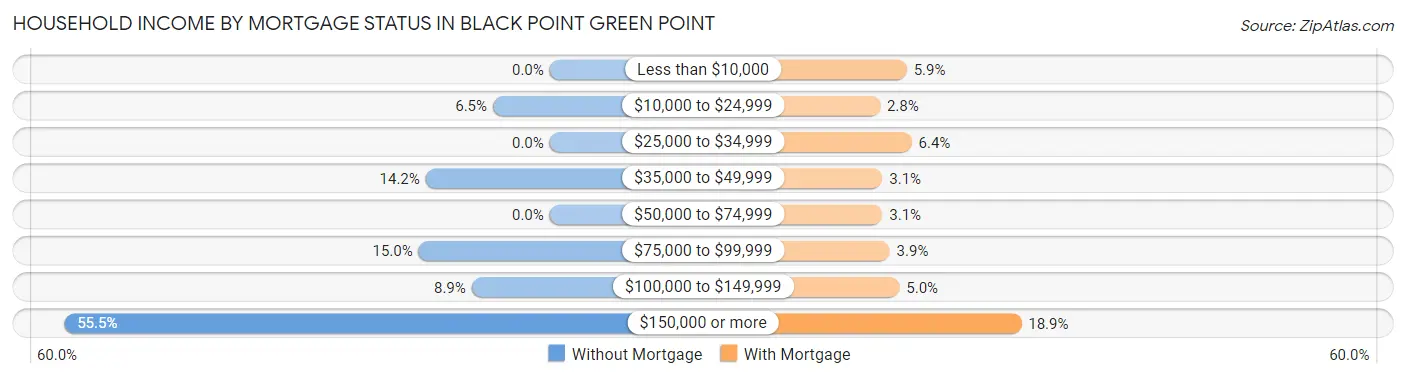
| Household Income | Without Mortgage | With Mortgage |
| Less than $10,000 | 0 (0.0%) | 21 (5.9%) |
| $10,000 to $24,999 | 16 (6.5%) | 10 (2.8%) |
| $25,000 to $34,999 | 0 (0.0%) | 23 (6.4%) |
| $35,000 to $49,999 | 35 (14.2%) | 11 (3.1%) |
| $50,000 to $74,999 | 0 (0.0%) | 11 (3.1%) |
| $75,000 to $99,999 | 37 (15.0%) | 14 (3.9%) |
| $100,000 to $149,999 | 22 (8.9%) | 18 (5.0%) |
| $150,000 or more | 137 (55.5%) | 68 (18.9%) |
| Total | 247 (100.0%) | 359 (100.0%) |
Property Value to Household Income Ratio in Black Point Green Point
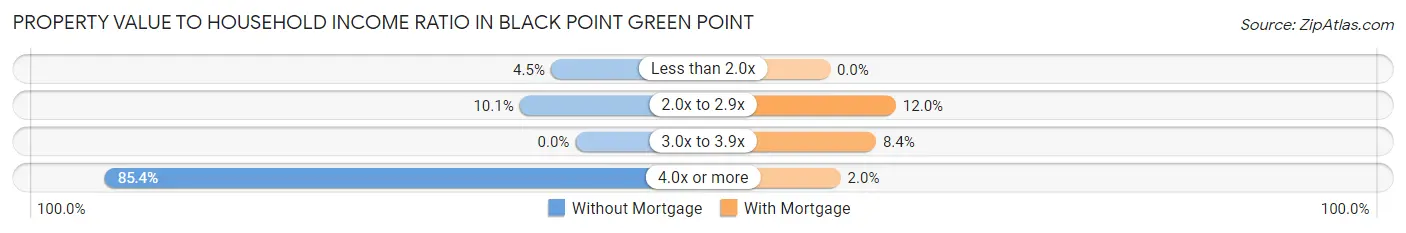
| Value-to-Income Ratio | Without Mortgage | With Mortgage |
| Less than 2.0x | 11 (4.4%) | 0 (0.0%) |
| 2.0x to 2.9x | 25 (10.1%) | 43 (12.0%) |
| 3.0x to 3.9x | 0 (0.0%) | 30 (8.4%) |
| 4.0x or more | 211 (85.4%) | 7 (1.9%) |
| Total | 247 (100.0%) | 359 (100.0%) |
Real Estate Taxes by Mortgage Status in Black Point Green Point
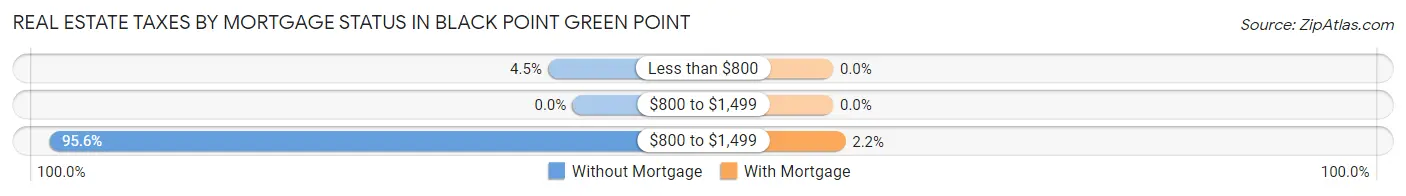
| Property Taxes | Without Mortgage | With Mortgage |
| Less than $800 | 11 (4.4%) | 0 (0.0%) |
| $800 to $1,499 | 0 (0.0%) | 0 (0.0%) |
| $800 to $1,499 | 236 (95.6%) | 8 (2.2%) |
| Total | 247 (100.0%) | 359 (100.0%) |
Health & Disability in Black Point Green Point
Health Insurance Coverage by Age in Black Point Green Point
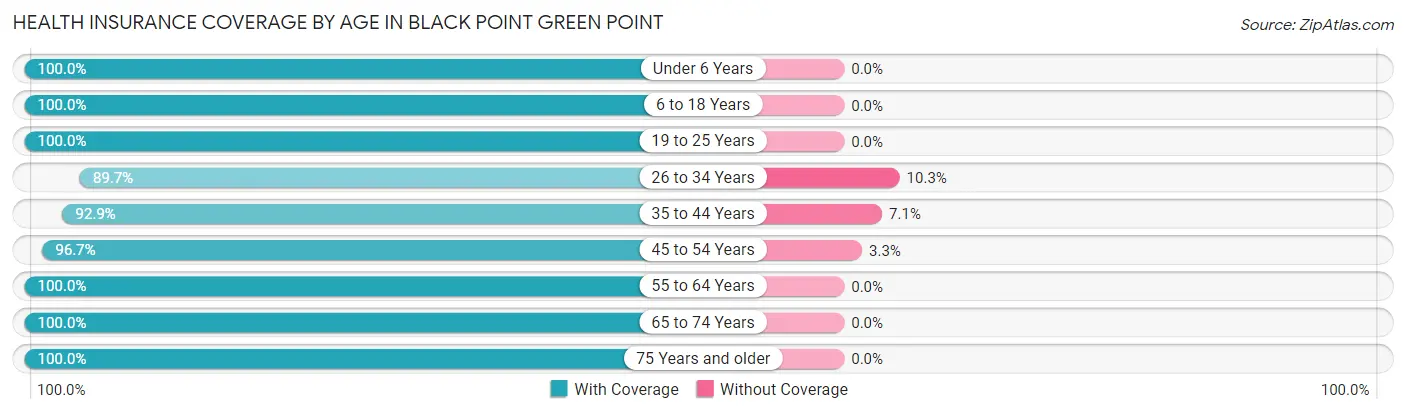
| Age Bracket | With Coverage | Without Coverage |
| Under 6 Years | 35 (100.0%) | 0 (0.0%) |
| 6 to 18 Years | 257 (100.0%) | 0 (0.0%) |
| 19 to 25 Years | 85 (100.0%) | 0 (0.0%) |
| 26 to 34 Years | 139 (89.7%) | 16 (10.3%) |
| 35 to 44 Years | 79 (92.9%) | 6 (7.1%) |
| 45 to 54 Years | 291 (96.7%) | 10 (3.3%) |
| 55 to 64 Years | 175 (100.0%) | 0 (0.0%) |
| 65 to 74 Years | 447 (100.0%) | 0 (0.0%) |
| 75 Years and older | 144 (100.0%) | 0 (0.0%) |
| Total | 1,652 (98.1%) | 32 (1.9%) |
Health Insurance Coverage by Citizenship Status in Black Point Green Point
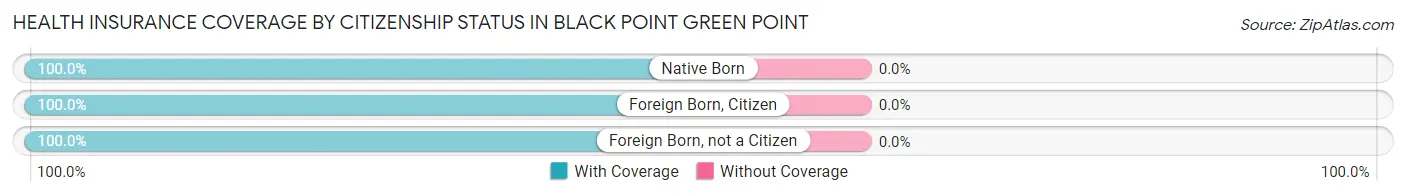
| Citizenship Status | With Coverage | Without Coverage |
| Native Born | 35 (100.0%) | 0 (0.0%) |
| Foreign Born, Citizen | 257 (100.0%) | 0 (0.0%) |
| Foreign Born, not a Citizen | 85 (100.0%) | 0 (0.0%) |
Health Insurance Coverage by Household Income in Black Point Green Point
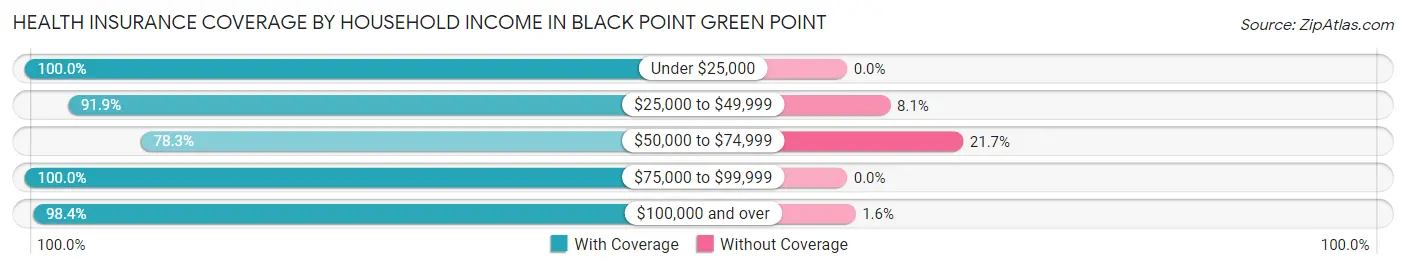
| Household Income | With Coverage | Without Coverage |
| Under $25,000 | 69 (100.0%) | 0 (0.0%) |
| $25,000 to $49,999 | 68 (91.9%) | 6 (8.1%) |
| $50,000 to $74,999 | 18 (78.3%) | 5 (21.7%) |
| $75,000 to $99,999 | 192 (100.0%) | 0 (0.0%) |
| $100,000 and over | 1,305 (98.4%) | 21 (1.6%) |
Public vs Private Health Insurance Coverage by Age in Black Point Green Point
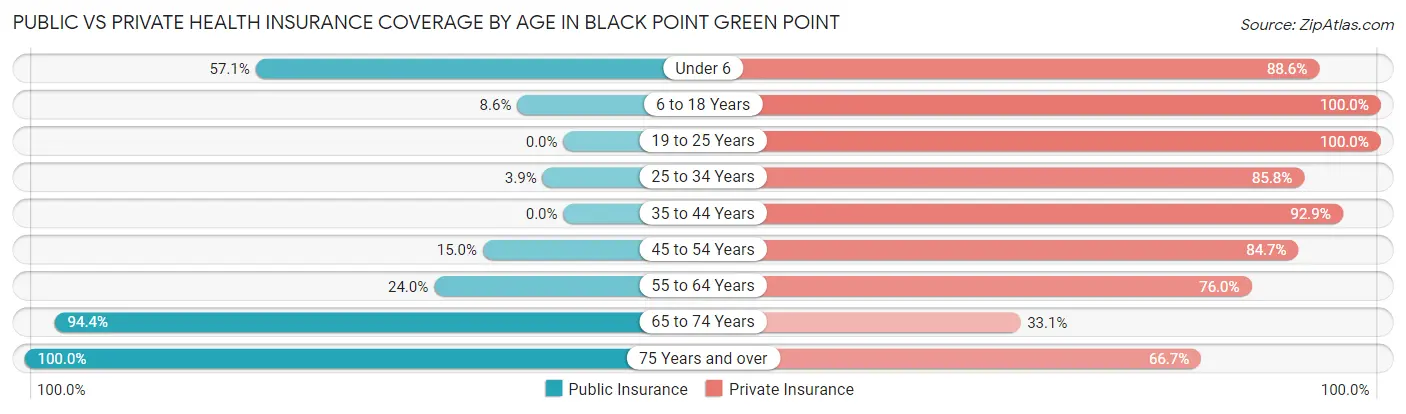
| Age Bracket | Public Insurance | Private Insurance |
| Under 6 | 20 (57.1%) | 31 (88.6%) |
| 6 to 18 Years | 22 (8.6%) | 257 (100.0%) |
| 19 to 25 Years | 0 (0.0%) | 85 (100.0%) |
| 25 to 34 Years | 6 (3.9%) | 133 (85.8%) |
| 35 to 44 Years | 0 (0.0%) | 79 (92.9%) |
| 45 to 54 Years | 45 (14.9%) | 255 (84.7%) |
| 55 to 64 Years | 42 (24.0%) | 133 (76.0%) |
| 65 to 74 Years | 422 (94.4%) | 148 (33.1%) |
| 75 Years and over | 144 (100.0%) | 96 (66.7%) |
| Total | 701 (41.6%) | 1,217 (72.3%) |
Disability Status by Sex by Age in Black Point Green Point
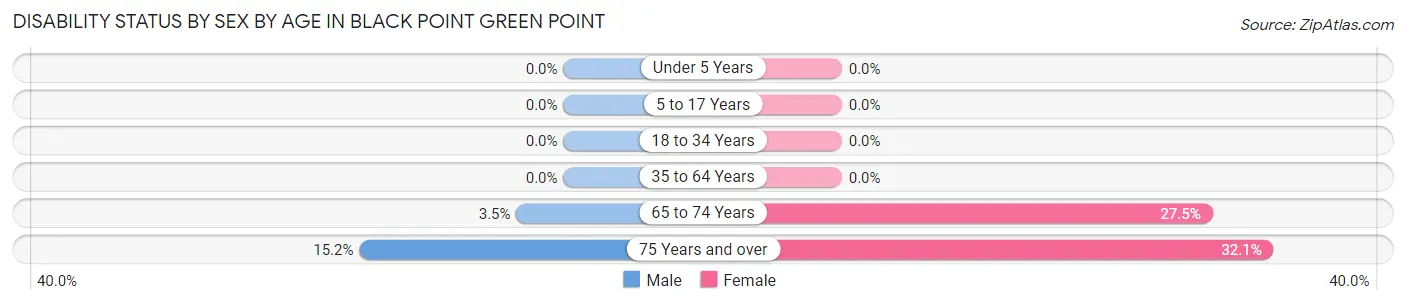
| Age Bracket | Male | Female |
| Under 5 Years | 0 (0.0%) | 0 (0.0%) |
| 5 to 17 Years | 0 (0.0%) | 0 (0.0%) |
| 18 to 34 Years | 0 (0.0%) | 0 (0.0%) |
| 35 to 64 Years | 0 (0.0%) | 0 (0.0%) |
| 65 to 74 Years | 8 (3.5%) | 60 (27.5%) |
| 75 Years and over | 10 (15.1%) | 25 (32.1%) |
Disability Class by Sex by Age in Black Point Green Point
Disability Class: Hearing Difficulty
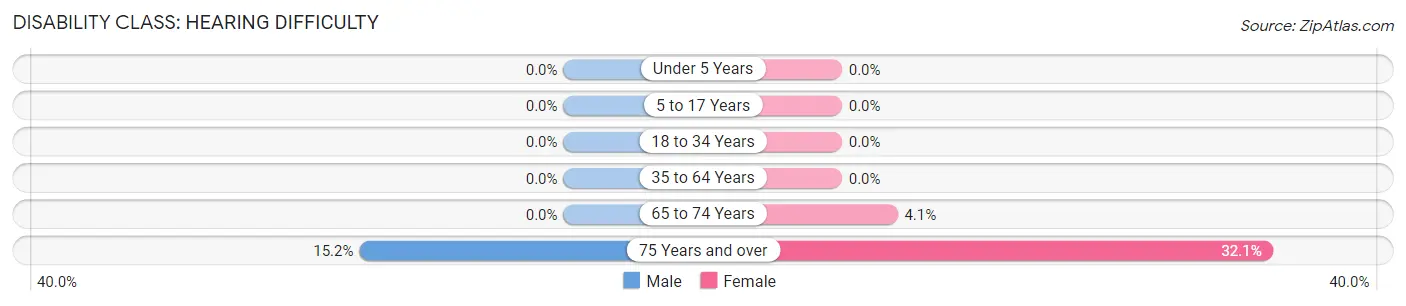
| Age Bracket | Male | Female |
| Under 5 Years | 0 (0.0%) | 0 (0.0%) |
| 5 to 17 Years | 0 (0.0%) | 0 (0.0%) |
| 18 to 34 Years | 0 (0.0%) | 0 (0.0%) |
| 35 to 64 Years | 0 (0.0%) | 0 (0.0%) |
| 65 to 74 Years | 0 (0.0%) | 9 (4.1%) |
| 75 Years and over | 10 (15.1%) | 25 (32.1%) |
Disability Class: Vision Difficulty
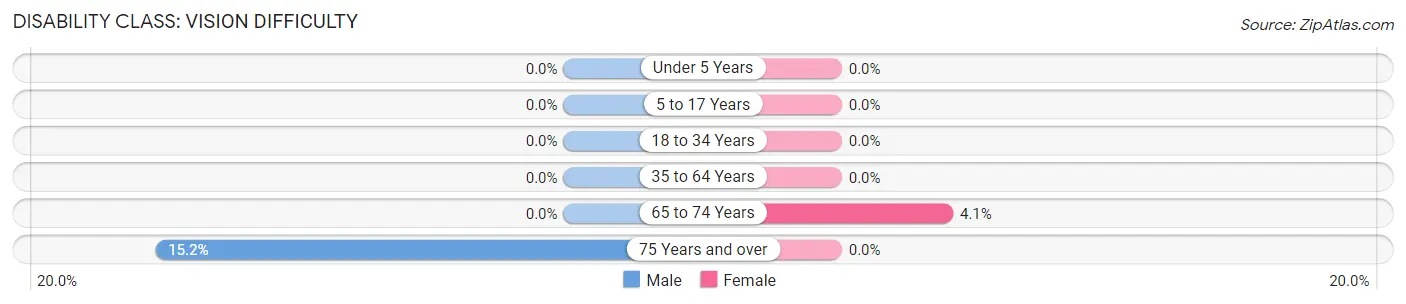
| Age Bracket | Male | Female |
| Under 5 Years | 0 (0.0%) | 0 (0.0%) |
| 5 to 17 Years | 0 (0.0%) | 0 (0.0%) |
| 18 to 34 Years | 0 (0.0%) | 0 (0.0%) |
| 35 to 64 Years | 0 (0.0%) | 0 (0.0%) |
| 65 to 74 Years | 0 (0.0%) | 9 (4.1%) |
| 75 Years and over | 10 (15.1%) | 0 (0.0%) |
Disability Class: Cognitive Difficulty
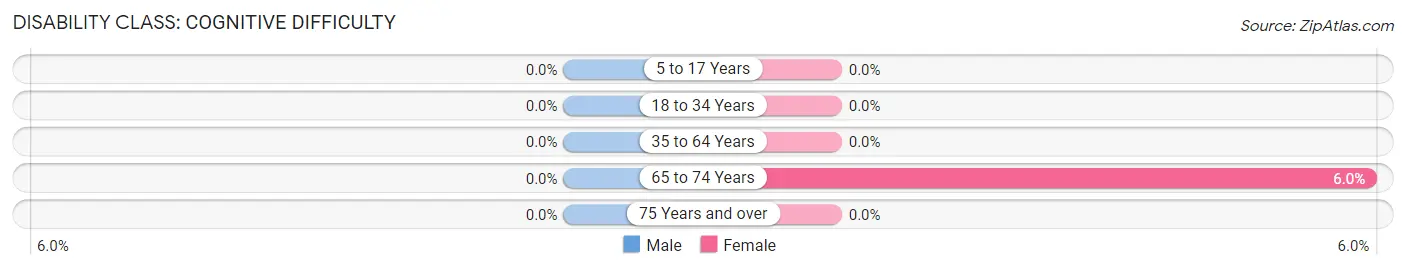
| Age Bracket | Male | Female |
| 5 to 17 Years | 0 (0.0%) | 0 (0.0%) |
| 18 to 34 Years | 0 (0.0%) | 0 (0.0%) |
| 35 to 64 Years | 0 (0.0%) | 0 (0.0%) |
| 65 to 74 Years | 0 (0.0%) | 13 (6.0%) |
| 75 Years and over | 0 (0.0%) | 0 (0.0%) |
Disability Class: Ambulatory Difficulty
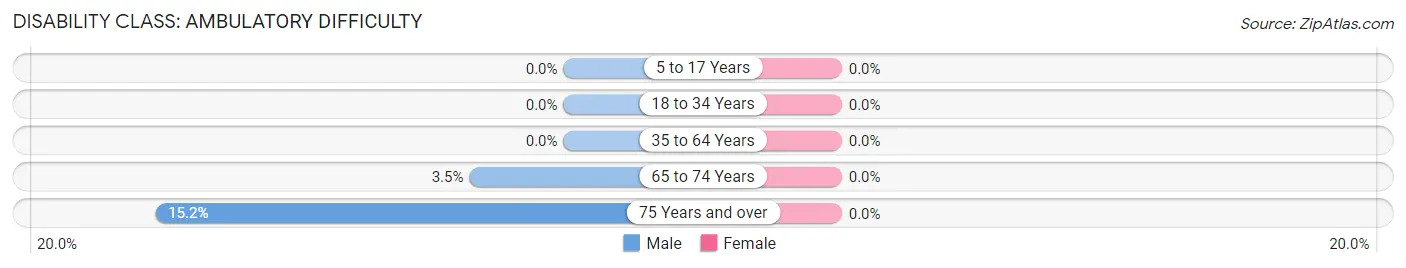
| Age Bracket | Male | Female |
| 5 to 17 Years | 0 (0.0%) | 0 (0.0%) |
| 18 to 34 Years | 0 (0.0%) | 0 (0.0%) |
| 35 to 64 Years | 0 (0.0%) | 0 (0.0%) |
| 65 to 74 Years | 8 (3.5%) | 0 (0.0%) |
| 75 Years and over | 10 (15.1%) | 0 (0.0%) |
Disability Class: Self-Care Difficulty
| Age Bracket | Male | Female |
| 5 to 17 Years | 0 (0.0%) | 0 (0.0%) |
| 18 to 34 Years | 0 (0.0%) | 0 (0.0%) |
| 35 to 64 Years | 0 (0.0%) | 0 (0.0%) |
| 65 to 74 Years | 0 (0.0%) | 0 (0.0%) |
| 75 Years and over | 0 (0.0%) | 0 (0.0%) |
Technology Access in Black Point Green Point
Computing Device Access in Black Point Green Point
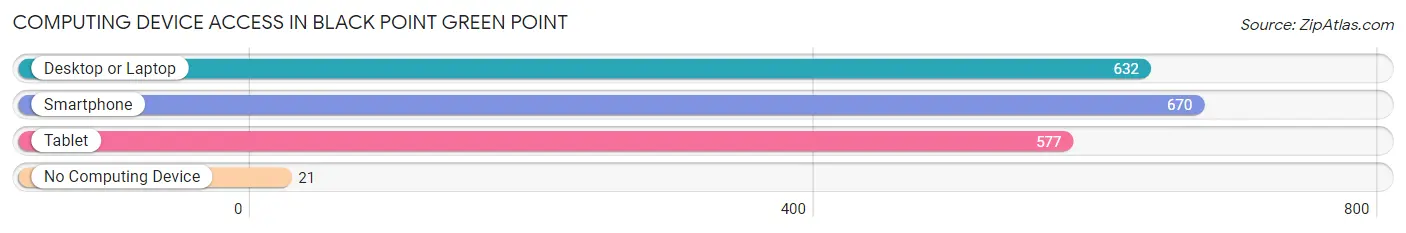
| Device Type | # Households | % Households |
| Desktop or Laptop | 632 | 90.0% |
| Smartphone | 670 | 95.4% |
| Tablet | 577 | 82.2% |
| No Computing Device | 21 | 3.0% |
| Total | 702 | 100.0% |
Internet Access in Black Point Green Point
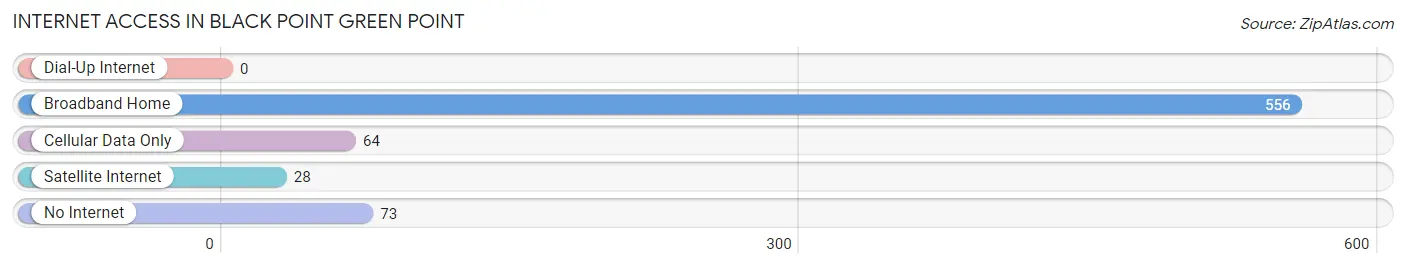
| Internet Type | # Households | % Households |
| Dial-Up Internet | 0 | 0.0% |
| Broadband Home | 556 | 79.2% |
| Cellular Data Only | 64 | 9.1% |
| Satellite Internet | 28 | 4.0% |
| No Internet | 73 | 10.4% |
| Total | 702 | 100.0% |
Black Point Green Point Summary
Black Point Green Point is a small unincorporated community located in Marin County, California. It is situated on the western shore of Tomales Bay, approximately 15 miles north of San Francisco. The community is bordered by the towns of Inverness and Point Reyes Station to the north, and the towns of Marshall and Tomales to the south. The population of Black Point Green Point was estimated to be around 200 people in 2020.
History
The area now known as Black Point Green Point has a long and varied history. The first inhabitants of the area were the Coast Miwok people, who lived in the area for thousands of years before the arrival of Europeans. The first Europeans to settle in the area were the Spanish, who established a mission in nearby San Rafael in 1817. The area was then part of the Rancho Punta de los Reyes y Bolbones land grant, which was granted to the Bolbones family in 1834.
In the late 19th century, the area was settled by a number of Italian immigrants, who established a small fishing village. The village was known as Black Point, and the area was known as Black Point Green Point. The name was derived from the black rocks that line the shore of Tomales Bay, and the green vegetation that grows in the area.
Geography
Black Point Green Point is located on the western shore of Tomales Bay, approximately 15 miles north of San Francisco. The community is bordered by the towns of Inverness and Point Reyes Station to the north, and the towns of Marshall and Tomales to the south. The area is characterized by rolling hills, with the highest point being the summit of Mount Vision, which rises to an elevation of 1,890 feet. The area is also home to a number of creeks and streams, including the Bolinas Lagoon, which is a popular destination for kayaking and fishing.
Economy
The economy of Black Point Green Point is largely based on tourism and agriculture. The area is home to a number of small farms, which produce a variety of fruits and vegetables, as well as dairy products. The area is also home to a number of small businesses, including restaurants, galleries, and shops. The area is also popular with tourists, who come to enjoy the natural beauty of the area, as well as the many outdoor activities available, such as kayaking, fishing, and hiking.
Demographics
The population of Black Point Green Point was estimated to be around 200 people in 2020. The population is largely white, with a small percentage of Hispanic and Asian residents. The median household income in the area is $75,000, and the median home value is $1.2 million. The area is served by the Marin County Sheriff's Office, and the Marin County Fire Department.
Common Questions
What is Per Capita Income in Black Point Green Point?
Per Capita income in Black Point Green Point is $92,913.
What is the Median Family Income in Black Point Green Point?
Median Family Income in Black Point Green Point is $250,001.
What is the Median Household income in Black Point Green Point?
Median Household Income in Black Point Green Point is $159,737.
What is Income or Wage Gap in Black Point Green Point?
Income or Wage Gap in Black Point Green Point is 9.7%.
Women in Black Point Green Point earn 90.3 cents for every dollar earned by a man.
What is Inequality or Gini Index in Black Point Green Point?
Inequality or Gini Index in Black Point Green Point is 0.44.
What is the Total Population of Black Point Green Point?
Total Population of Black Point Green Point is 1,684.
What is the Total Male Population of Black Point Green Point?
Total Male Population of Black Point Green Point is 840.
What is the Total Female Population of Black Point Green Point?
Total Female Population of Black Point Green Point is 844.
What is the Ratio of Males per 100 Females in Black Point Green Point?
There are 99.53 Males per 100 Females in Black Point Green Point.
What is the Ratio of Females per 100 Males in Black Point Green Point?
There are 100.48 Females per 100 Males in Black Point Green Point.
What is the Median Population Age in Black Point Green Point?
Median Population Age in Black Point Green Point is 51.7 Years.
What is the Average Family Size in Black Point Green Point
Average Family Size in Black Point Green Point is 3.1 People.
What is the Average Household Size in Black Point Green Point
Average Household Size in Black Point Green Point is 2.4 People.
How Large is the Labor Force in Black Point Green Point?
There are 823 People in the Labor Forcein in Black Point Green Point.
What is the Percentage of People in the Labor Force in Black Point Green Point?
56.3% of People are in the Labor Force in Black Point Green Point.
What is the Unemployment Rate in Black Point Green Point?
Unemployment Rate in Black Point Green Point is 4.3%.