Cities with the Highest Percentage of Families with Income Above $200,000 in Tennessee
RELATED REPORTS & OPTIONS
Family Income | $200k+
Tennessee
Compare Cities
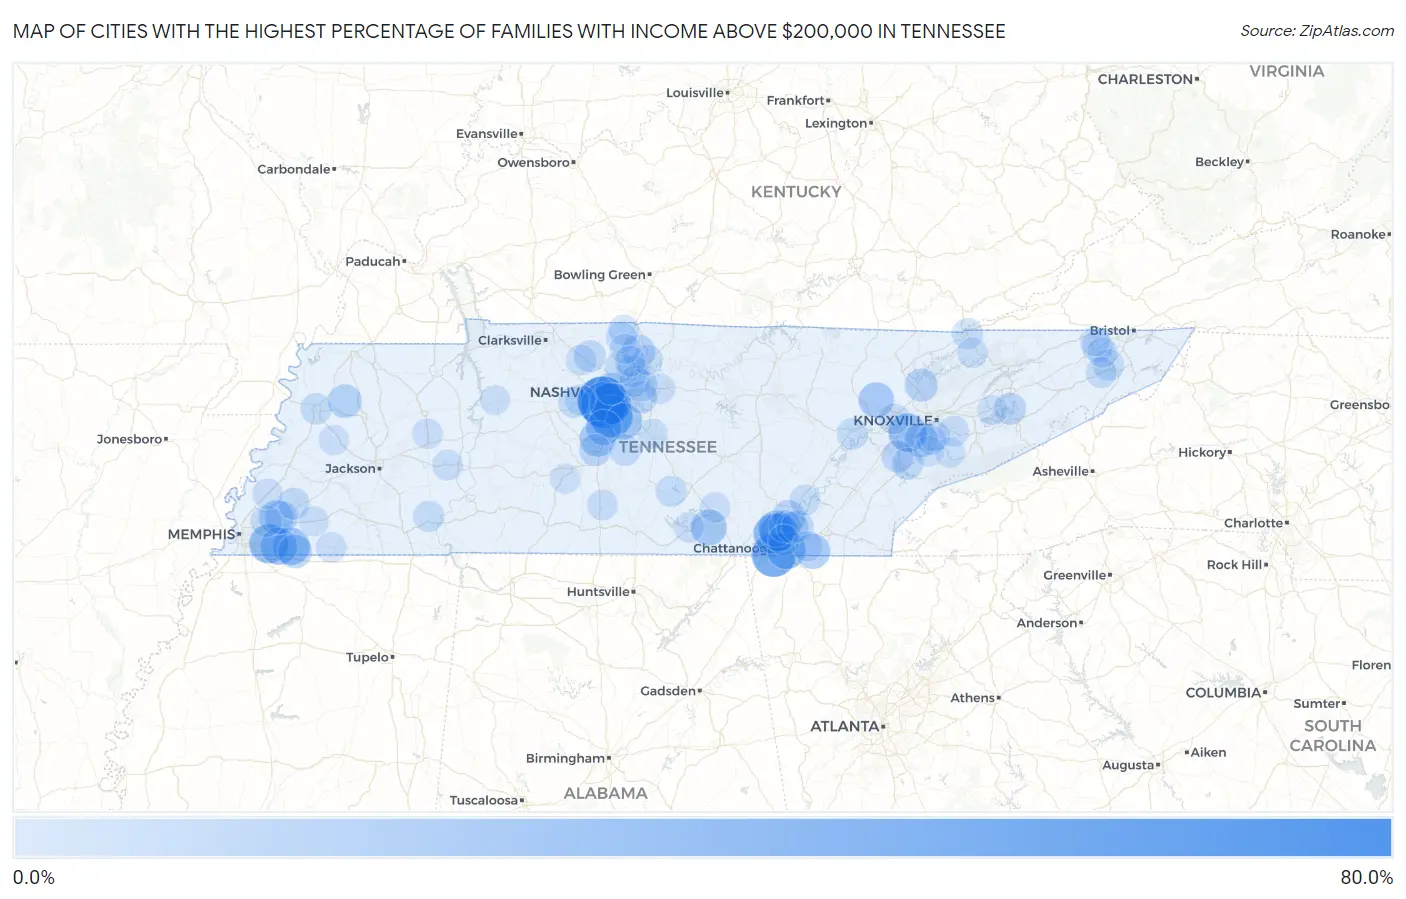
Map of Cities with the Highest Percentage of Families with Income Above $200,000 in Tennessee
0.0%
80.0%
Cities with the Highest Percentage of Families with Income Above $200,000 in Tennessee
| City | Families with Income > $200k | vs State | vs National | |
| 1. | Belle Meade | 77.1% | 9.7%(+67.4)#1 | 14.8%(+62.3)#102 |
| 2. | Dellrose | 72.2% | 9.7%(+62.5)#2 | 14.8%(+57.4)#149 |
| 3. | Forest Hills | 64.4% | 9.7%(+54.7)#3 | 14.8%(+49.6)#281 |
| 4. | Taft | 60.7% | 9.7%(+51.0)#4 | 14.8%(+45.9)#389 |
| 5. | Lookout Mountain | 55.6% | 9.7%(+45.9)#5 | 14.8%(+40.8)#557 |
| 6. | Luray | 54.4% | 9.7%(+44.7)#6 | 14.8%(+39.6)#606 |
| 7. | Brentwood | 51.6% | 9.7%(+41.9)#7 | 14.8%(+36.8)#720 |
| 8. | Oak Hill | 48.7% | 9.7%(+39.0)#8 | 14.8%(+33.9)#857 |
| 9. | Signal Mountain | 42.4% | 9.7%(+32.7)#9 | 14.8%(+27.6)#1,221 |
| 10. | Germantown | 39.1% | 9.7%(+29.4)#10 | 14.8%(+24.3)#1,491 |
| 11. | Ridgeside | 36.9% | 9.7%(+27.2)#11 | 14.8%(+22.1)#1,669 |
| 12. | Farragut | 35.7% | 9.7%(+26.0)#12 | 14.8%(+20.9)#1,769 |
| 13. | Walden | 35.7% | 9.7%(+26.0)#13 | 14.8%(+20.9)#1,772 |
| 14. | Piperton | 32.2% | 9.7%(+22.5)#14 | 14.8%(+17.4)#2,134 |
| 15. | Collierville | 31.7% | 9.7%(+22.0)#15 | 14.8%(+16.9)#2,186 |
| 16. | Nolensville | 30.2% | 9.7%(+20.5)#16 | 14.8%(+15.4)#2,340 |
| 17. | Fairmount | 29.8% | 9.7%(+20.1)#17 | 14.8%(+15.0)#2,393 |
| 18. | Thompson S Station | 27.9% | 9.7%(+18.2)#18 | 14.8%(+13.1)#2,671 |
| 19. | Sewanee | 27.8% | 9.7%(+18.1)#19 | 14.8%(+13.0)#2,690 |
| 20. | Franklin | 27.0% | 9.7%(+17.3)#20 | 14.8%(+12.2)#2,809 |
| 21. | Petros | 25.9% | 9.7%(+16.2)#21 | 14.8%(+11.1)#2,978 |
| 22. | Apison | 25.7% | 9.7%(+16.0)#22 | 14.8%(+10.9)#3,002 |
| 23. | Lakeland | 22.2% | 9.7%(+12.5)#23 | 14.8%(+7.40)#3,622 |
| 24. | Louisville | 21.9% | 9.7%(+12.2)#24 | 14.8%(+7.10)#3,700 |
| 25. | Rossville | 20.7% | 9.7%(+11.0)#25 | 14.8%(+5.90)#3,955 |
| 26. | Yorkville | 20.5% | 9.7%(+10.8)#26 | 14.8%(+5.70)#4,005 |
| 27. | Rarity Bay | 18.9% | 9.7%(+9.20)#27 | 14.8%(+4.10)#4,390 |
| 28. | Arlington | 18.7% | 9.7%(+9.00)#28 | 14.8%(+3.90)#4,435 |
| 29. | Sullivan Gardens | 18.5% | 9.7%(+8.80)#29 | 14.8%(+3.70)#4,490 |
| 30. | Cottontown | 18.4% | 9.7%(+8.70)#30 | 14.8%(+3.60)#4,527 |
| 31. | Norris | 18.1% | 9.7%(+8.40)#31 | 14.8%(+3.30)#4,605 |
| 32. | Mowbray Mountain | 17.4% | 9.7%(+7.70)#32 | 14.8%(+2.60)#4,840 |
| 33. | Huron | 16.9% | 9.7%(+7.20)#33 | 14.8%(+2.10)#4,996 |
| 34. | Falling Water | 16.5% | 9.7%(+6.80)#34 | 14.8%(+1.70)#5,113 |
| 35. | Mount Juliet | 15.1% | 9.7%(+5.40)#35 | 14.8%(+0.300)#5,583 |
| 36. | Baneberry | 14.9% | 9.7%(+5.20)#36 | 14.8%(+0.100)#5,687 |
| 37. | Middle Valley | 14.8% | 9.7%(+5.10)#37 | 14.8%(=0.000)#5,708 |
| 38. | Nashville | 14.6% | 9.7%(+4.90)#38 | 14.8%(-0.200)#5,767 |
| 39. | Tellico Village | 14.5% | 9.7%(+4.80)#39 | 14.8%(-0.300)#5,820 |
| 40. | Spring Hill | 14.4% | 9.7%(+4.70)#40 | 14.8%(-0.400)#5,855 |
| 41. | Rural Hill | 14.4% | 9.7%(+4.70)#41 | 14.8%(-0.400)#5,875 |
| 42. | Lakesite | 14.2% | 9.7%(+4.50)#42 | 14.8%(-0.600)#5,974 |
| 43. | Braden | 14.1% | 9.7%(+4.40)#43 | 14.8%(-0.700)#6,020 |
| 44. | Hendersonville | 14.0% | 9.7%(+4.30)#44 | 14.8%(-0.800)#6,024 |
| 45. | Coopertown | 14.0% | 9.7%(+4.30)#45 | 14.8%(-0.800)#6,045 |
| 46. | Norene | 14.0% | 9.7%(+4.30)#46 | 14.8%(-0.800)#6,065 |
| 47. | Greenback | 13.9% | 9.7%(+4.20)#47 | 14.8%(-0.900)#6,100 |
| 48. | Eagleville | 12.5% | 9.7%(+2.80)#48 | 14.8%(-2.30)#6,756 |
| 49. | Bartlett | 12.2% | 9.7%(+2.50)#49 | 14.8%(-2.60)#6,882 |
| 50. | Dyersburg | 12.2% | 9.7%(+2.50)#50 | 14.8%(-2.60)#6,894 |
| 51. | Colonial Heights | 12.1% | 9.7%(+2.40)#51 | 14.8%(-2.70)#6,965 |
| 52. | Johnson City | 11.9% | 9.7%(+2.20)#52 | 14.8%(-2.90)#7,044 |
| 53. | Kingston Springs | 11.8% | 9.7%(+2.10)#53 | 14.8%(-3.00)#7,113 |
| 54. | Walnut Grove Cdp Sumner County | 11.8% | 9.7%(+2.10)#54 | 14.8%(-3.00)#7,128 |
| 55. | Rockwood | 11.7% | 9.7%(+2.00)#55 | 14.8%(-3.10)#7,164 |
| 56. | Green Hill | 11.6% | 9.7%(+1.90)#56 | 14.8%(-3.20)#7,209 |
| 57. | Normandy | 11.5% | 9.7%(+1.80)#57 | 14.8%(-3.30)#7,327 |
| 58. | Goodlettsville | 11.4% | 9.7%(+1.70)#58 | 14.8%(-3.40)#7,342 |
| 59. | Harrogate | 11.3% | 9.7%(+1.60)#59 | 14.8%(-3.50)#7,422 |
| 60. | Adamsville | 11.3% | 9.7%(+1.60)#60 | 14.8%(-3.50)#7,430 |
| 61. | Jonesborough | 11.1% | 9.7%(+1.40)#61 | 14.8%(-3.70)#7,537 |
| 62. | Cross Plains | 11.1% | 9.7%(+1.40)#62 | 14.8%(-3.70)#7,559 |
| 63. | Mcdonald | 11.1% | 9.7%(+1.40)#63 | 14.8%(-3.70)#7,573 |
| 64. | Chattanooga | 11.0% | 9.7%(+1.30)#64 | 14.8%(-3.80)#7,603 |
| 65. | Gladeville | 10.9% | 9.7%(+1.20)#65 | 14.8%(-3.90)#7,691 |
| 66. | Pegram | 10.8% | 9.7%(+1.10)#66 | 14.8%(-4.00)#7,748 |
| 67. | Gallatin | 10.7% | 9.7%(+1.00)#67 | 14.8%(-4.10)#7,772 |
| 68. | Shackle Island | 10.6% | 9.7%(+0.900)#68 | 14.8%(-4.20)#7,847 |
| 69. | Sale Creek | 10.4% | 9.7%(+0.700)#69 | 14.8%(-4.40)#7,975 |
| 70. | Darden | 10.4% | 9.7%(+0.700)#70 | 14.8%(-4.40)#8,007 |
| 71. | Pinson | 10.3% | 9.7%(+0.600)#71 | 14.8%(-4.50)#8,069 |
| 72. | Oak Ridge | 10.2% | 9.7%(+0.500)#72 | 14.8%(-4.60)#8,092 |
| 73. | Seymour | 10.1% | 9.7%(+0.400)#73 | 14.8%(-4.70)#8,158 |
| 74. | Cornersville | 10.1% | 9.7%(+0.400)#74 | 14.8%(-4.70)#8,190 |
| 75. | Orlinda | 10.0% | 9.7%(+0.300)#75 | 14.8%(-4.80)#8,278 |
| 76. | Maryville | 9.8% | 9.7%(+0.100)#76 | 14.8%(-5.00)#8,392 |
| 77. | Pleasant View | 9.8% | 9.7%(+0.100)#77 | 14.8%(-5.00)#8,414 |
| 78. | Kahite | 9.8% | 9.7%(+0.100)#78 | 14.8%(-5.00)#8,452 |
| 79. | New Tazewell | 9.7% | 9.7%(=0.000)#79 | 14.8%(-5.10)#8,507 |
| 80. | Rockford | 9.6% | 9.7%(-0.100)#80 | 14.8%(-5.20)#8,584 |
| 81. | Pelham | 9.6% | 9.7%(-0.100)#81 | 14.8%(-5.20)#8,592 |
| 82. | Collegedale | 9.5% | 9.7%(-0.200)#82 | 14.8%(-5.30)#8,612 |
| 83. | La Grange | 9.5% | 9.7%(-0.200)#83 | 14.8%(-5.30)#8,661 |
| 84. | Clarksburg | 9.4% | 9.7%(-0.300)#84 | 14.8%(-5.40)#8,715 |
| 85. | Atoka | 9.3% | 9.7%(-0.400)#85 | 14.8%(-5.50)#8,760 |
| 86. | Maury City | 9.3% | 9.7%(-0.400)#86 | 14.8%(-5.50)#8,800 |
| 87. | White House | 9.2% | 9.7%(-0.500)#87 | 14.8%(-5.60)#8,842 |
| 88. | Lebanon | 9.1% | 9.7%(-0.600)#88 | 14.8%(-5.70)#8,896 |
| 89. | Hickman | 8.9% | 9.7%(-0.800)#89 | 14.8%(-5.90)#9,113 |
| 90. | Murfreesboro | 8.8% | 9.7%(-0.900)#90 | 14.8%(-6.00)#9,123 |
| 91. | Winchester | 8.8% | 9.7%(-0.900)#91 | 14.8%(-6.00)#9,145 |
| 92. | Somerville | 8.8% | 9.7%(-0.900)#92 | 14.8%(-6.00)#9,155 |
| 93. | Spurgeon | 8.6% | 9.7%(-1.10)#93 | 14.8%(-6.20)#9,343 |
| 94. | Lynchburg | 8.5% | 9.7%(-1.20)#94 | 14.8%(-6.30)#9,438 |
| 95. | Mount Pleasant | 8.5% | 9.7%(-1.20)#95 | 14.8%(-6.30)#9,445 |
| 96. | Walland | 8.5% | 9.7%(-1.20)#96 | 14.8%(-6.30)#9,487 |
| 97. | Alcoa | 8.4% | 9.7%(-1.30)#97 | 14.8%(-6.40)#9,517 |
| 98. | Waverly | 8.2% | 9.7%(-1.50)#98 | 14.8%(-6.60)#9,706 |
| 99. | Dandridge | 8.2% | 9.7%(-1.50)#99 | 14.8%(-6.60)#9,713 |
| 100. | Kingsport | 8.0% | 9.7%(-1.70)#100 | 14.8%(-6.80)#9,873 |
Common Questions
What are the Top 10 Cities with the Highest Percentage of Families with Income Above $200,000 in Tennessee?
Top 10 Cities with the Highest Percentage of Families with Income Above $200,000 in Tennessee are:
#1
77.1%
#2
64.4%
#3
55.6%
#4
51.6%
#5
48.7%
#6
42.4%
#7
39.1%
#8
36.9%
#9
35.7%
#10
35.7%
What city has the Highest Percentage of Families with Income Above $200,000 in Tennessee?
Belle Meade has the Highest Percentage of Families with Income Above $200,000 in Tennessee with 77.1%.
What is the Percentage of Families with Income Above $200,000 in the State of Tennessee?
Percentage of Families with Income Above $200,000 in Tennessee is 9.7%.
What is the Percentage of Families with Income Above $200,000 in the United States?
Percentage of Families with Income Above $200,000 in the United States is 14.8%.