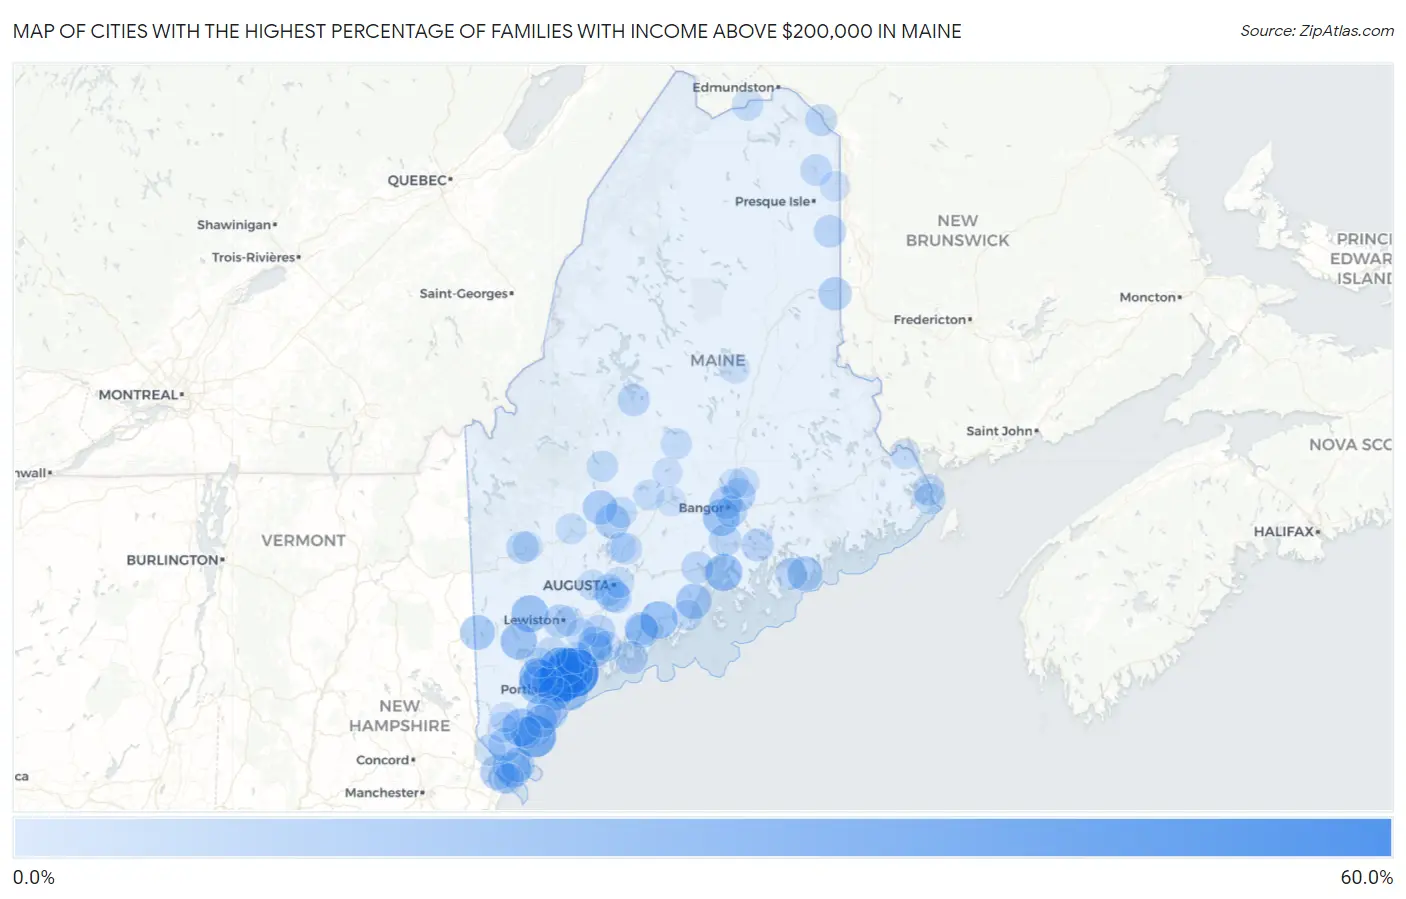
Cities with the Highest Percentage of Families with Income Above $200,000 in Maine
RELATED REPORTS & OPTIONS
Family Income | $200k+
Maine
Compare Cities
Map of Cities with the Highest Percentage of Families with Income Above $200,000 in Maine
0.0%
60.0%
Cities with the Highest Percentage of Families with Income Above $200,000 in Maine
| City | Families with Income > $200k | vs State | vs National | |
| 1. | Littlejohn Island | 57.1% | 10.4%(+46.7)#1 | 14.8%(+42.3)#505 |
| 2. | Falmouth Foreside | 49.8% | 10.4%(+39.4)#2 | 14.8%(+35.0)#805 |
| 3. | Falmouth | 43.6% | 10.4%(+33.2)#3 | 14.8%(+28.8)#1,133 |
| 4. | Kennebunkport | 36.1% | 10.4%(+25.7)#4 | 14.8%(+21.3)#1,740 |
| 5. | Cousins Island | 34.4% | 10.4%(+24.0)#5 | 14.8%(+19.6)#1,908 |
| 6. | Greene | 33.5% | 10.4%(+23.1)#6 | 14.8%(+18.7)#1,989 |
| 7. | Cumberland Center | 30.4% | 10.4%(+20.0)#7 | 14.8%(+15.6)#2,322 |
| 8. | Little Falls | 27.8% | 10.4%(+17.4)#8 | 14.8%(+13.0)#2,696 |
| 9. | West Kennebunk | 23.9% | 10.4%(+13.5)#9 | 14.8%(+9.10)#3,305 |
| 10. | Waldoboro | 23.0% | 10.4%(+12.6)#10 | 14.8%(+8.20)#3,464 |
| 11. | Gorham | 22.7% | 10.4%(+12.3)#11 | 14.8%(+7.90)#3,518 |
| 12. | Castine | 22.3% | 10.4%(+11.9)#12 | 14.8%(+7.50)#3,616 |
| 13. | Yarmouth | 22.1% | 10.4%(+11.7)#13 | 14.8%(+7.30)#3,656 |
| 14. | Oxford | 21.5% | 10.4%(+11.1)#14 | 14.8%(+6.70)#3,782 |
| 15. | Hampden | 21.1% | 10.4%(+10.7)#15 | 14.8%(+6.30)#3,869 |
| 16. | Naples | 20.5% | 10.4%(+10.1)#16 | 14.8%(+5.70)#4,001 |
| 17. | Portland | 18.9% | 10.4%(+8.50)#17 | 14.8%(+4.10)#4,373 |
| 18. | Oak Hill | 18.0% | 10.4%(+7.60)#18 | 14.8%(+3.20)#4,635 |
| 19. | Camden | 17.4% | 10.4%(+7.00)#19 | 14.8%(+2.60)#4,831 |
| 20. | York Harbor | 16.2% | 10.4%(+5.80)#20 | 14.8%(+1.40)#5,205 |
| 21. | Fryeburg | 16.0% | 10.4%(+5.60)#21 | 14.8%(+1.20)#5,277 |
| 22. | Saco | 15.9% | 10.4%(+5.50)#22 | 14.8%(+1.10)#5,298 |
| 23. | South Eliot | 15.8% | 10.4%(+5.40)#23 | 14.8%(+1.000)#5,351 |
| 24. | Winter Harbor | 15.8% | 10.4%(+5.40)#24 | 14.8%(+1.000)#5,368 |
| 25. | Northeast Harbor | 15.6% | 10.4%(+5.20)#25 | 14.8%(+0.800)#5,432 |
| 26. | Norridgewock | 15.0% | 10.4%(+4.60)#26 | 14.8%(+0.200)#5,648 |
| 27. | Anson | 14.8% | 10.4%(+4.40)#27 | 14.8%(=0.000)#5,724 |
| 28. | Topsham | 14.6% | 10.4%(+4.20)#28 | 14.8%(-0.200)#5,784 |
| 29. | Brunswick | 14.4% | 10.4%(+4.00)#29 | 14.8%(-0.400)#5,860 |
| 30. | Cape Neddick | 14.4% | 10.4%(+4.00)#30 | 14.8%(-0.400)#5,874 |
| 31. | South Portland | 13.6% | 10.4%(+3.20)#31 | 14.8%(-1.20)#6,227 |
| 32. | Farmingdale | 12.8% | 10.4%(+2.40)#32 | 14.8%(-2.00)#6,619 |
| 33. | North Berwick | 12.8% | 10.4%(+2.40)#33 | 14.8%(-2.00)#6,622 |
| 34. | Damariscotta | 12.5% | 10.4%(+2.10)#34 | 14.8%(-2.30)#6,753 |
| 35. | Auburn | 12.2% | 10.4%(+1.80)#35 | 14.8%(-2.60)#6,891 |
| 36. | Veazie | 12.2% | 10.4%(+1.80)#36 | 14.8%(-2.60)#6,908 |
| 37. | Orono | 12.1% | 10.4%(+1.70)#37 | 14.8%(-2.70)#6,950 |
| 38. | South Windham | 11.8% | 10.4%(+1.40)#38 | 14.8%(-3.00)#7,124 |
| 39. | Newcastle | 11.5% | 10.4%(+1.10)#39 | 14.8%(-3.30)#7,304 |
| 40. | Houlton | 11.4% | 10.4%(+1.000)#40 | 14.8%(-3.40)#7,364 |
| 41. | Bangor | 11.3% | 10.4%(+0.900)#41 | 14.8%(-3.50)#7,404 |
| 42. | Boothbay Harbor | 11.2% | 10.4%(+0.800)#42 | 14.8%(-3.60)#7,501 |
| 43. | South Berwick | 10.8% | 10.4%(+0.400)#43 | 14.8%(-4.00)#7,736 |
| 44. | Old Orchard Beach | 10.3% | 10.4%(-0.100)#44 | 14.8%(-4.50)#8,026 |
| 45. | Ellsworth | 10.3% | 10.4%(-0.100)#45 | 14.8%(-4.50)#8,027 |
| 46. | Biddeford | 10.1% | 10.4%(-0.300)#46 | 14.8%(-4.70)#8,152 |
| 47. | Bowdoinham | 10.1% | 10.4%(-0.300)#47 | 14.8%(-4.70)#8,207 |
| 48. | Blaine | 9.5% | 10.4%(-0.900)#48 | 14.8%(-5.30)#8,650 |
| 49. | Rumford | 9.4% | 10.4%(-1.00)#49 | 14.8%(-5.40)#8,692 |
| 50. | Dunstan | 9.4% | 10.4%(-1.00)#50 | 14.8%(-5.40)#8,706 |
| 51. | Greenville | 9.3% | 10.4%(-1.10)#51 | 14.8%(-5.50)#8,799 |
| 52. | Bucksport | 9.1% | 10.4%(-1.30)#52 | 14.8%(-5.70)#8,925 |
| 53. | Kennebunk | 8.8% | 10.4%(-1.60)#53 | 14.8%(-6.00)#9,152 |
| 54. | Belfast | 8.6% | 10.4%(-1.80)#54 | 14.8%(-6.20)#9,333 |
| 55. | Kittery | 8.3% | 10.4%(-2.10)#55 | 14.8%(-6.50)#9,593 |
| 56. | Bar Harbor | 8.2% | 10.4%(-2.20)#56 | 14.8%(-6.60)#9,725 |
| 57. | Van Buren | 8.2% | 10.4%(-2.20)#57 | 14.8%(-6.60)#9,733 |
| 58. | Hallowell | 8.1% | 10.4%(-2.30)#58 | 14.8%(-6.70)#9,814 |
| 59. | Brewer | 7.9% | 10.4%(-2.50)#59 | 14.8%(-6.90)#9,986 |
| 60. | Turner | 7.9% | 10.4%(-2.50)#60 | 14.8%(-6.90)#10,049 |
| 61. | Waterville | 7.6% | 10.4%(-2.80)#61 | 14.8%(-7.20)#10,267 |
| 62. | Berwick | 7.3% | 10.4%(-3.10)#62 | 14.8%(-7.50)#10,622 |
| 63. | Westbrook | 7.2% | 10.4%(-3.20)#63 | 14.8%(-7.60)#10,678 |
| 64. | Caribou | 7.2% | 10.4%(-3.20)#64 | 14.8%(-7.60)#10,695 |
| 65. | Eastport | 6.9% | 10.4%(-3.50)#65 | 14.8%(-7.90)#11,063 |
| 66. | Lubec | 6.7% | 10.4%(-3.70)#66 | 14.8%(-8.10)#11,329 |
| 67. | Kingfield | 6.5% | 10.4%(-3.90)#67 | 14.8%(-8.30)#11,553 |
| 68. | Randolph | 6.4% | 10.4%(-4.00)#68 | 14.8%(-8.40)#11,650 |
| 69. | Fort Kent | 6.2% | 10.4%(-4.20)#69 | 14.8%(-8.60)#11,896 |
| 70. | Skowhegan | 6.1% | 10.4%(-4.30)#70 | 14.8%(-8.70)#11,969 |
| 71. | Lisbon | 6.1% | 10.4%(-4.30)#71 | 14.8%(-8.70)#11,985 |
| 72. | Bingham | 6.0% | 10.4%(-4.40)#72 | 14.8%(-8.80)#12,160 |
| 73. | Freeport | 5.9% | 10.4%(-4.50)#73 | 14.8%(-8.90)#12,274 |
| 74. | Gray | 5.9% | 10.4%(-4.50)#74 | 14.8%(-8.90)#12,306 |
| 75. | Farmington | 5.7% | 10.4%(-4.70)#75 | 14.8%(-9.10)#12,511 |
| 76. | Augusta | 5.5% | 10.4%(-4.90)#76 | 14.8%(-9.30)#12,756 |
| 77. | Dover Foxcroft | 5.4% | 10.4%(-5.00)#77 | 14.8%(-9.40)#12,900 |
| 78. | Rockland | 5.3% | 10.4%(-5.10)#78 | 14.8%(-9.50)#13,006 |
| 79. | Hartland | 5.2% | 10.4%(-5.20)#79 | 14.8%(-9.60)#13,237 |
| 80. | Winthrop | 5.1% | 10.4%(-5.30)#80 | 14.8%(-9.70)#13,314 |
| 81. | Bath | 5.0% | 10.4%(-5.40)#81 | 14.8%(-9.80)#13,417 |
| 82. | Calais | 4.9% | 10.4%(-5.50)#82 | 14.8%(-9.90)#13,600 |
| 83. | Lisbon Falls | 4.8% | 10.4%(-5.60)#83 | 14.8%(-10.0)#13,746 |
| 84. | Milford | 4.8% | 10.4%(-5.60)#84 | 14.8%(-10.0)#13,764 |
| 85. | Kittery Point | 4.3% | 10.4%(-6.10)#85 | 14.8%(-10.5)#14,567 |
| 86. | Sanford | 4.1% | 10.4%(-6.30)#86 | 14.8%(-10.7)#14,806 |
| 87. | North Windham | 3.9% | 10.4%(-6.50)#87 | 14.8%(-10.9)#15,162 |
| 88. | Cornish | 3.8% | 10.4%(-6.60)#88 | 14.8%(-11.0)#15,402 |
| 89. | Fort Fairfield | 3.7% | 10.4%(-6.70)#89 | 14.8%(-11.1)#15,569 |
| 90. | Mexico | 3.6% | 10.4%(-6.80)#90 | 14.8%(-11.2)#15,714 |
| 91. | Oakland | 3.5% | 10.4%(-6.90)#91 | 14.8%(-11.3)#15,890 |
| 92. | Lewiston | 3.4% | 10.4%(-7.00)#92 | 14.8%(-11.4)#15,994 |
| 93. | Old Town | 3.4% | 10.4%(-7.00)#93 | 14.8%(-11.4)#16,016 |
| 94. | Alfred | 3.4% | 10.4%(-7.00)#94 | 14.8%(-11.4)#16,105 |
| 95. | Bethel | 3.4% | 10.4%(-7.00)#95 | 14.8%(-11.4)#16,133 |
| 96. | Dexter | 3.3% | 10.4%(-7.10)#96 | 14.8%(-11.5)#16,271 |
| 97. | Rangeley | 3.2% | 10.4%(-7.20)#97 | 14.8%(-11.6)#16,490 |
| 98. | Millinocket | 3.0% | 10.4%(-7.40)#98 | 14.8%(-11.8)#16,730 |
| 99. | Newport | 3.0% | 10.4%(-7.40)#99 | 14.8%(-11.8)#16,768 |
| 100. | Jonesport | 2.8% | 10.4%(-7.60)#100 | 14.8%(-12.0)#17,184 |
1
2Common Questions
What are the Top 10 Cities with the Highest Percentage of Families with Income Above $200,000 in Maine?
Top 10 Cities with the Highest Percentage of Families with Income Above $200,000 in Maine are:
#1
57.1%
#2
49.8%
#3
43.6%
#4
36.1%
#5
34.4%
#6
30.4%
#7
27.8%
#8
23.9%
#9
23.0%
#10
22.7%
What city has the Highest Percentage of Families with Income Above $200,000 in Maine?
Littlejohn Island has the Highest Percentage of Families with Income Above $200,000 in Maine with 57.1%.
What is the Percentage of Families with Income Above $200,000 in the State of Maine?
Percentage of Families with Income Above $200,000 in Maine is 10.4%.
What is the Percentage of Families with Income Above $200,000 in the United States?
Percentage of Families with Income Above $200,000 in the United States is 14.8%.