Cities with the Highest Percentage of Families with Income Above $200,000 in Utah
RELATED REPORTS & OPTIONS
Family Income | $200k+
Utah
Compare Cities
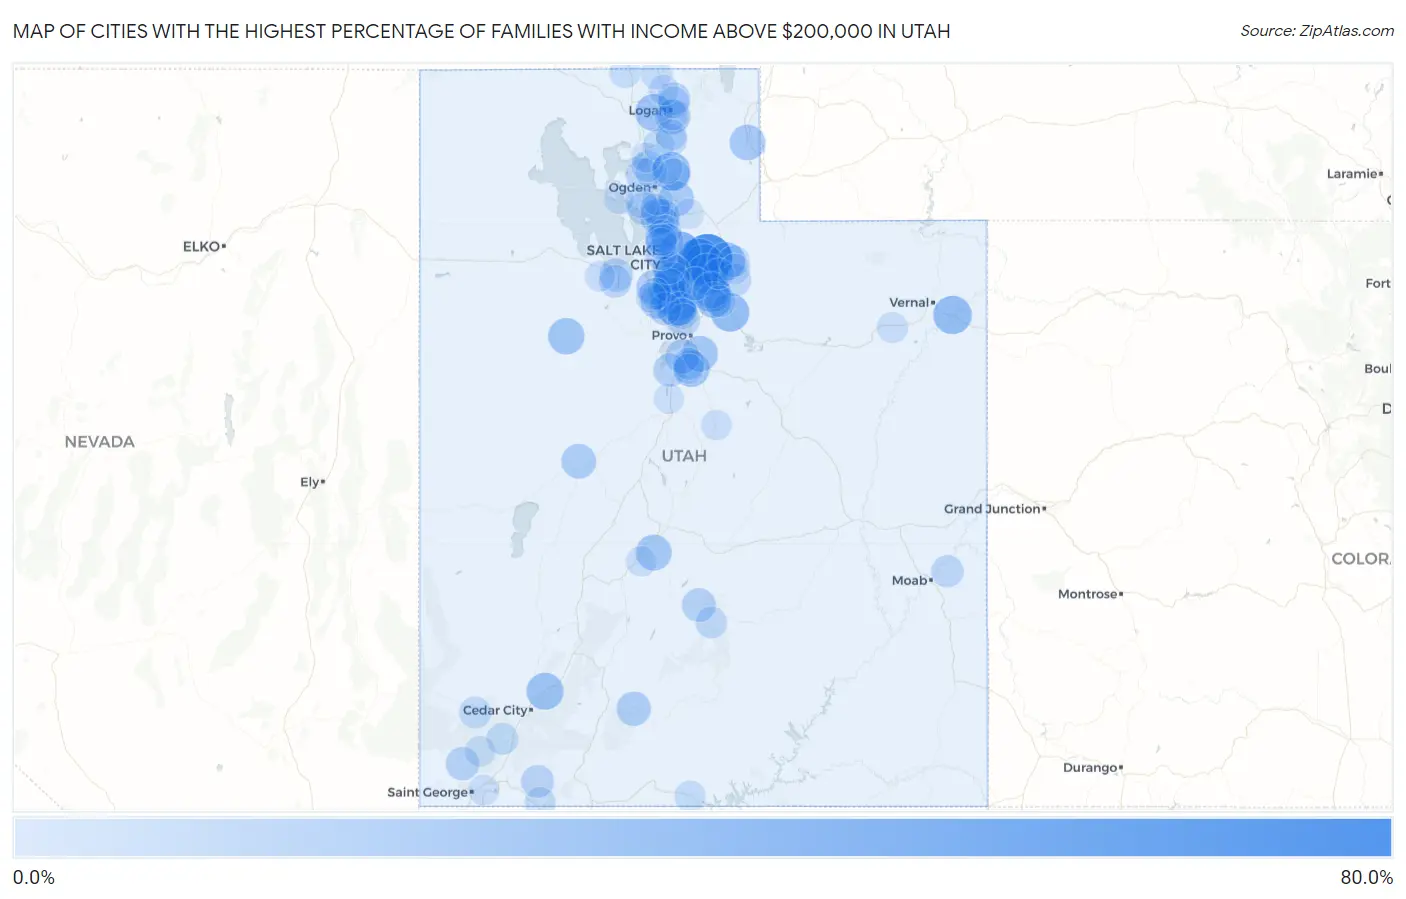
Map of Cities with the Highest Percentage of Families with Income Above $200,000 in Utah
0.0%
80.0%
Cities with the Highest Percentage of Families with Income Above $200,000 in Utah
| City | Families with Income > $200k | vs State | vs National | |
| 1. | Silver Summit | 64.9% | 13.1%(+51.8)#1 | 14.8%(+50.1)#266 |
| 2. | Hobble Creek | 64.7% | 13.1%(+51.6)#2 | 14.8%(+49.9)#271 |
| 3. | Sundance | 50.0% | 13.1%(+36.9)#3 | 14.8%(+35.2)#797 |
| 4. | Summit Park | 46.5% | 13.1%(+33.4)#4 | 14.8%(+31.7)#967 |
| 5. | Snyderville | 43.7% | 13.1%(+30.6)#5 | 14.8%(+28.9)#1,122 |
| 6. | Emigration Canyon | 43.5% | 13.1%(+30.4)#6 | 14.8%(+28.7)#1,143 |
| 7. | Park City | 41.0% | 13.1%(+27.9)#7 | 14.8%(+26.2)#1,323 |
| 8. | Highland | 38.9% | 13.1%(+25.8)#8 | 14.8%(+24.1)#1,506 |
| 9. | Alpine | 37.8% | 13.1%(+24.7)#9 | 14.8%(+23.0)#1,591 |
| 10. | East Basin | 36.9% | 13.1%(+23.8)#10 | 14.8%(+22.1)#1,665 |
| 11. | Midway | 35.0% | 13.1%(+21.9)#11 | 14.8%(+20.2)#1,841 |
| 12. | Jensen | 34.5% | 13.1%(+21.4)#12 | 14.8%(+19.7)#1,894 |
| 13. | Independence | 34.5% | 13.1%(+21.4)#13 | 14.8%(+19.7)#1,896 |
| 14. | Wolf Creek | 33.9% | 13.1%(+20.8)#14 | 14.8%(+19.1)#1,947 |
| 15. | Granite | 33.3% | 13.1%(+20.2)#15 | 14.8%(+18.5)#1,999 |
| 16. | Peoa | 33.3% | 13.1%(+20.2)#16 | 14.8%(+18.5)#2,011 |
| 17. | Draper | 32.7% | 13.1%(+19.6)#17 | 14.8%(+17.9)#2,061 |
| 18. | Summit | 30.5% | 13.1%(+17.4)#18 | 14.8%(+15.7)#2,315 |
| 19. | Mendon | 30.3% | 13.1%(+17.2)#19 | 14.8%(+15.5)#2,334 |
| 20. | Holladay | 29.4% | 13.1%(+16.3)#20 | 14.8%(+14.6)#2,439 |
| 21. | Interlaken | 29.4% | 13.1%(+16.3)#21 | 14.8%(+14.6)#2,459 |
| 22. | Woodland Hills | 28.8% | 13.1%(+15.7)#22 | 14.8%(+14.0)#2,533 |
| 23. | Dugway | 28.8% | 13.1%(+15.7)#23 | 14.8%(+14.0)#2,536 |
| 24. | Mapleton | 27.7% | 13.1%(+14.6)#24 | 14.8%(+12.9)#2,708 |
| 25. | Glenwood | 27.6% | 13.1%(+14.5)#25 | 14.8%(+12.8)#2,724 |
| 26. | Charleston | 27.4% | 13.1%(+14.3)#26 | 14.8%(+12.6)#2,760 |
| 27. | Cottonwood Heights | 27.1% | 13.1%(+14.0)#27 | 14.8%(+12.3)#2,793 |
| 28. | Millville | 26.8% | 13.1%(+13.7)#28 | 14.8%(+12.0)#2,841 |
| 29. | Woodruff | 26.8% | 13.1%(+13.7)#29 | 14.8%(+12.0)#2,848 |
| 30. | Kaysville | 26.2% | 13.1%(+13.1)#30 | 14.8%(+11.4)#2,911 |
| 31. | Mountain Green | 26.0% | 13.1%(+12.9)#31 | 14.8%(+11.2)#2,948 |
| 32. | Bluffdale | 25.3% | 13.1%(+12.2)#32 | 14.8%(+10.5)#3,054 |
| 33. | South Jordan | 25.1% | 13.1%(+12.0)#33 | 14.8%(+10.3)#3,084 |
| 34. | Sutherland | 24.5% | 13.1%(+11.4)#34 | 14.8%(+9.70)#3,212 |
| 35. | Fruit Heights | 23.9% | 13.1%(+10.8)#35 | 14.8%(+9.10)#3,299 |
| 36. | Bryce Canyon City | 23.5% | 13.1%(+10.4)#36 | 14.8%(+8.70)#3,382 |
| 37. | Benjamin | 22.8% | 13.1%(+9.70)#37 | 14.8%(+8.00)#3,505 |
| 38. | Sandy | 21.8% | 13.1%(+8.70)#38 | 14.8%(+7.00)#3,714 |
| 39. | Cedar Hills | 21.7% | 13.1%(+8.60)#39 | 14.8%(+6.90)#3,737 |
| 40. | Lyman | 21.4% | 13.1%(+8.30)#40 | 14.8%(+6.60)#3,804 |
| 41. | Alta | 21.2% | 13.1%(+8.10)#41 | 14.8%(+6.40)#3,850 |
| 42. | Dammeron Valley | 21.0% | 13.1%(+7.90)#42 | 14.8%(+6.20)#3,894 |
| 43. | Genola | 20.9% | 13.1%(+7.80)#43 | 14.8%(+6.10)#3,910 |
| 44. | Stansbury Park | 20.5% | 13.1%(+7.40)#44 | 14.8%(+5.70)#3,984 |
| 45. | Plain City | 20.5% | 13.1%(+7.40)#45 | 14.8%(+5.70)#3,987 |
| 46. | Millcreek | 20.1% | 13.1%(+7.00)#46 | 14.8%(+5.30)#4,086 |
| 47. | Farmington | 20.0% | 13.1%(+6.90)#47 | 14.8%(+5.20)#4,107 |
| 48. | Springdale | 19.6% | 13.1%(+6.50)#48 | 14.8%(+4.80)#4,216 |
| 49. | West Bountiful | 19.5% | 13.1%(+6.40)#49 | 14.8%(+4.70)#4,230 |
| 50. | Lindon | 19.4% | 13.1%(+6.30)#50 | 14.8%(+4.60)#4,251 |
| 51. | Lehi | 19.2% | 13.1%(+6.10)#51 | 14.8%(+4.40)#4,292 |
| 52. | Centerville | 19.1% | 13.1%(+6.00)#52 | 14.8%(+4.30)#4,321 |
| 53. | Hyde Park | 19.1% | 13.1%(+6.00)#53 | 14.8%(+4.30)#4,325 |
| 54. | Eden | 19.1% | 13.1%(+6.00)#54 | 14.8%(+4.30)#4,338 |
| 55. | Erda | 19.0% | 13.1%(+5.90)#55 | 14.8%(+4.20)#4,360 |
| 56. | Syracuse | 18.9% | 13.1%(+5.80)#56 | 14.8%(+4.10)#4,375 |
| 57. | Francis | 18.9% | 13.1%(+5.80)#57 | 14.8%(+4.10)#4,388 |
| 58. | Salt Lake City | 18.6% | 13.1%(+5.50)#58 | 14.8%(+3.80)#4,455 |
| 59. | Castle Valley | 18.3% | 13.1%(+5.20)#59 | 14.8%(+3.50)#4,549 |
| 60. | Bountiful | 18.2% | 13.1%(+5.10)#60 | 14.8%(+3.40)#4,554 |
| 61. | Riverton | 17.5% | 13.1%(+4.40)#61 | 14.8%(+2.70)#4,780 |
| 62. | Salem | 17.0% | 13.1%(+3.90)#62 | 14.8%(+2.20)#4,946 |
| 63. | Newcastle | 16.9% | 13.1%(+3.80)#63 | 14.8%(+2.10)#4,994 |
| 64. | North Salt Lake | 16.8% | 13.1%(+3.70)#64 | 14.8%(+2.00)#5,002 |
| 65. | Pleasant View | 16.8% | 13.1%(+3.70)#65 | 14.8%(+2.00)#5,007 |
| 66. | New Harmony | 16.8% | 13.1%(+3.70)#66 | 14.8%(+2.00)#5,020 |
| 67. | Teasdale | 16.7% | 13.1%(+3.60)#67 | 14.8%(+1.90)#5,048 |
| 68. | Avon | 16.5% | 13.1%(+3.40)#68 | 14.8%(+1.70)#5,120 |
| 69. | South Willard | 16.4% | 13.1%(+3.30)#69 | 14.8%(+1.60)#5,146 |
| 70. | Woods Cross | 16.2% | 13.1%(+3.10)#70 | 14.8%(+1.40)#5,197 |
| 71. | Oakley | 16.1% | 13.1%(+3.00)#71 | 14.8%(+1.30)#5,242 |
| 72. | North Logan | 16.0% | 13.1%(+2.90)#72 | 14.8%(+1.20)#5,263 |
| 73. | Mantua | 15.8% | 13.1%(+2.70)#73 | 14.8%(+1.000)#5,359 |
| 74. | Daniel | 15.5% | 13.1%(+2.40)#74 | 14.8%(+0.700)#5,460 |
| 75. | Big Water | 15.2% | 13.1%(+2.10)#75 | 14.8%(+0.400)#5,572 |
| 76. | Portage | 15.1% | 13.1%(+2.00)#76 | 14.8%(+0.300)#5,616 |
| 77. | West Point | 14.9% | 13.1%(+1.80)#77 | 14.8%(+0.100)#5,672 |
| 78. | Cornish | 14.9% | 13.1%(+1.80)#78 | 14.8%(+0.100)#5,696 |
| 79. | Hildale | 14.5% | 13.1%(+1.40)#79 | 14.8%(-0.300)#5,836 |
| 80. | Hideout | 14.5% | 13.1%(+1.40)#80 | 14.8%(-0.300)#5,837 |
| 81. | Paradise | 14.5% | 13.1%(+1.40)#81 | 14.8%(-0.300)#5,840 |
| 82. | Fort Duchesne | 14.5% | 13.1%(+1.40)#82 | 14.8%(-0.300)#5,847 |
| 83. | Pleasant Grove | 14.4% | 13.1%(+1.30)#83 | 14.8%(-0.400)#5,856 |
| 84. | Providence | 14.3% | 13.1%(+1.20)#84 | 14.8%(-0.500)#5,902 |
| 85. | South Weber | 14.3% | 13.1%(+1.20)#85 | 14.8%(-0.500)#5,903 |
| 86. | Pine Valley | 14.1% | 13.1%(+1.000)#86 | 14.8%(-0.700)#6,018 |
| 87. | Washington | 13.8% | 13.1%(+0.700)#87 | 14.8%(-1.00)#6,124 |
| 88. | Grantsville | 13.6% | 13.1%(+0.500)#88 | 14.8%(-1.20)#6,230 |
| 89. | Central Valley | 13.6% | 13.1%(+0.500)#89 | 14.8%(-1.20)#6,254 |
| 90. | Herriman | 13.5% | 13.1%(+0.400)#90 | 14.8%(-1.30)#6,268 |
| 91. | Layton | 13.4% | 13.1%(+0.300)#91 | 14.8%(-1.40)#6,307 |
| 92. | Fairview | 13.4% | 13.1%(+0.300)#92 | 14.8%(-1.40)#6,341 |
| 93. | Hooper | 13.2% | 13.1%(+0.100)#93 | 14.8%(-1.60)#6,415 |
| 94. | Amalga | 13.2% | 13.1%(+0.100)#94 | 14.8%(-1.60)#6,434 |
| 95. | Willard | 13.0% | 13.1%(-0.100)#95 | 14.8%(-1.80)#6,515 |
| 96. | Morgan | 12.9% | 13.1%(-0.200)#96 | 14.8%(-1.90)#6,564 |
| 97. | Elk Ridge | 12.8% | 13.1%(-0.300)#97 | 14.8%(-2.00)#6,610 |
| 98. | Mona | 12.8% | 13.1%(-0.300)#98 | 14.8%(-2.00)#6,624 |
| 99. | Marion | 12.7% | 13.1%(-0.400)#99 | 14.8%(-2.10)#6,673 |
| 100. | Liberty | 12.5% | 13.1%(-0.600)#100 | 14.8%(-2.30)#6,754 |
Common Questions
What are the Top 10 Cities with the Highest Percentage of Families with Income Above $200,000 in Utah?
Top 10 Cities with the Highest Percentage of Families with Income Above $200,000 in Utah are:
#1
64.9%
#2
46.5%
#3
43.7%
#4
43.5%
#5
41.0%
#6
38.9%
#7
37.8%
#8
35.0%
#9
34.5%
#10
34.5%
What city has the Highest Percentage of Families with Income Above $200,000 in Utah?
Silver Summit has the Highest Percentage of Families with Income Above $200,000 in Utah with 64.9%.
What is the Percentage of Families with Income Above $200,000 in the State of Utah?
Percentage of Families with Income Above $200,000 in Utah is 13.1%.
What is the Percentage of Families with Income Above $200,000 in the United States?
Percentage of Families with Income Above $200,000 in the United States is 14.8%.