Cities with the Highest Percentage of Families with Income Above $200,000 in Indiana
RELATED REPORTS & OPTIONS
Family Income | $200k+
Indiana
Compare Cities
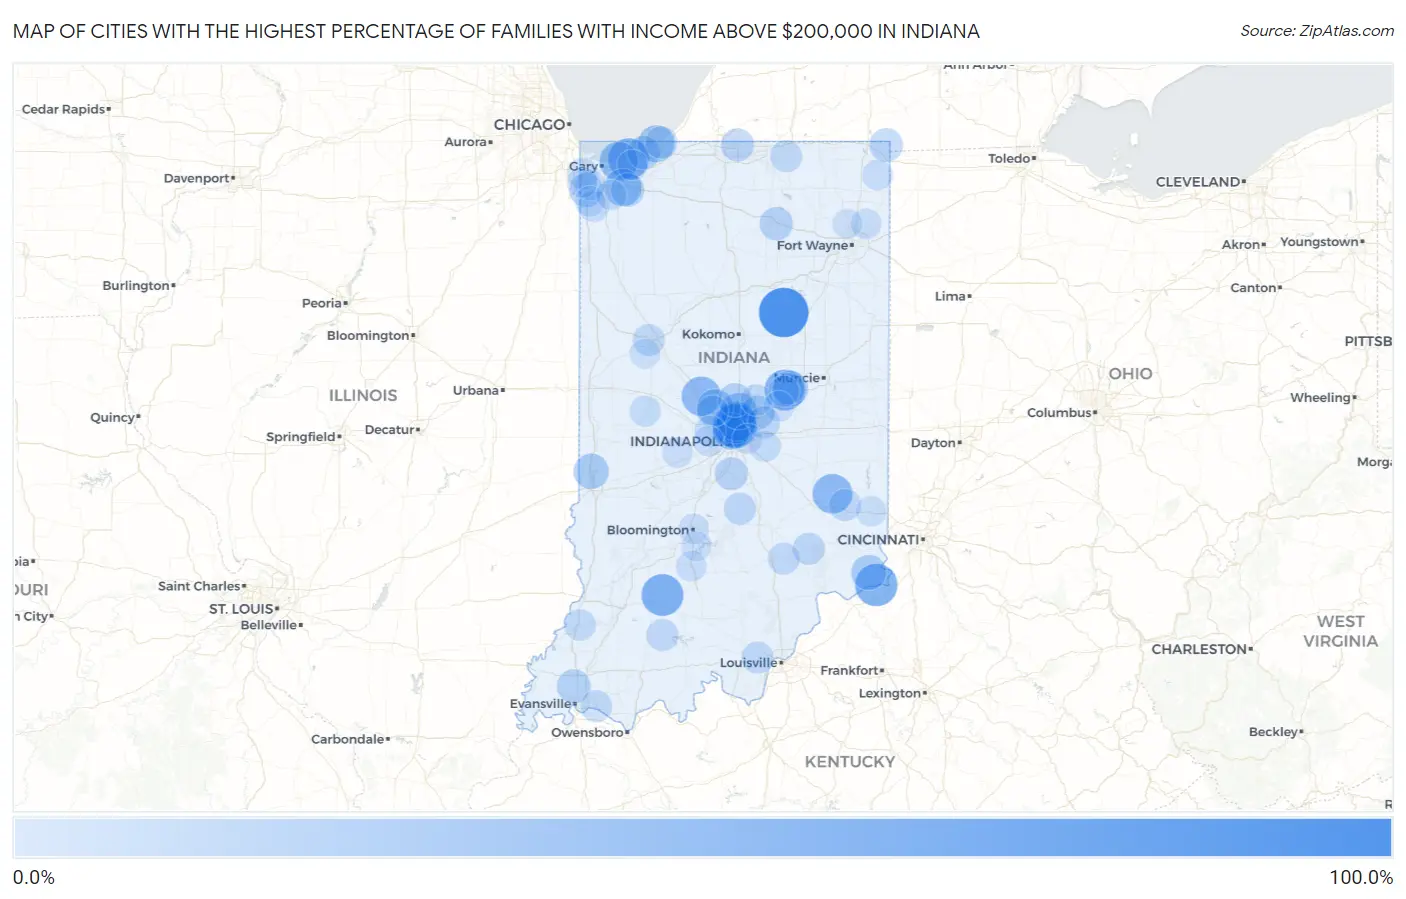
Map of Cities with the Highest Percentage of Families with Income Above $200,000 in Indiana
0.0%
100.0%
Cities with the Highest Percentage of Families with Income Above $200,000 in Indiana
| City | Families with Income > $200k | vs State | vs National | |
| 1. | Jalapa | 100.0% | 9.3%(+90.7)#1 | 14.8%(+85.2)#31 |
| 2. | Solsberry | 81.4% | 9.3%(+72.1)#2 | 14.8%(+66.6)#78 |
| 3. | North Crows Nest | 75.0% | 9.3%(+65.7)#3 | 14.8%(+60.2)#116 |
| 4. | Florence | 66.7% | 9.3%(+57.4)#4 | 14.8%(+51.9)#232 |
| 5. | Dover Hill | 64.7% | 9.3%(+55.4)#5 | 14.8%(+49.9)#273 |
| 6. | Dune Acres | 60.3% | 9.3%(+51.0)#6 | 14.8%(+45.5)#402 |
| 7. | River Forest | 60.0% | 9.3%(+50.7)#7 | 14.8%(+45.2)#411 |
| 8. | Crows Nest | 56.0% | 9.3%(+46.7)#8 | 14.8%(+41.2)#549 |
| 9. | Lake Santee | 54.8% | 9.3%(+45.5)#9 | 14.8%(+40.0)#589 |
| 10. | Harrison Lake | 54.7% | 9.3%(+45.4)#10 | 14.8%(+39.9)#593 |
| 11. | Duneland Beach | 54.5% | 9.3%(+45.2)#11 | 14.8%(+39.7)#599 |
| 12. | Meridian Hills | 53.5% | 9.3%(+44.2)#12 | 14.8%(+38.7)#643 |
| 13. | Williams Creek | 52.9% | 9.3%(+43.6)#13 | 14.8%(+38.1)#669 |
| 14. | Ulen | 52.9% | 9.3%(+43.6)#14 | 14.8%(+38.1)#672 |
| 15. | Ogden Dunes | 50.0% | 9.3%(+40.7)#15 | 14.8%(+35.2)#785 |
| 16. | Schaefer Lake | 50.0% | 9.3%(+40.7)#16 | 14.8%(+35.2)#788 |
| 17. | Pleasant Mills | 46.0% | 9.3%(+36.7)#17 | 14.8%(+31.2)#996 |
| 18. | Bowling Green | 45.2% | 9.3%(+35.9)#18 | 14.8%(+30.4)#1,044 |
| 19. | Shorewood Forest | 44.1% | 9.3%(+34.8)#19 | 14.8%(+29.3)#1,095 |
| 20. | Snow Lake | 43.3% | 9.3%(+34.0)#20 | 14.8%(+28.5)#1,160 |
| 21. | Long Beach | 42.3% | 9.3%(+33.0)#21 | 14.8%(+27.5)#1,234 |
| 22. | Wynnedale | 41.4% | 9.3%(+32.1)#22 | 14.8%(+26.6)#1,301 |
| 23. | Carmel | 41.0% | 9.3%(+31.7)#23 | 14.8%(+26.2)#1,319 |
| 24. | Zionsville | 41.0% | 9.3%(+31.7)#24 | 14.8%(+26.2)#1,320 |
| 25. | Grandview Lake | 40.2% | 9.3%(+30.9)#25 | 14.8%(+25.4)#1,396 |
| 26. | Country Club Heights | 37.9% | 9.3%(+28.6)#26 | 14.8%(+23.1)#1,589 |
| 27. | Saugany Lake | 36.2% | 9.3%(+26.9)#27 | 14.8%(+21.4)#1,731 |
| 28. | East Enterprise | 34.8% | 9.3%(+25.5)#28 | 14.8%(+20.0)#1,863 |
| 29. | Tecumseh | 34.6% | 9.3%(+25.3)#29 | 14.8%(+19.8)#1,879 |
| 30. | Jimmerson Lake | 33.9% | 9.3%(+24.6)#30 | 14.8%(+19.1)#1,948 |
| 31. | Rockford | 30.6% | 9.3%(+21.3)#31 | 14.8%(+15.8)#2,302 |
| 32. | Philadelphia | 30.1% | 9.3%(+20.8)#32 | 14.8%(+15.3)#2,363 |
| 33. | St John | 29.2% | 9.3%(+19.9)#33 | 14.8%(+14.4)#2,475 |
| 34. | Darmstadt | 28.3% | 9.3%(+19.0)#34 | 14.8%(+13.5)#2,614 |
| 35. | Westfield | 28.1% | 9.3%(+18.8)#35 | 14.8%(+13.3)#2,632 |
| 36. | Cory | 27.8% | 9.3%(+18.5)#36 | 14.8%(+13.0)#2,699 |
| 37. | Fishers | 27.7% | 9.3%(+18.4)#37 | 14.8%(+12.9)#2,702 |
| 38. | Aberdeen | 27.2% | 9.3%(+17.9)#38 | 14.8%(+12.4)#2,785 |
| 39. | Beverly Shores | 26.8% | 9.3%(+17.5)#39 | 14.8%(+12.0)#2,846 |
| 40. | Winona Lake | 26.7% | 9.3%(+17.4)#40 | 14.8%(+11.9)#2,856 |
| 41. | Mariah Hill | 26.7% | 9.3%(+17.4)#41 | 14.8%(+11.9)#2,864 |
| 42. | Clear Lake | 26.2% | 9.3%(+16.9)#42 | 14.8%(+11.4)#2,923 |
| 43. | Coesse | 25.6% | 9.3%(+16.3)#43 | 14.8%(+10.8)#3,021 |
| 44. | Bargersville | 25.0% | 9.3%(+15.7)#44 | 14.8%(+10.2)#3,101 |
| 45. | Granger | 24.9% | 9.3%(+15.6)#45 | 14.8%(+10.1)#3,134 |
| 46. | St. Wendel | 24.6% | 9.3%(+15.3)#46 | 14.8%(+9.80)#3,189 |
| 47. | Browns Crossing | 24.6% | 9.3%(+15.3)#47 | 14.8%(+9.80)#3,192 |
| 48. | Blue Ridge | 23.7% | 9.3%(+14.4)#48 | 14.8%(+8.90)#3,355 |
| 49. | Mccordsville | 22.6% | 9.3%(+13.3)#49 | 14.8%(+7.80)#3,546 |
| 50. | Oldenburg | 21.6% | 9.3%(+12.3)#50 | 14.8%(+6.80)#3,764 |
| 51. | Michiana Shores | 21.4% | 9.3%(+12.1)#51 | 14.8%(+6.60)#3,801 |
| 52. | Spencerville | 21.4% | 9.3%(+12.1)#52 | 14.8%(+6.60)#3,803 |
| 53. | Butlerville | 21.3% | 9.3%(+12.0)#53 | 14.8%(+6.50)#3,822 |
| 54. | Floyds Knobs | 21.2% | 9.3%(+11.9)#54 | 14.8%(+6.40)#3,836 |
| 55. | Cordry Sweetwater Lakes | 20.7% | 9.3%(+11.4)#55 | 14.8%(+5.90)#3,954 |
| 56. | West Lafayette | 20.5% | 9.3%(+11.2)#56 | 14.8%(+5.70)#3,980 |
| 57. | Newbern | 20.5% | 9.3%(+11.2)#57 | 14.8%(+5.70)#4,008 |
| 58. | Middlebury | 20.4% | 9.3%(+11.1)#58 | 14.8%(+5.60)#4,026 |
| 59. | Dubois | 20.4% | 9.3%(+11.1)#59 | 14.8%(+5.60)#4,032 |
| 60. | Newburgh | 20.1% | 9.3%(+10.8)#60 | 14.8%(+5.30)#4,099 |
| 61. | Georgetown | 20.0% | 9.3%(+10.7)#61 | 14.8%(+5.20)#4,117 |
| 62. | Hessen Cassel | 20.0% | 9.3%(+10.7)#62 | 14.8%(+5.20)#4,127 |
| 63. | Marshfield | 20.0% | 9.3%(+10.7)#63 | 14.8%(+5.20)#4,138 |
| 64. | Hayden | 19.7% | 9.3%(+10.4)#64 | 14.8%(+4.90)#4,198 |
| 65. | Foxcliff Estates | 19.1% | 9.3%(+9.80)#65 | 14.8%(+4.30)#4,334 |
| 66. | Whitestown | 19.0% | 9.3%(+9.70)#66 | 14.8%(+4.20)#4,352 |
| 67. | Decker | 18.9% | 9.3%(+9.60)#67 | 14.8%(+4.10)#4,396 |
| 68. | Nineveh | 18.8% | 9.3%(+9.50)#68 | 14.8%(+4.00)#4,422 |
| 69. | Noblesville | 18.7% | 9.3%(+9.40)#69 | 14.8%(+3.90)#4,432 |
| 70. | Woodlawn Heights | 18.2% | 9.3%(+8.90)#70 | 14.8%(+3.40)#4,584 |
| 71. | Celestine | 18.1% | 9.3%(+8.80)#71 | 14.8%(+3.30)#4,617 |
| 72. | Carrollton | 17.6% | 9.3%(+8.30)#72 | 14.8%(+2.80)#4,766 |
| 73. | Munster | 17.5% | 9.3%(+8.20)#73 | 14.8%(+2.70)#4,782 |
| 74. | Brownsburg | 17.2% | 9.3%(+7.90)#74 | 14.8%(+2.40)#4,896 |
| 75. | Lake Dalecarlia | 17.0% | 9.3%(+7.70)#75 | 14.8%(+2.20)#4,957 |
| 76. | New Palestine | 16.5% | 9.3%(+7.20)#76 | 14.8%(+1.70)#5,110 |
| 77. | Lake Holiday | 16.5% | 9.3%(+7.20)#77 | 14.8%(+1.70)#5,116 |
| 78. | Edgewood | 16.2% | 9.3%(+6.90)#78 | 14.8%(+1.40)#5,211 |
| 79. | South Center | 16.0% | 9.3%(+6.70)#79 | 14.8%(+1.20)#5,291 |
| 80. | Hamilton | 14.9% | 9.3%(+5.60)#80 | 14.8%(+0.100)#5,681 |
| 81. | Leo Cedarville | 14.7% | 9.3%(+5.40)#81 | 14.8%(-0.100)#5,747 |
| 82. | Avon | 14.6% | 9.3%(+5.30)#82 | 14.8%(-0.200)#5,775 |
| 83. | Pendleton | 14.6% | 9.3%(+5.30)#83 | 14.8%(-0.200)#5,788 |
| 84. | Schererville | 14.5% | 9.3%(+5.20)#84 | 14.8%(-0.300)#5,810 |
| 85. | Coatesville | 14.5% | 9.3%(+5.20)#85 | 14.8%(-0.300)#5,845 |
| 86. | Dyer | 14.3% | 9.3%(+5.00)#86 | 14.8%(-0.500)#5,895 |
| 87. | Ramsey | 14.3% | 9.3%(+5.00)#87 | 14.8%(-0.500)#5,920 |
| 88. | Avoca | 14.3% | 9.3%(+5.00)#88 | 14.8%(-0.500)#5,923 |
| 89. | Bloomington | 13.8% | 9.3%(+4.50)#89 | 14.8%(-1.00)#6,120 |
| 90. | Cedar Lake | 13.8% | 9.3%(+4.50)#90 | 14.8%(-1.00)#6,129 |
| 91. | Chesterton | 13.7% | 9.3%(+4.40)#91 | 14.8%(-1.10)#6,182 |
| 92. | Wellsboro | 13.6% | 9.3%(+4.30)#92 | 14.8%(-1.20)#6,258 |
| 93. | Winfield | 13.5% | 9.3%(+4.20)#93 | 14.8%(-1.30)#6,280 |
| 94. | St Leon | 13.5% | 9.3%(+4.20)#94 | 14.8%(-1.30)#6,294 |
| 95. | Tocsin | 13.5% | 9.3%(+4.20)#95 | 14.8%(-1.30)#6,300 |
| 96. | Shadeland | 13.3% | 9.3%(+4.00)#96 | 14.8%(-1.50)#6,384 |
| 97. | Smithville Sanders | 13.2% | 9.3%(+3.90)#97 | 14.8%(-1.60)#6,425 |
| 98. | Lake Eliza | 13.2% | 9.3%(+3.90)#98 | 14.8%(-1.60)#6,431 |
| 99. | Warren Park | 12.9% | 9.3%(+3.60)#99 | 14.8%(-1.90)#6,577 |
| 100. | Huntertown | 12.6% | 9.3%(+3.30)#100 | 14.8%(-2.20)#6,689 |
Common Questions
What are the Top 10 Cities with the Highest Percentage of Families with Income Above $200,000 in Indiana?
Top 10 Cities with the Highest Percentage of Families with Income Above $200,000 in Indiana are:
#1
100.0%
#2
75.0%
#3
66.7%
#4
64.7%
#5
60.3%
#6
60.0%
#7
56.0%
#8
54.8%
#9
53.5%
#10
52.9%
What city has the Highest Percentage of Families with Income Above $200,000 in Indiana?
Jalapa has the Highest Percentage of Families with Income Above $200,000 in Indiana with 100.0%.
What is the Percentage of Families with Income Above $200,000 in the State of Indiana?
Percentage of Families with Income Above $200,000 in Indiana is 9.3%.
What is the Percentage of Families with Income Above $200,000 in the United States?
Percentage of Families with Income Above $200,000 in the United States is 14.8%.