Cities with the Highest Percentage of Families with Income Above $200,000 in Vermont
RELATED REPORTS & OPTIONS
Family Income | $200k+
Vermont
Compare Cities
Map of Cities with the Highest Percentage of Families with Income Above $200,000 in Vermont
0.0%
80.0%
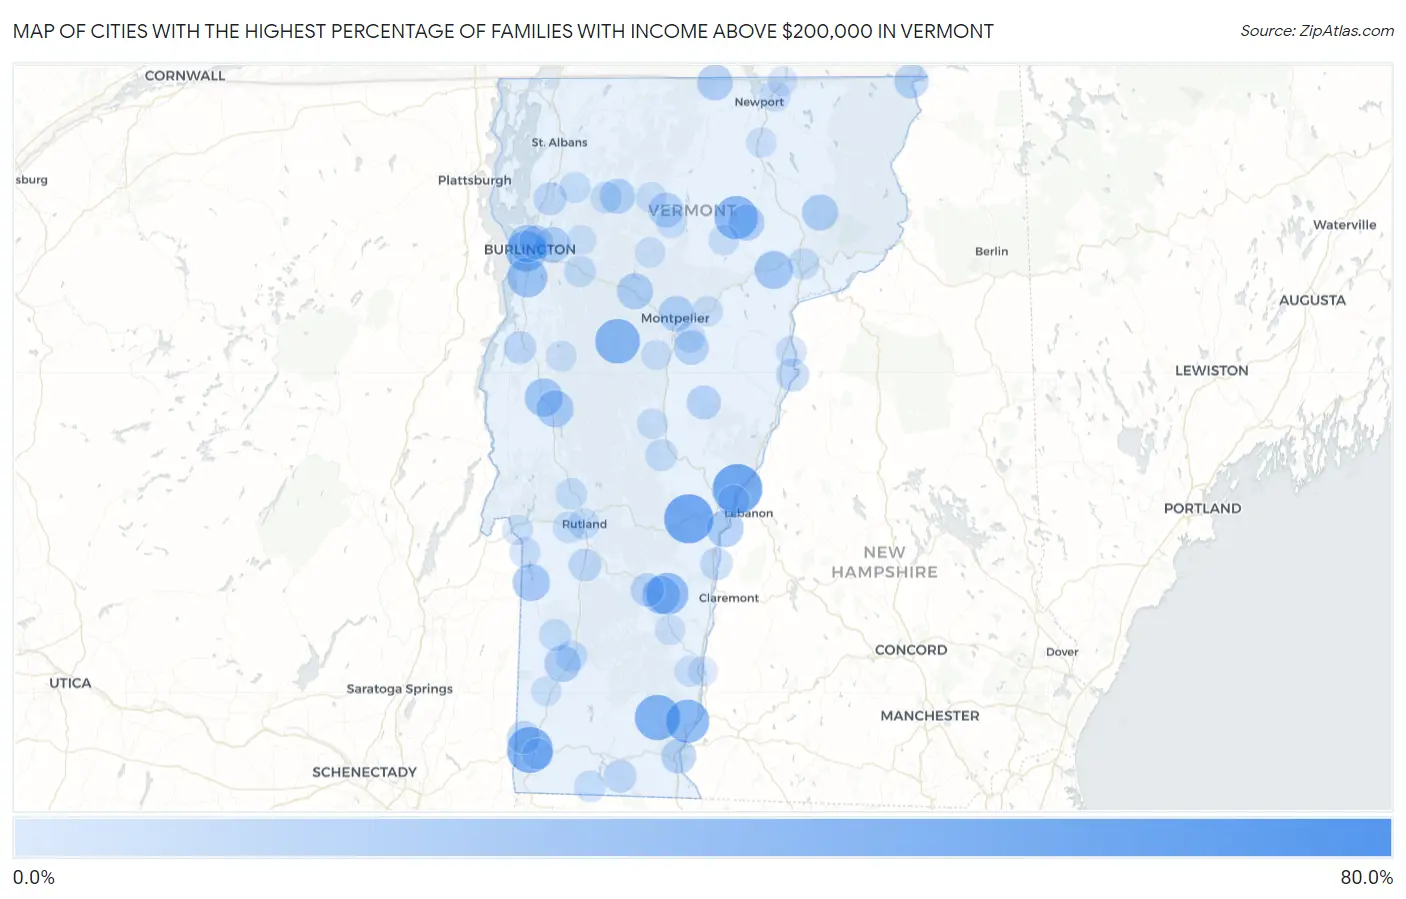
Cities with the Highest Percentage of Families with Income Above $200,000 in Vermont
| City | Families with Income > $200k | vs State | vs National | |
| 1. | Stratton Mountain | 62.5% | 12.3%(+50.2)#1 | 14.8%(+47.7)#327 |
| 2. | Waterbury Center | 61.3% | 12.3%(+49.0)#2 | 14.8%(+46.5)#374 |
| 3. | Grafton | 52.4% | 12.3%(+40.1)#3 | 14.8%(+37.6)#694 |
| 4. | Norwich | 46.0% | 12.3%(+33.7)#4 | 14.8%(+31.2)#994 |
| 5. | Woodstock | 45.1% | 12.3%(+32.8)#5 | 14.8%(+30.3)#1,050 |
| 6. | Jamaica | 40.7% | 12.3%(+28.4)#6 | 14.8%(+25.9)#1,351 |
| 7. | Old Bennington | 37.7% | 12.3%(+25.4)#7 | 14.8%(+22.9)#1,605 |
| 8. | Newfane | 36.4% | 12.3%(+24.1)#8 | 14.8%(+21.6)#1,716 |
| 9. | Algiers | 36.2% | 12.3%(+23.9)#9 | 14.8%(+21.4)#1,730 |
| 10. | Waitsfield | 35.0% | 12.3%(+22.7)#10 | 14.8%(+20.2)#1,848 |
| 11. | Putney | 32.3% | 12.3%(+20.0)#11 | 14.8%(+17.5)#2,127 |
| 12. | Greensboro | 32.0% | 12.3%(+19.7)#12 | 14.8%(+17.2)#2,159 |
| 13. | Huntington Center | 31.6% | 12.3%(+19.3)#13 | 14.8%(+16.8)#2,196 |
| 14. | Townshend | 30.3% | 12.3%(+18.0)#14 | 14.8%(+15.5)#2,337 |
| 15. | South Londonderry | 29.4% | 12.3%(+17.1)#15 | 14.8%(+14.6)#2,455 |
| 16. | East Charlotte | 29.2% | 12.3%(+16.9)#16 | 14.8%(+14.4)#2,483 |
| 17. | Cavendish | 28.8% | 12.3%(+16.5)#17 | 14.8%(+14.0)#2,538 |
| 18. | Peacham | 26.9% | 12.3%(+14.6)#18 | 14.8%(+12.1)#2,835 |
| 19. | South Burlington | 26.0% | 12.3%(+13.7)#19 | 14.8%(+11.2)#2,943 |
| 20. | West Woodstock | 25.4% | 12.3%(+13.1)#20 | 14.8%(+10.6)#3,048 |
| 21. | Shelburne | 23.8% | 12.3%(+11.5)#21 | 14.8%(+9.00)#3,322 |
| 22. | South Hero | 21.3% | 12.3%(+9.00)#22 | 14.8%(+6.50)#3,823 |
| 23. | Middlebury | 20.4% | 12.3%(+8.10)#23 | 14.8%(+5.60)#4,019 |
| 24. | Proctorsville | 20.3% | 12.3%(+8.00)#24 | 14.8%(+5.50)#4,056 |
| 25. | Danville | 20.2% | 12.3%(+7.90)#25 | 14.8%(+5.40)#4,082 |
| 26. | Weston | 20.0% | 12.3%(+7.70)#26 | 14.8%(+5.20)#4,142 |
| 27. | Burlington | 19.8% | 12.3%(+7.50)#27 | 14.8%(+5.00)#4,165 |
| 28. | Wells | 18.3% | 12.3%(+6.00)#28 | 14.8%(+3.50)#4,550 |
| 29. | East Middlebury | 18.0% | 12.3%(+5.70)#29 | 14.8%(+3.20)#4,649 |
| 30. | North Hartland | 17.6% | 12.3%(+5.30)#30 | 14.8%(+2.80)#4,767 |
| 31. | Manchester | 16.7% | 12.3%(+4.40)#31 | 14.8%(+1.90)#5,044 |
| 32. | Bolton | 16.7% | 12.3%(+4.40)#32 | 14.8%(+1.90)#5,061 |
| 33. | Greensboro Bend | 16.1% | 12.3%(+3.80)#33 | 14.8%(+1.30)#5,252 |
| 34. | Waterbury | 15.8% | 12.3%(+3.50)#34 | 14.8%(+1.000)#5,356 |
| 35. | East Burke | 15.8% | 12.3%(+3.50)#35 | 14.8%(+1.000)#5,373 |
| 36. | Essex Junction | 15.7% | 12.3%(+3.40)#36 | 14.8%(+0.900)#5,382 |
| 37. | North Troy | 15.0% | 12.3%(+2.70)#37 | 14.8%(+0.200)#5,654 |
| 38. | Montpelier | 14.9% | 12.3%(+2.60)#38 | 14.8%(+0.100)#5,674 |
| 39. | Stamford | 14.3% | 12.3%(+2.00)#39 | 14.8%(-0.500)#5,921 |
| 40. | Jeffersonville | 13.7% | 12.3%(+1.40)#40 | 14.8%(-1.10)#6,214 |
| 41. | Pawlet | 13.7% | 12.3%(+1.40)#41 | 14.8%(-1.10)#6,218 |
| 42. | Hyde Park | 13.3% | 12.3%(+1.000)#42 | 14.8%(-1.50)#6,389 |
| 43. | Bakersfield | 13.2% | 12.3%(+0.900)#43 | 14.8%(-1.60)#6,437 |
| 44. | Brattleboro | 12.9% | 12.3%(+0.600)#44 | 14.8%(-1.90)#6,557 |
| 45. | South Barre | 12.6% | 12.3%(+0.300)#45 | 14.8%(-2.20)#6,703 |
| 46. | Harmonyville | 12.5% | 12.3%(+0.200)#46 | 14.8%(-2.30)#6,769 |
| 47. | Chittenden | 12.5% | 12.3%(+0.200)#47 | 14.8%(-2.30)#6,776 |
| 48. | Canaan | 12.2% | 12.3%(-0.100)#48 | 14.8%(-2.60)#6,924 |
| 49. | Winooski | 12.1% | 12.3%(-0.200)#49 | 14.8%(-2.70)#6,953 |
| 50. | Westford | 11.8% | 12.3%(-0.500)#50 | 14.8%(-3.00)#7,137 |
| 51. | Chelsea | 11.6% | 12.3%(-0.700)#51 | 14.8%(-3.20)#7,251 |
| 52. | Hanksville | 11.1% | 12.3%(-1.20)#52 | 14.8%(-3.70)#7,599 |
| 53. | Ludlow | 10.3% | 12.3%(-2.00)#53 | 14.8%(-4.50)#8,061 |
| 54. | West Pawlet | 10.0% | 12.3%(-2.30)#54 | 14.8%(-4.80)#8,288 |
| 55. | North Bennington | 9.9% | 12.3%(-2.40)#55 | 14.8%(-4.90)#8,369 |
| 56. | Killington | 9.7% | 12.3%(-2.60)#56 | 14.8%(-5.10)#8,531 |
| 57. | Milton | 9.4% | 12.3%(-2.90)#57 | 14.8%(-5.40)#8,693 |
| 58. | Huntington | 9.2% | 12.3%(-3.10)#58 | 14.8%(-5.60)#8,885 |
| 59. | Newbury | 9.1% | 12.3%(-3.20)#59 | 14.8%(-5.70)#8,958 |
| 60. | Jacksonville | 8.9% | 12.3%(-3.40)#60 | 14.8%(-5.90)#9,115 |
| 61. | Vergennes | 8.6% | 12.3%(-3.70)#61 | 14.8%(-6.20)#9,359 |
| 62. | Wallingford | 8.6% | 12.3%(-3.70)#62 | 14.8%(-6.20)#9,391 |
| 63. | Pownal Center | 8.4% | 12.3%(-3.90)#63 | 14.8%(-6.40)#9,560 |
| 64. | Windsor | 8.1% | 12.3%(-4.20)#64 | 14.8%(-6.70)#9,817 |
| 65. | Wilder | 7.8% | 12.3%(-4.50)#65 | 14.8%(-7.00)#10,104 |
| 66. | Bethel | 7.1% | 12.3%(-5.20)#66 | 14.8%(-7.70)#10,861 |
| 67. | Dorset | 7.0% | 12.3%(-5.30)#67 | 14.8%(-7.80)#10,983 |
| 68. | South Lincoln | 7.0% | 12.3%(-5.30)#68 | 14.8%(-7.80)#11,000 |
| 69. | Manchester Center | 6.6% | 12.3%(-5.70)#69 | 14.8%(-8.20)#11,413 |
| 70. | Richmond | 6.4% | 12.3%(-5.90)#70 | 14.8%(-8.40)#11,668 |
| 71. | Cambridge | 6.3% | 12.3%(-6.00)#71 | 14.8%(-8.50)#11,821 |
| 72. | West Rutland | 6.0% | 12.3%(-6.30)#72 | 14.8%(-8.80)#12,118 |
| 73. | Rutland | 5.9% | 12.3%(-6.40)#73 | 14.8%(-8.90)#12,218 |
| 74. | Pittsford | 5.8% | 12.3%(-6.50)#74 | 14.8%(-9.00)#12,447 |
| 75. | Readsboro | 5.7% | 12.3%(-6.60)#75 | 14.8%(-9.10)#12,588 |
| 76. | St Johnsbury | 5.6% | 12.3%(-6.70)#76 | 14.8%(-9.20)#12,635 |
| 77. | Fairfax | 5.3% | 12.3%(-7.00)#77 | 14.8%(-9.50)#13,076 |
| 78. | Morrisville | 5.2% | 12.3%(-7.10)#78 | 14.8%(-9.60)#13,194 |
| 79. | Bennington | 5.1% | 12.3%(-7.20)#79 | 14.8%(-9.70)#13,283 |
| 80. | Saxtons River | 5.0% | 12.3%(-7.30)#80 | 14.8%(-9.80)#13,505 |
| 81. | Derby Center | 4.8% | 12.3%(-7.50)#81 | 14.8%(-10.0)#13,804 |
| 82. | Lincoln | 4.8% | 12.3%(-7.50)#82 | 14.8%(-10.0)#13,829 |
| 83. | Barre | 4.6% | 12.3%(-7.70)#83 | 14.8%(-10.2)#14,036 |
| 84. | Proctor | 4.6% | 12.3%(-7.70)#84 | 14.8%(-10.2)#14,088 |
| 85. | Johnson | 4.6% | 12.3%(-7.70)#85 | 14.8%(-10.2)#14,096 |
| 86. | Wells River | 4.6% | 12.3%(-7.70)#86 | 14.8%(-10.2)#14,134 |
| 87. | Hardwick | 4.5% | 12.3%(-7.80)#87 | 14.8%(-10.3)#14,224 |
| 88. | Randolph | 4.3% | 12.3%(-8.00)#88 | 14.8%(-10.5)#14,541 |
| 89. | Poultney | 4.3% | 12.3%(-8.00)#89 | 14.8%(-10.5)#14,560 |
| 90. | Plainfield | 4.2% | 12.3%(-8.10)#90 | 14.8%(-10.6)#14,765 |
| 91. | Bristol | 4.1% | 12.3%(-8.20)#91 | 14.8%(-10.7)#14,869 |
| 92. | Fair Haven | 3.9% | 12.3%(-8.40)#92 | 14.8%(-10.9)#15,203 |
| 93. | Stowe | 3.8% | 12.3%(-8.50)#93 | 14.8%(-11.0)#15,421 |
| 94. | Chester | 3.6% | 12.3%(-8.70)#94 | 14.8%(-11.2)#15,740 |
| 95. | Northfield | 3.5% | 12.3%(-8.80)#95 | 14.8%(-11.3)#15,867 |
| 96. | Orleans | 3.3% | 12.3%(-9.00)#96 | 14.8%(-11.5)#16,292 |
| 97. | Arlington | 3.2% | 12.3%(-9.10)#97 | 14.8%(-11.6)#16,440 |
| 98. | Bellows Falls | 2.7% | 12.3%(-9.60)#98 | 14.8%(-12.1)#17,297 |
| 99. | Jericho | 2.7% | 12.3%(-9.60)#99 | 14.8%(-12.1)#17,342 |
| 100. | Derby Line | 2.7% | 12.3%(-9.60)#100 | 14.8%(-12.1)#17,365 |
1
2Common Questions
What are the Top 10 Cities with the Highest Percentage of Families with Income Above $200,000 in Vermont?
Top 10 Cities with the Highest Percentage of Families with Income Above $200,000 in Vermont are:
#1
46.0%
#2
45.1%
#3
37.7%
#4
36.4%
#5
35.0%
#6
32.3%
#7
32.0%
#8
28.8%
#9
26.0%
#10
23.8%
What city has the Highest Percentage of Families with Income Above $200,000 in Vermont?
Norwich has the Highest Percentage of Families with Income Above $200,000 in Vermont with 46.0%.
What is the Percentage of Families with Income Above $200,000 in the State of Vermont?
Percentage of Families with Income Above $200,000 in Vermont is 12.3%.
What is the Percentage of Families with Income Above $200,000 in the United States?
Percentage of Families with Income Above $200,000 in the United States is 14.8%.