Cities with the Highest Percentage of Families with Income Above $200,000 in Maryland
RELATED REPORTS & OPTIONS
Family Income | $200k+
Maryland
Compare Cities
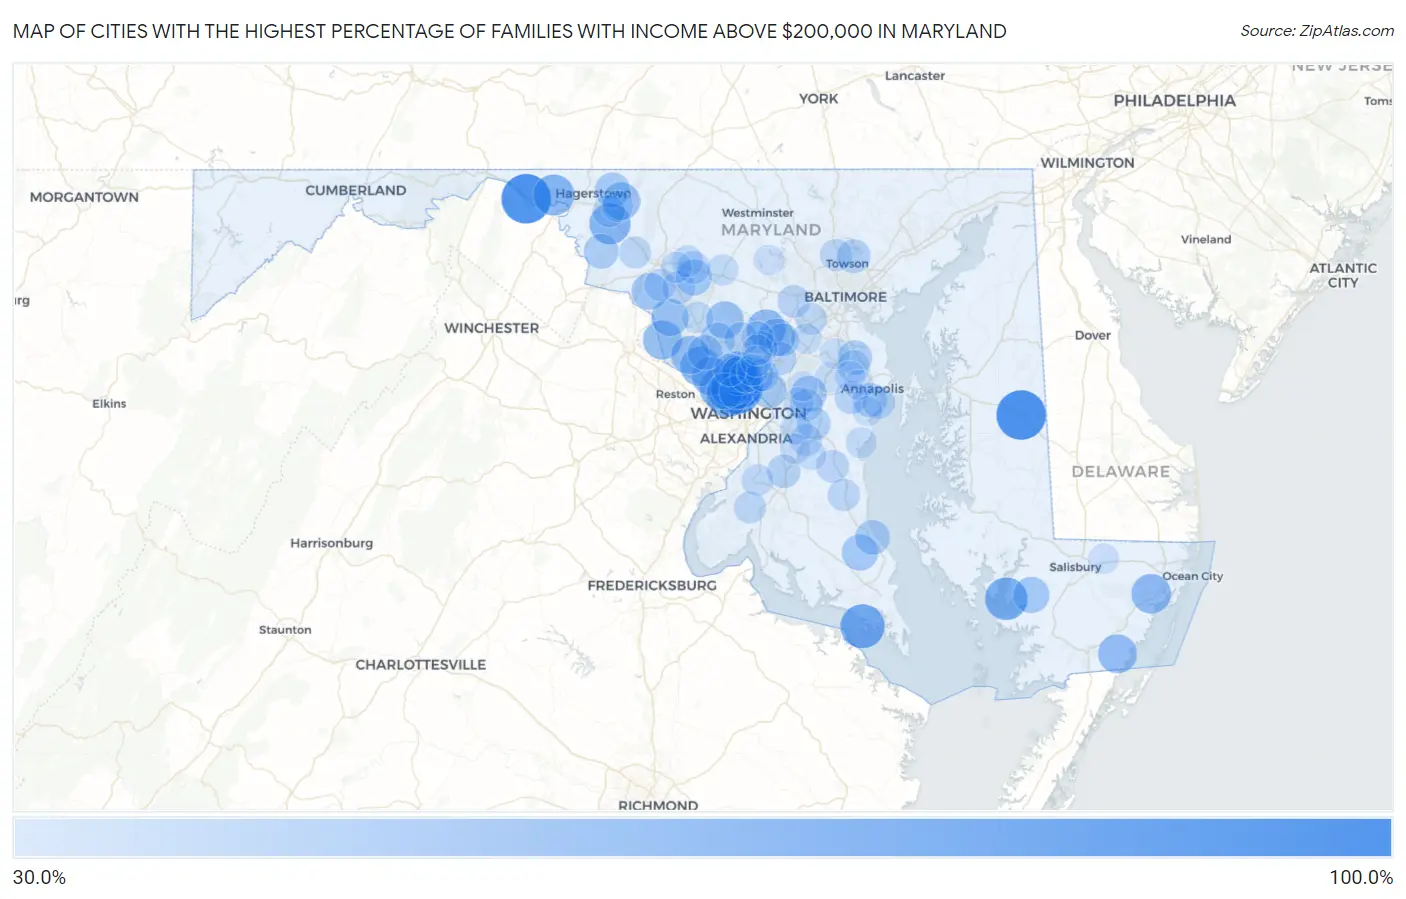
Map of Cities with the Highest Percentage of Families with Income Above $200,000 in Maryland
0.0%
100.0%
Cities with the Highest Percentage of Families with Income Above $200,000 in Maryland
| City | Families with Income > $200k | vs State | vs National | |
| 1. | West Denton | 100.0% | 23.6%(+76.4)#1 | 14.8%(+85.2)#29 |
| 2. | Big Pool | 100.0% | 23.6%(+76.4)#2 | 14.8%(+85.2)#30 |
| 3. | Somerset | 84.7% | 23.6%(+61.1)#3 | 14.8%(+69.9)#67 |
| 4. | Chevy Chase Village | 83.7% | 23.6%(+60.1)#4 | 14.8%(+68.9)#71 |
| 5. | Tall Timbers | 81.3% | 23.6%(+57.7)#5 | 14.8%(+66.5)#79 |
| 6. | Chevy Chase Section Five | 80.3% | 23.6%(+56.7)#6 | 14.8%(+65.5)#83 |
| 7. | Martin S Additions | 79.3% | 23.6%(+55.7)#7 | 14.8%(+64.5)#91 |
| 8. | Chevy Chase View | 78.9% | 23.6%(+55.3)#8 | 14.8%(+64.1)#94 |
| 9. | Nanticoke Acres | 75.7% | 23.6%(+52.1)#9 | 14.8%(+60.9)#111 |
| 10. | Lisbon | 75.0% | 23.6%(+51.4)#10 | 14.8%(+60.2)#117 |
| 11. | Chevy Chase Section Three | 74.7% | 23.6%(+51.1)#11 | 14.8%(+59.9)#120 |
| 12. | Brookmont | 73.7% | 23.6%(+50.1)#12 | 14.8%(+58.9)#130 |
| 13. | Mapleville | 70.9% | 23.6%(+47.3)#13 | 14.8%(+56.1)#171 |
| 14. | Charlton | 70.8% | 23.6%(+47.2)#14 | 14.8%(+56.0)#172 |
| 15. | Cabin John | 70.1% | 23.6%(+46.5)#15 | 14.8%(+55.3)#181 |
| 16. | North Chevy Chase | 69.1% | 23.6%(+45.5)#16 | 14.8%(+54.3)#193 |
| 17. | Garrett Park | 67.6% | 23.6%(+44.0)#17 | 14.8%(+52.8)#221 |
| 18. | Chevy Chase | 67.5% | 23.6%(+43.9)#18 | 14.8%(+52.7)#222 |
| 19. | Newark | 65.5% | 23.6%(+41.9)#19 | 14.8%(+50.7)#256 |
| 20. | Travilah | 65.1% | 23.6%(+41.5)#20 | 14.8%(+50.3)#259 |
| 21. | Potomac | 64.5% | 23.6%(+40.9)#21 | 14.8%(+49.7)#278 |
| 22. | Poolesville | 63.9% | 23.6%(+40.3)#22 | 14.8%(+49.1)#290 |
| 23. | Highland | 63.5% | 23.6%(+39.9)#23 | 14.8%(+48.7)#301 |
| 24. | Stockton | 63.0% | 23.6%(+39.4)#24 | 14.8%(+48.2)#316 |
| 25. | Bethesda | 62.8% | 23.6%(+39.2)#25 | 14.8%(+48.0)#317 |
| 26. | South Kensington | 61.4% | 23.6%(+37.8)#26 | 14.8%(+46.6)#363 |
| 27. | Darnestown | 61.3% | 23.6%(+37.7)#27 | 14.8%(+46.5)#368 |
| 28. | Fulton | 59.9% | 23.6%(+36.3)#28 | 14.8%(+45.1)#413 |
| 29. | Jugtown | 59.3% | 23.6%(+35.7)#29 | 14.8%(+44.5)#425 |
| 30. | Barnesville | 58.8% | 23.6%(+35.2)#30 | 14.8%(+44.0)#438 |
| 31. | Laytonsville | 58.1% | 23.6%(+34.5)#31 | 14.8%(+43.3)#469 |
| 32. | Adamstown | 56.5% | 23.6%(+32.9)#32 | 14.8%(+41.7)#529 |
| 33. | Kensington | 55.1% | 23.6%(+31.5)#33 | 14.8%(+40.3)#574 |
| 34. | Four Corners | 54.6% | 23.6%(+31.0)#34 | 14.8%(+39.8)#595 |
| 35. | Broomes Island | 54.5% | 23.6%(+30.9)#35 | 14.8%(+39.7)#598 |
| 36. | Monrovia | 54.3% | 23.6%(+30.7)#36 | 14.8%(+39.5)#609 |
| 37. | Whitehaven | 54.3% | 23.6%(+30.7)#37 | 14.8%(+39.5)#611 |
| 38. | Glen Echo | 54.1% | 23.6%(+30.5)#38 | 14.8%(+39.3)#618 |
| 39. | University Park | 53.7% | 23.6%(+30.1)#39 | 14.8%(+38.9)#634 |
| 40. | Fairwood | 53.0% | 23.6%(+29.4)#40 | 14.8%(+38.2)#661 |
| 41. | Chewsville | 51.2% | 23.6%(+27.6)#41 | 14.8%(+36.4)#744 |
| 42. | Washington Grove | 50.0% | 23.6%(+26.4)#42 | 14.8%(+35.2)#786 |
| 43. | Mount Briar | 50.0% | 23.6%(+26.4)#43 | 14.8%(+35.2)#789 |
| 44. | North Potomac | 49.8% | 23.6%(+26.2)#44 | 14.8%(+35.0)#802 |
| 45. | St Leonard | 49.7% | 23.6%(+26.1)#45 | 14.8%(+34.9)#808 |
| 46. | Severna Park | 48.4% | 23.6%(+24.8)#46 | 14.8%(+33.6)#865 |
| 47. | Annapolis Neck | 47.7% | 23.6%(+24.1)#47 | 14.8%(+32.9)#896 |
| 48. | Hampton | 46.6% | 23.6%(+23.0)#48 | 14.8%(+31.8)#960 |
| 49. | Friendship Heights Village | 46.6% | 23.6%(+23.0)#49 | 14.8%(+31.8)#961 |
| 50. | Brock Hall | 46.0% | 23.6%(+22.4)#50 | 14.8%(+31.2)#991 |
| 51. | Olney | 45.4% | 23.6%(+21.8)#51 | 14.8%(+30.6)#1,025 |
| 52. | Brandywine | 45.3% | 23.6%(+21.7)#52 | 14.8%(+30.5)#1,033 |
| 53. | Konterra | 44.6% | 23.6%(+21.0)#53 | 14.8%(+29.8)#1,064 |
| 54. | Riva | 44.2% | 23.6%(+20.6)#54 | 14.8%(+29.4)#1,083 |
| 55. | Scaggsville | 44.1% | 23.6%(+20.5)#55 | 14.8%(+29.3)#1,090 |
| 56. | Urbana | 43.8% | 23.6%(+20.2)#56 | 14.8%(+29.0)#1,111 |
| 57. | Dunkirk | 43.5% | 23.6%(+19.9)#57 | 14.8%(+28.7)#1,141 |
| 58. | Forest Glen | 43.4% | 23.6%(+19.8)#58 | 14.8%(+28.6)#1,152 |
| 59. | New Market | 43.2% | 23.6%(+19.6)#59 | 14.8%(+28.4)#1,164 |
| 60. | Ellicott City | 42.9% | 23.6%(+19.3)#60 | 14.8%(+28.1)#1,174 |
| 61. | Spencerville | 42.8% | 23.6%(+19.2)#61 | 14.8%(+28.0)#1,190 |
| 62. | Hillandale | 42.6% | 23.6%(+19.0)#62 | 14.8%(+27.8)#1,202 |
| 63. | North Bethesda | 42.4% | 23.6%(+18.8)#63 | 14.8%(+27.6)#1,217 |
| 64. | Herald Harbor | 42.3% | 23.6%(+18.7)#64 | 14.8%(+27.5)#1,232 |
| 65. | Highland Beach | 42.1% | 23.6%(+18.5)#65 | 14.8%(+27.3)#1,253 |
| 66. | Woodmore | 42.0% | 23.6%(+18.4)#66 | 14.8%(+27.2)#1,255 |
| 67. | Huntingtown | 42.0% | 23.6%(+18.4)#67 | 14.8%(+27.2)#1,256 |
| 68. | Mays Chapel | 41.9% | 23.6%(+18.3)#68 | 14.8%(+27.1)#1,263 |
| 69. | Ashton Sandy Spring | 41.7% | 23.6%(+18.1)#69 | 14.8%(+26.9)#1,283 |
| 70. | Beaver Creek | 41.2% | 23.6%(+17.6)#70 | 14.8%(+26.4)#1,314 |
| 71. | Queensland | 41.0% | 23.6%(+17.4)#71 | 14.8%(+26.2)#1,326 |
| 72. | Pomfret | 41.0% | 23.6%(+17.4)#72 | 14.8%(+26.2)#1,329 |
| 73. | Buckeystown | 40.8% | 23.6%(+17.2)#73 | 14.8%(+26.0)#1,341 |
| 74. | Middletown | 40.7% | 23.6%(+17.1)#74 | 14.8%(+25.9)#1,346 |
| 75. | Accokeek | 40.4% | 23.6%(+16.8)#75 | 14.8%(+25.6)#1,376 |
| 76. | Green Valley | 40.3% | 23.6%(+16.7)#76 | 14.8%(+25.5)#1,381 |
| 77. | Westphalia | 39.8% | 23.6%(+16.2)#77 | 14.8%(+25.0)#1,432 |
| 78. | Ilchester | 39.7% | 23.6%(+16.1)#78 | 14.8%(+24.9)#1,436 |
| 79. | Linganore | 39.6% | 23.6%(+16.0)#79 | 14.8%(+24.8)#1,446 |
| 80. | Clarksburg | 39.4% | 23.6%(+15.8)#80 | 14.8%(+24.6)#1,466 |
| 81. | Kemp Mill | 39.1% | 23.6%(+15.5)#81 | 14.8%(+24.3)#1,492 |
| 82. | Bartonsville | 38.9% | 23.6%(+15.3)#82 | 14.8%(+24.1)#1,510 |
| 83. | Mount Airy | 38.8% | 23.6%(+15.2)#83 | 14.8%(+24.0)#1,515 |
| 84. | Mount Aetna | 38.6% | 23.6%(+15.0)#84 | 14.8%(+23.8)#1,533 |
| 85. | Colesville | 37.4% | 23.6%(+13.8)#85 | 14.8%(+22.6)#1,620 |
| 86. | Jessup | 37.4% | 23.6%(+13.8)#86 | 14.8%(+22.6)#1,621 |
| 87. | Deale | 37.4% | 23.6%(+13.8)#87 | 14.8%(+22.6)#1,623 |
| 88. | Cloverly | 37.3% | 23.6%(+13.7)#88 | 14.8%(+22.5)#1,628 |
| 89. | Mitchellville | 36.8% | 23.6%(+13.2)#89 | 14.8%(+22.0)#1,673 |
| 90. | Crofton | 36.7% | 23.6%(+13.1)#90 | 14.8%(+21.9)#1,682 |
| 91. | Gambrills | 36.2% | 23.6%(+12.6)#91 | 14.8%(+21.4)#1,727 |
| 92. | Parsonsburg | 35.9% | 23.6%(+12.3)#92 | 14.8%(+21.1)#1,760 |
| 93. | Crownsville | 35.6% | 23.6%(+12.0)#93 | 14.8%(+20.8)#1,783 |
| 94. | Eldersburg | 35.4% | 23.6%(+11.8)#94 | 14.8%(+20.6)#1,796 |
| 95. | Rosaryville | 35.2% | 23.6%(+11.6)#95 | 14.8%(+20.4)#1,817 |
| 96. | Croom | 35.1% | 23.6%(+11.5)#96 | 14.8%(+20.3)#1,834 |
| 97. | Honeygo | 34.9% | 23.6%(+11.3)#97 | 14.8%(+20.1)#1,850 |
| 98. | Parole | 34.7% | 23.6%(+11.1)#98 | 14.8%(+19.9)#1,866 |
| 99. | Glenn Dale | 34.6% | 23.6%(+11.0)#99 | 14.8%(+19.8)#1,874 |
| 100. | Mayo | 34.5% | 23.6%(+10.9)#100 | 14.8%(+19.7)#1,886 |
Common Questions
What are the Top 10 Cities with the Highest Percentage of Families with Income Above $200,000 in Maryland?
Top 10 Cities with the Highest Percentage of Families with Income Above $200,000 in Maryland are:
#1
100.0%
#2
100.0%
#3
84.7%
#4
83.7%
#5
81.3%
#6
80.3%
#7
79.3%
#8
78.9%
#9
75.7%
#10
74.7%
What city has the Highest Percentage of Families with Income Above $200,000 in Maryland?
West Denton has the Highest Percentage of Families with Income Above $200,000 in Maryland with 100.0%.
What is the Percentage of Families with Income Above $200,000 in the State of Maryland?
Percentage of Families with Income Above $200,000 in Maryland is 23.6%.
What is the Percentage of Families with Income Above $200,000 in the United States?
Percentage of Families with Income Above $200,000 in the United States is 14.8%.