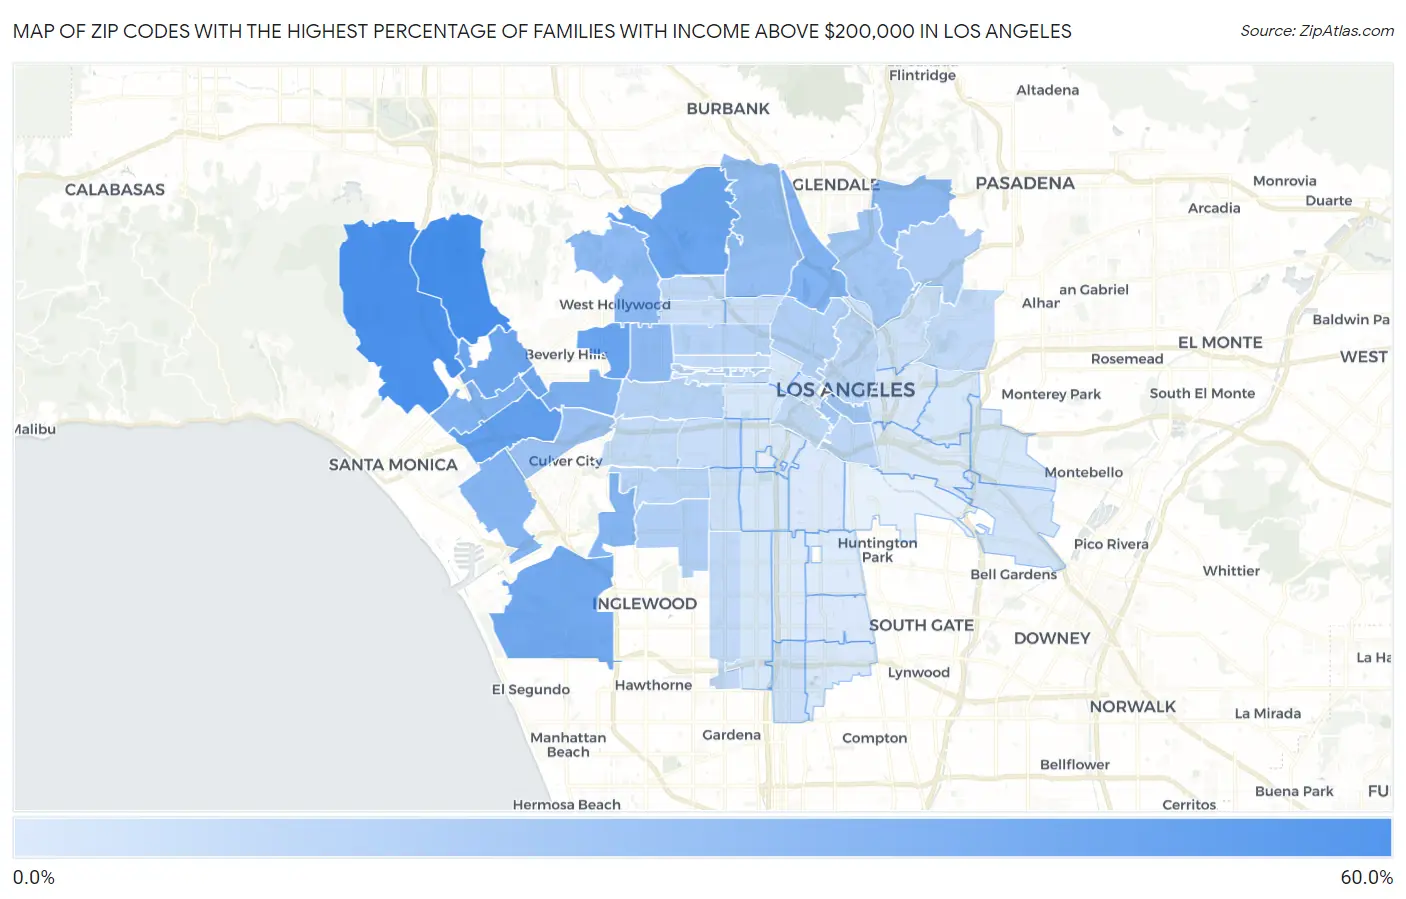
Zip Codes with the Highest Percentage of Families with Income Above $200,000 in Los Angeles, CA
RELATED REPORTS & OPTIONS
Family Income | $200k+
Los Angeles
Compare Zip Codes
Map of Zip Codes with the Highest Percentage of Families with Income Above $200,000 in Los Angeles
1.9%
58.9%

Zip Codes with the Highest Percentage of Families with Income Above $200,000 in Los Angeles, CA
| Zip Code | Families with Income > $200k | vs State | vs National | |
| 1. | 90077 | 58.9% | 21.1%(+37.8)#56 | 14.8%(+44.1)#325 |
| 2. | 90049 | 56.6% | 21.1%(+35.5)#75 | 14.8%(+41.8)#396 |
| 3. | 90064 | 46.3% | 21.1%(+25.2)#150 | 14.8%(+31.5)#849 |
| 4. | 90048 | 43.3% | 21.1%(+22.2)#170 | 14.8%(+28.5)#1,035 |
| 5. | 90068 | 42.2% | 21.1%(+21.1)#183 | 14.8%(+27.4)#1,122 |
| 6. | 90024 | 41.4% | 21.1%(+20.3)#193 | 14.8%(+26.6)#1,188 |
| 7. | 90067 | 41.0% | 21.1%(+19.9)#204 | 14.8%(+26.2)#1,230 |
| 8. | 90045 | 39.4% | 21.1%(+18.3)#234 | 14.8%(+24.6)#1,368 |
| 9. | 90035 | 35.2% | 21.1%(+14.1)#306 | 14.8%(+20.4)#1,819 |
| 10. | 90025 | 34.0% | 21.1%(+12.9)#330 | 14.8%(+19.2)#1,957 |
| 11. | 90039 | 33.8% | 21.1%(+12.7)#335 | 14.8%(+19.0)#1,987 |
| 12. | 90066 | 31.9% | 21.1%(+10.8)#365 | 14.8%(+17.1)#2,230 |
| 13. | 90056 | 31.9% | 21.1%(+10.8)#369 | 14.8%(+17.1)#2,243 |
| 14. | 90041 | 29.5% | 21.1%(+8.40)#416 | 14.8%(+14.7)#2,587 |
| 15. | 90036 | 28.7% | 21.1%(+7.60)#437 | 14.8%(+13.9)#2,729 |
| 16. | 90046 | 28.4% | 21.1%(+7.30)#446 | 14.8%(+13.6)#2,792 |
| 17. | 90027 | 27.2% | 21.1%(+6.10)#478 | 14.8%(+12.4)#3,012 |
| 18. | 90034 | 23.8% | 21.1%(+2.70)#556 | 14.8%(+9.00)#3,752 |
| 19. | 90013 | 22.5% | 21.1%(+1.40)#590 | 14.8%(+7.70)#4,083 |
| 20. | 90014 | 21.3% | 21.1%(+0.200)#620 | 14.8%(+6.50)#4,411 |
| 21. | 90065 | 20.9% | 21.1%(-0.200)#634 | 14.8%(+6.10)#4,523 |
| 22. | 90042 | 17.2% | 21.1%(-3.90)#751 | 14.8%(+2.40)#5,885 |
| 23. | 90010 | 15.9% | 21.1%(-5.20)#789 | 14.8%(+1.10)#6,508 |
| 24. | 90026 | 15.8% | 21.1%(-5.30)#792 | 14.8%(+1.000)#6,525 |
| 25. | 90043 | 15.8% | 21.1%(-5.30)#794 | 14.8%(+1.000)#6,528 |
| 26. | 90004 | 14.6% | 21.1%(-6.50)#843 | 14.8%(-0.200)#7,202 |
| 27. | 90019 | 14.3% | 21.1%(-6.80)#850 | 14.8%(-0.500)#7,362 |
| 28. | 90008 | 13.2% | 21.1%(-7.90)#888 | 14.8%(-1.60)#8,069 |
| 29. | 90021 | 12.4% | 21.1%(-8.70)#933 | 14.8%(-2.40)#8,682 |
| 30. | 90012 | 12.0% | 21.1%(-9.10)#958 | 14.8%(-2.80)#8,964 |
| 31. | 90015 | 11.5% | 21.1%(-9.60)#979 | 14.8%(-3.30)#9,352 |
| 32. | 90028 | 11.2% | 21.1%(-9.90)#995 | 14.8%(-3.60)#9,619 |
| 33. | 90032 | 10.9% | 21.1%(-10.2)#1,004 | 14.8%(-3.90)#9,890 |
| 34. | 90047 | 10.6% | 21.1%(-10.5)#1,028 | 14.8%(-4.20)#10,192 |
| 35. | 90016 | 9.9% | 21.1%(-11.2)#1,059 | 14.8%(-4.90)#10,891 |
| 36. | 90020 | 9.6% | 21.1%(-11.5)#1,088 | 14.8%(-5.20)#11,195 |
| 37. | 90005 | 9.6% | 21.1%(-11.5)#1,089 | 14.8%(-5.20)#11,197 |
| 38. | 90018 | 8.4% | 21.1%(-12.7)#1,158 | 14.8%(-6.40)#12,629 |
| 39. | 90029 | 8.3% | 21.1%(-12.8)#1,171 | 14.8%(-6.50)#12,767 |
| 40. | 90038 | 7.3% | 21.1%(-13.8)#1,215 | 14.8%(-7.50)#14,178 |
| 41. | 90031 | 7.1% | 21.1%(-14.0)#1,233 | 14.8%(-7.70)#14,468 |
| 42. | 90061 | 6.9% | 21.1%(-14.2)#1,242 | 14.8%(-7.90)#14,861 |
| 43. | 90062 | 6.8% | 21.1%(-14.3)#1,246 | 14.8%(-8.00)#15,019 |
| 44. | 90017 | 6.5% | 21.1%(-14.6)#1,264 | 14.8%(-8.30)#15,514 |
| 45. | 90040 | 5.5% | 21.1%(-15.6)#1,326 | 14.8%(-9.30)#17,439 |
| 46. | 90044 | 4.3% | 21.1%(-16.8)#1,383 | 14.8%(-10.5)#19,744 |
| 47. | 90022 | 4.0% | 21.1%(-17.1)#1,399 | 14.8%(-10.8)#20,383 |
| 48. | 90006 | 3.9% | 21.1%(-17.2)#1,407 | 14.8%(-10.9)#20,609 |
| 49. | 90037 | 3.8% | 21.1%(-17.3)#1,415 | 14.8%(-11.0)#20,821 |
| 50. | 90063 | 3.8% | 21.1%(-17.3)#1,417 | 14.8%(-11.0)#20,825 |
| 51. | 90007 | 3.4% | 21.1%(-17.7)#1,431 | 14.8%(-11.4)#21,650 |
| 52. | 90057 | 3.1% | 21.1%(-18.0)#1,453 | 14.8%(-11.7)#22,240 |
| 53. | 90059 | 3.1% | 21.1%(-18.0)#1,454 | 14.8%(-11.7)#22,252 |
| 54. | 90011 | 2.8% | 21.1%(-18.3)#1,466 | 14.8%(-12.0)#22,875 |
| 55. | 90002 | 2.8% | 21.1%(-18.3)#1,467 | 14.8%(-12.0)#22,876 |
| 56. | 90033 | 2.4% | 21.1%(-18.7)#1,484 | 14.8%(-12.4)#23,685 |
| 57. | 90003 | 2.2% | 21.1%(-18.9)#1,493 | 14.8%(-12.6)#24,069 |
| 58. | 90001 | 2.2% | 21.1%(-18.9)#1,494 | 14.8%(-12.6)#24,070 |
| 59. | 90023 | 1.9% | 21.1%(-19.2)#1,505 | 14.8%(-12.9)#24,615 |
1
Common Questions
What are the Top 10 Zip Codes with the Highest Percentage of Families with Income Above $200,000 in Los Angeles, CA?
Top 10 Zip Codes with the Highest Percentage of Families with Income Above $200,000 in Los Angeles, CA are:
What zip code has the Highest Percentage of Families with Income Above $200,000 in Los Angeles, CA?
90077 has the Highest Percentage of Families with Income Above $200,000 in Los Angeles, CA with 58.9%.
What is the Percentage of Families with Income Above $200,000 in Los Angeles, CA?
Percentage of Families with Income Above $200,000 in Los Angeles is 17.5%.
What is the Percentage of Families with Income Above $200,000 in California?
Percentage of Families with Income Above $200,000 in California is 21.1%.
What is the Percentage of Families with Income Above $200,000 in the United States?
Percentage of Families with Income Above $200,000 in the United States is 14.8%.