Cities with the Highest Percentage of Families with Income Above $200,000 in Minnesota
RELATED REPORTS & OPTIONS
Family Income | $200k+
Minnesota
Compare Cities
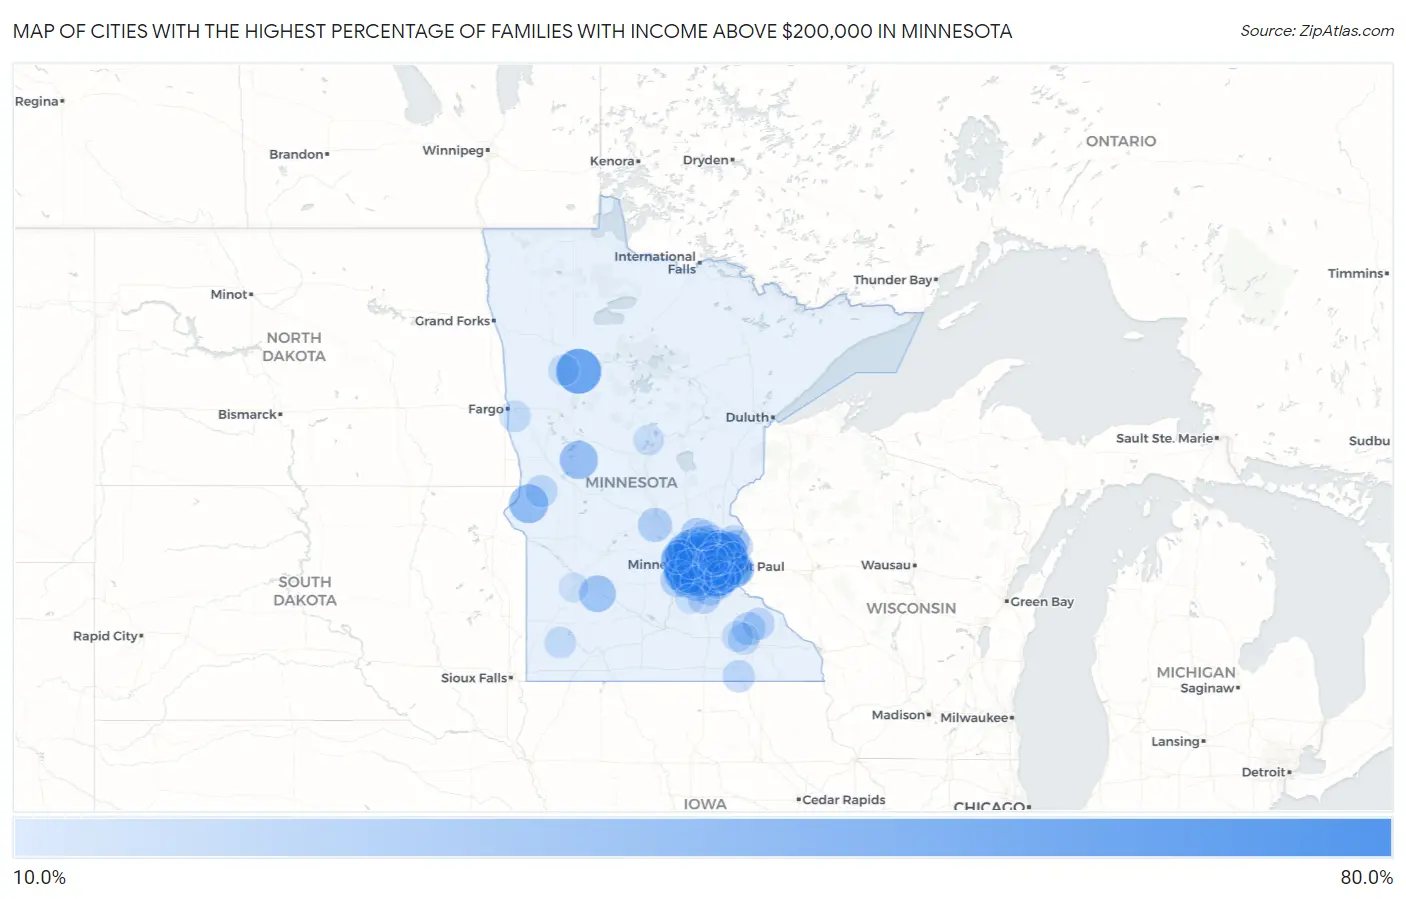
Map of Cities with the Highest Percentage of Families with Income Above $200,000 in Minnesota
0.0%
80.0%
Cities with the Highest Percentage of Families with Income Above $200,000 in Minnesota
| City | Families with Income > $200k | vs State | vs National | |
| 1. | Minnetonka Beach | 70.9% | 16.5%(+54.4)#1 | 14.8%(+56.1)#170 |
| 2. | Sunfish Lake | 65.0% | 16.5%(+48.5)#2 | 14.8%(+50.2)#264 |
| 3. | North Oaks | 63.7% | 16.5%(+47.2)#3 | 14.8%(+48.9)#296 |
| 4. | Medina | 59.2% | 16.5%(+42.7)#4 | 14.8%(+44.4)#426 |
| 5. | Greenwood | 58.6% | 16.5%(+42.1)#5 | 14.8%(+43.8)#446 |
| 6. | Dellwood | 58.4% | 16.5%(+41.9)#6 | 14.8%(+43.6)#458 |
| 7. | Roy Lake | 58.3% | 16.5%(+41.8)#7 | 14.8%(+43.5)#464 |
| 8. | Medicine Lake | 57.6% | 16.5%(+41.1)#8 | 14.8%(+42.8)#484 |
| 9. | Woodland | 54.7% | 16.5%(+38.2)#9 | 14.8%(+39.9)#592 |
| 10. | Independence | 53.1% | 16.5%(+36.6)#10 | 14.8%(+38.3)#657 |
| 11. | Deephaven | 52.1% | 16.5%(+35.6)#11 | 14.8%(+37.3)#704 |
| 12. | Orono | 51.4% | 16.5%(+34.9)#12 | 14.8%(+36.6)#735 |
| 13. | Shorewood | 50.2% | 16.5%(+33.7)#13 | 14.8%(+35.4)#776 |
| 14. | St. John's University | 50.0% | 16.5%(+33.5)#14 | 14.8%(+35.2)#784 |
| 15. | Marion | 49.5% | 16.5%(+33.0)#15 | 14.8%(+34.7)#819 |
| 16. | Victoria | 48.3% | 16.5%(+31.8)#16 | 14.8%(+33.5)#869 |
| 17. | Edina | 46.7% | 16.5%(+30.2)#17 | 14.8%(+31.9)#950 |
| 18. | Lake Elmo | 46.6% | 16.5%(+30.1)#18 | 14.8%(+31.8)#958 |
| 19. | Credit River | 45.3% | 16.5%(+28.8)#19 | 14.8%(+30.5)#1,034 |
| 20. | Wayzata | 45.3% | 16.5%(+28.8)#20 | 14.8%(+30.5)#1,035 |
| 21. | Tonka Bay | 42.5% | 16.5%(+26.0)#21 | 14.8%(+27.7)#1,214 |
| 22. | Pine Springs | 42.4% | 16.5%(+25.9)#22 | 14.8%(+27.6)#1,225 |
| 23. | Chanhassen | 42.3% | 16.5%(+25.8)#23 | 14.8%(+27.5)#1,229 |
| 24. | Dumont | 42.3% | 16.5%(+25.8)#24 | 14.8%(+27.5)#1,237 |
| 25. | Minnetrista | 40.6% | 16.5%(+24.1)#25 | 14.8%(+25.8)#1,355 |
| 26. | Plymouth | 40.2% | 16.5%(+23.7)#26 | 14.8%(+25.4)#1,388 |
| 27. | Vining | 40.0% | 16.5%(+23.5)#27 | 14.8%(+25.2)#1,414 |
| 28. | Grant | 39.8% | 16.5%(+23.3)#28 | 14.8%(+25.0)#1,433 |
| 29. | Mendota Heights | 39.0% | 16.5%(+22.5)#29 | 14.8%(+24.2)#1,500 |
| 30. | Dayton | 38.4% | 16.5%(+21.9)#30 | 14.8%(+23.6)#1,551 |
| 31. | Mahtomedi | 37.8% | 16.5%(+21.3)#31 | 14.8%(+23.0)#1,592 |
| 32. | Eden Prairie | 36.7% | 16.5%(+20.2)#32 | 14.8%(+21.9)#1,681 |
| 33. | Delhi | 36.4% | 16.5%(+19.9)#33 | 14.8%(+21.6)#1,718 |
| 34. | Afton | 35.3% | 16.5%(+18.8)#34 | 14.8%(+20.5)#1,810 |
| 35. | St Marys Point | 35.0% | 16.5%(+18.5)#35 | 14.8%(+20.2)#1,846 |
| 36. | Loretto | 34.2% | 16.5%(+17.7)#36 | 14.8%(+19.4)#1,927 |
| 37. | Prior Lake | 32.6% | 16.5%(+16.1)#37 | 14.8%(+17.8)#2,074 |
| 38. | Greenfield | 32.6% | 16.5%(+16.1)#38 | 14.8%(+17.8)#2,081 |
| 39. | Minnetonka | 32.4% | 16.5%(+15.9)#39 | 14.8%(+17.6)#2,100 |
| 40. | St Anthony City Hennepin And Ramsey Counties | 32.4% | 16.5%(+15.9)#40 | 14.8%(+17.6)#2,104 |
| 41. | Golden Valley | 31.8% | 16.5%(+15.3)#41 | 14.8%(+17.0)#2,172 |
| 42. | Maple Grove | 31.7% | 16.5%(+15.2)#42 | 14.8%(+16.9)#2,185 |
| 43. | Corcoran | 31.3% | 16.5%(+14.8)#43 | 14.8%(+16.5)#2,222 |
| 44. | Hanover | 30.9% | 16.5%(+14.4)#44 | 14.8%(+16.1)#2,262 |
| 45. | Gem Lake | 30.8% | 16.5%(+14.3)#45 | 14.8%(+16.0)#2,277 |
| 46. | Nowthen | 29.7% | 16.5%(+13.2)#46 | 14.8%(+14.9)#2,407 |
| 47. | Excelsior | 29.6% | 16.5%(+13.1)#47 | 14.8%(+14.8)#2,421 |
| 48. | Cologne | 29.6% | 16.5%(+13.1)#48 | 14.8%(+14.8)#2,422 |
| 49. | St Augusta | 29.5% | 16.5%(+13.0)#49 | 14.8%(+14.7)#2,433 |
| 50. | Woodbury | 29.4% | 16.5%(+12.9)#50 | 14.8%(+14.6)#2,437 |
| 51. | Rogers | 28.7% | 16.5%(+12.2)#51 | 14.8%(+13.9)#2,541 |
| 52. | Savage | 28.5% | 16.5%(+12.0)#52 | 14.8%(+13.7)#2,580 |
| 53. | Lakeville | 28.2% | 16.5%(+11.7)#53 | 14.8%(+13.4)#2,620 |
| 54. | Oronoco | 27.7% | 16.5%(+11.2)#54 | 14.8%(+12.9)#2,711 |
| 55. | Mound | 27.5% | 16.5%(+11.0)#55 | 14.8%(+12.7)#2,732 |
| 56. | Ham Lake | 27.3% | 16.5%(+10.8)#56 | 14.8%(+12.5)#2,765 |
| 57. | Centerville | 27.2% | 16.5%(+10.7)#57 | 14.8%(+12.4)#2,783 |
| 58. | Marine On St Croix | 27.2% | 16.5%(+10.7)#58 | 14.8%(+12.4)#2,790 |
| 59. | Rosemount | 27.1% | 16.5%(+10.6)#59 | 14.8%(+12.3)#2,794 |
| 60. | Carver | 27.0% | 16.5%(+10.5)#60 | 14.8%(+12.2)#2,811 |
| 61. | Vadnais Heights | 26.9% | 16.5%(+10.4)#61 | 14.8%(+12.1)#2,826 |
| 62. | Birchwood Village | 26.3% | 16.5%(+9.80)#62 | 14.8%(+11.5)#2,903 |
| 63. | St Louis Park | 26.2% | 16.5%(+9.70)#63 | 14.8%(+11.4)#2,909 |
| 64. | Eagan | 26.1% | 16.5%(+9.60)#64 | 14.8%(+11.3)#2,924 |
| 65. | Elko New Market | 25.8% | 16.5%(+9.30)#65 | 14.8%(+11.0)#2,987 |
| 66. | Arden Hills | 25.7% | 16.5%(+9.20)#66 | 14.8%(+10.9)#2,999 |
| 67. | Shoreview | 25.6% | 16.5%(+9.10)#67 | 14.8%(+10.8)#3,009 |
| 68. | Lake St Croix Beach | 25.5% | 16.5%(+9.00)#68 | 14.8%(+10.7)#3,032 |
| 69. | Norcross | 25.0% | 16.5%(+8.50)#69 | 14.8%(+10.2)#3,120 |
| 70. | Hugo | 24.9% | 16.5%(+8.40)#70 | 14.8%(+10.1)#3,137 |
| 71. | Adams | 24.9% | 16.5%(+8.40)#71 | 14.8%(+10.1)#3,145 |
| 72. | Scandia | 24.4% | 16.5%(+7.90)#72 | 14.8%(+9.60)#3,218 |
| 73. | Lino Lakes | 24.3% | 16.5%(+7.80)#73 | 14.8%(+9.50)#3,233 |
| 74. | Hammond | 24.3% | 16.5%(+7.80)#74 | 14.8%(+9.50)#3,245 |
| 75. | Byron | 23.7% | 16.5%(+7.20)#75 | 14.8%(+8.90)#3,344 |
| 76. | Hadley | 23.1% | 16.5%(+6.60)#76 | 14.8%(+8.30)#3,446 |
| 77. | Sabin | 23.0% | 16.5%(+6.50)#77 | 14.8%(+8.20)#3,468 |
| 78. | Lilydale | 22.8% | 16.5%(+6.30)#78 | 14.8%(+8.00)#3,507 |
| 79. | Mantorville | 22.7% | 16.5%(+6.20)#79 | 14.8%(+7.90)#3,531 |
| 80. | Chaska | 22.2% | 16.5%(+5.70)#80 | 14.8%(+7.40)#3,620 |
| 81. | Mendota | 22.2% | 16.5%(+5.70)#81 | 14.8%(+7.40)#3,633 |
| 82. | Beaulieu | 22.2% | 16.5%(+5.70)#82 | 14.8%(+7.40)#3,642 |
| 83. | Andover | 22.0% | 16.5%(+5.50)#83 | 14.8%(+7.20)#3,666 |
| 84. | Rockford | 22.0% | 16.5%(+5.50)#84 | 14.8%(+7.20)#3,676 |
| 85. | Waconia | 21.8% | 16.5%(+5.30)#85 | 14.8%(+7.00)#3,719 |
| 86. | Nisswa | 21.3% | 16.5%(+4.80)#86 | 14.8%(+6.50)#3,815 |
| 87. | Champlin | 21.2% | 16.5%(+4.70)#87 | 14.8%(+6.40)#3,829 |
| 88. | Minneapolis | 21.0% | 16.5%(+4.50)#88 | 14.8%(+6.20)#3,879 |
| 89. | Shakopee | 20.7% | 16.5%(+4.20)#89 | 14.8%(+5.90)#3,941 |
| 90. | New Brighton | 20.7% | 16.5%(+4.20)#90 | 14.8%(+5.90)#3,943 |
| 91. | Delano | 20.6% | 16.5%(+4.10)#91 | 14.8%(+5.80)#3,969 |
| 92. | Inver Grove Heights | 20.5% | 16.5%(+4.00)#92 | 14.8%(+5.70)#3,981 |
| 93. | Stillwater | 20.2% | 16.5%(+3.70)#93 | 14.8%(+5.40)#4,063 |
| 94. | Long Lake | 20.0% | 16.5%(+3.50)#94 | 14.8%(+5.20)#4,120 |
| 95. | Cottage Grove | 19.8% | 16.5%(+3.30)#95 | 14.8%(+5.00)#4,166 |
| 96. | Little Canada | 19.8% | 16.5%(+3.30)#96 | 14.8%(+5.00)#4,171 |
| 97. | Oak Grove | 19.8% | 16.5%(+3.30)#97 | 14.8%(+5.00)#4,172 |
| 98. | New Prague | 19.7% | 16.5%(+3.20)#98 | 14.8%(+4.90)#4,191 |
| 99. | Roseville | 19.4% | 16.5%(+2.90)#99 | 14.8%(+4.60)#4,247 |
| 100. | Hanley Falls | 19.3% | 16.5%(+2.80)#100 | 14.8%(+4.50)#4,289 |
Common Questions
What are the Top 10 Cities with the Highest Percentage of Families with Income Above $200,000 in Minnesota?
Top 10 Cities with the Highest Percentage of Families with Income Above $200,000 in Minnesota are:
#1
70.9%
#2
65.0%
#3
63.7%
#4
59.2%
#5
58.6%
#6
58.4%
#7
58.3%
#8
57.6%
#9
54.7%
#10
53.1%
What city has the Highest Percentage of Families with Income Above $200,000 in Minnesota?
Minnetonka Beach has the Highest Percentage of Families with Income Above $200,000 in Minnesota with 70.9%.
What is the Percentage of Families with Income Above $200,000 in the State of Minnesota?
Percentage of Families with Income Above $200,000 in Minnesota is 16.5%.
What is the Percentage of Families with Income Above $200,000 in the United States?
Percentage of Families with Income Above $200,000 in the United States is 14.8%.