Cities with the Highest Percentage of Families with Income Above $200,000 in Illinois
RELATED REPORTS & OPTIONS
Family Income | $200k+
Illinois
Compare Cities
Map of Cities with the Highest Percentage of Families with Income Above $200,000 in Illinois
0.0%
100.0%
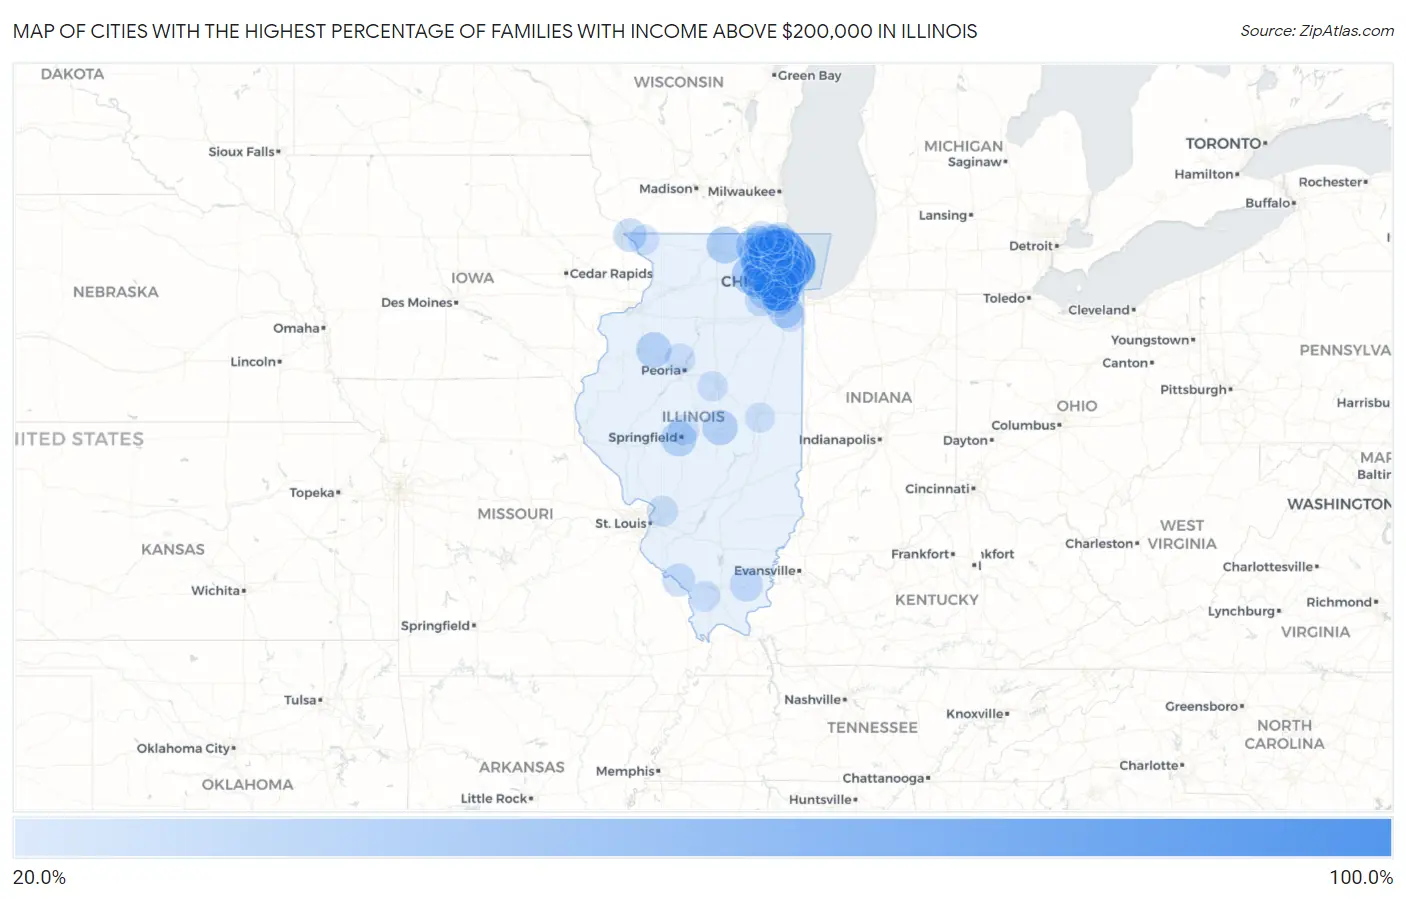
Cities with the Highest Percentage of Families with Income Above $200,000 in Illinois
| City | Families with Income > $200k | vs State | vs National | |
| 1. | Triumph | 100.0% | 16.3%(+83.7)#1 | 14.8%(+85.2)#20 |
| 2. | East Lynn | 85.3% | 16.3%(+69.0)#2 | 14.8%(+70.5)#65 |
| 3. | Plum Valley | 73.4% | 16.3%(+57.1)#3 | 14.8%(+58.6)#134 |
| 4. | Winnetka | 72.0% | 16.3%(+55.7)#4 | 14.8%(+57.2)#151 |
| 5. | Kildeer | 71.9% | 16.3%(+55.6)#5 | 14.8%(+57.1)#153 |
| 6. | Golf | 71.3% | 16.3%(+55.0)#6 | 14.8%(+56.5)#164 |
| 7. | Kenilworth | 71.1% | 16.3%(+54.8)#7 | 14.8%(+56.3)#166 |
| 8. | Hinsdale | 65.6% | 16.3%(+49.3)#8 | 14.8%(+50.8)#253 |
| 9. | Riverwoods | 61.5% | 16.3%(+45.2)#9 | 14.8%(+46.7)#355 |
| 10. | Glencoe | 61.4% | 16.3%(+45.1)#10 | 14.8%(+46.6)#362 |
| 11. | Inverness | 60.4% | 16.3%(+44.1)#11 | 14.8%(+45.6)#396 |
| 12. | Hawthorn Woods | 59.8% | 16.3%(+43.5)#12 | 14.8%(+45.0)#414 |
| 13. | Lake Forest | 59.7% | 16.3%(+43.4)#13 | 14.8%(+44.9)#415 |
| 14. | Long Grove | 58.2% | 16.3%(+41.9)#14 | 14.8%(+43.4)#466 |
| 15. | Wilmette | 57.0% | 16.3%(+40.7)#15 | 14.8%(+42.2)#507 |
| 16. | Western Springs | 55.4% | 16.3%(+39.1)#16 | 14.8%(+40.6)#563 |
| 17. | North Barrington | 55.3% | 16.3%(+39.0)#17 | 14.8%(+40.5)#567 |
| 18. | River Forest | 54.8% | 16.3%(+38.5)#18 | 14.8%(+40.0)#586 |
| 19. | South Barrington | 54.4% | 16.3%(+38.1)#19 | 14.8%(+39.6)#602 |
| 20. | Lincolnshire | 53.8% | 16.3%(+37.5)#20 | 14.8%(+39.0)#628 |
| 21. | Trout Valley | 53.4% | 16.3%(+37.1)#21 | 14.8%(+38.6)#647 |
| 22. | Green Oaks | 52.8% | 16.3%(+36.5)#22 | 14.8%(+38.0)#673 |
| 23. | Deerfield | 52.6% | 16.3%(+36.3)#23 | 14.8%(+37.8)#685 |
| 24. | Burr Ridge | 52.4% | 16.3%(+36.1)#24 | 14.8%(+37.6)#691 |
| 25. | Lake Bluff | 52.4% | 16.3%(+36.1)#25 | 14.8%(+37.6)#692 |
| 26. | Northfield | 51.9% | 16.3%(+35.6)#26 | 14.8%(+37.1)#708 |
| 27. | Highland Park | 51.7% | 16.3%(+35.4)#27 | 14.8%(+36.9)#715 |
| 28. | Northbrook | 51.2% | 16.3%(+34.9)#28 | 14.8%(+36.4)#742 |
| 29. | Libertyville | 50.8% | 16.3%(+34.5)#29 | 14.8%(+36.0)#754 |
| 30. | Barrington Hills | 50.4% | 16.3%(+34.1)#30 | 14.8%(+35.6)#766 |
| 31. | Deer Park | 49.2% | 16.3%(+32.9)#31 | 14.8%(+34.4)#828 |
| 32. | Barrington | 49.1% | 16.3%(+32.8)#32 | 14.8%(+34.3)#832 |
| 33. | Argyle | 49.1% | 16.3%(+32.8)#33 | 14.8%(+34.3)#837 |
| 34. | Bannockburn | 48.7% | 16.3%(+32.4)#34 | 14.8%(+33.9)#858 |
| 35. | Campton Hills | 47.3% | 16.3%(+31.0)#35 | 14.8%(+32.5)#915 |
| 36. | Lake Barrington | 47.3% | 16.3%(+31.0)#36 | 14.8%(+32.5)#916 |
| 37. | Oak Brook | 46.3% | 16.3%(+30.0)#37 | 14.8%(+31.5)#979 |
| 38. | Clarendon Hills | 45.9% | 16.3%(+29.6)#38 | 14.8%(+31.1)#997 |
| 39. | Glen Ellyn | 44.2% | 16.3%(+27.9)#39 | 14.8%(+29.4)#1,082 |
| 40. | Elmhurst | 43.7% | 16.3%(+27.4)#40 | 14.8%(+28.9)#1,118 |
| 41. | Park Ridge | 43.4% | 16.3%(+27.1)#41 | 14.8%(+28.6)#1,146 |
| 42. | La Grange | 43.4% | 16.3%(+27.1)#42 | 14.8%(+28.6)#1,149 |
| 43. | Timberlane | 42.7% | 16.3%(+26.4)#43 | 14.8%(+27.9)#1,198 |
| 44. | Baileyville | 42.3% | 16.3%(+26.0)#44 | 14.8%(+27.5)#1,238 |
| 45. | Glenview | 41.7% | 16.3%(+25.4)#45 | 14.8%(+26.9)#1,281 |
| 46. | Indian Head Park | 41.3% | 16.3%(+25.0)#46 | 14.8%(+26.5)#1,308 |
| 47. | Mettawa | 40.6% | 16.3%(+24.3)#47 | 14.8%(+25.8)#1,362 |
| 48. | Naperville | 40.3% | 16.3%(+24.0)#48 | 14.8%(+25.5)#1,380 |
| 49. | Bull Valley | 40.2% | 16.3%(+23.9)#49 | 14.8%(+25.4)#1,395 |
| 50. | Frankfort | 39.5% | 16.3%(+23.2)#50 | 14.8%(+24.7)#1,454 |
| 51. | Oak Run | 39.1% | 16.3%(+22.8)#51 | 14.8%(+24.3)#1,494 |
| 52. | Riverside | 38.9% | 16.3%(+22.6)#52 | 14.8%(+24.1)#1,507 |
| 53. | Palos Park | 38.9% | 16.3%(+22.6)#53 | 14.8%(+24.1)#1,509 |
| 54. | Leland Grove | 38.6% | 16.3%(+22.3)#54 | 14.8%(+23.8)#1,529 |
| 55. | Forsyth | 38.4% | 16.3%(+22.1)#55 | 14.8%(+23.6)#1,552 |
| 56. | Tower Lakes | 37.3% | 16.3%(+21.0)#56 | 14.8%(+22.5)#1,632 |
| 57. | Oak Park | 36.6% | 16.3%(+20.3)#57 | 14.8%(+21.8)#1,694 |
| 58. | Geneva | 35.8% | 16.3%(+19.5)#58 | 14.8%(+21.0)#1,762 |
| 59. | Grandwood Park | 35.2% | 16.3%(+18.9)#59 | 14.8%(+20.4)#1,819 |
| 60. | Evanston | 35.1% | 16.3%(+18.8)#60 | 14.8%(+20.3)#1,829 |
| 61. | Indian Creek | 34.6% | 16.3%(+18.3)#61 | 14.8%(+19.8)#1,880 |
| 62. | Downers Grove | 34.4% | 16.3%(+18.1)#62 | 14.8%(+19.6)#1,898 |
| 63. | Menominee | 34.0% | 16.3%(+17.7)#63 | 14.8%(+19.2)#1,941 |
| 64. | Wayne | 33.9% | 16.3%(+17.6)#64 | 14.8%(+19.1)#1,944 |
| 65. | Third Lake | 33.8% | 16.3%(+17.5)#65 | 14.8%(+19.0)#1,959 |
| 66. | Muddy | 33.3% | 16.3%(+17.0)#66 | 14.8%(+18.5)#2,015 |
| 67. | Rockwood | 33.3% | 16.3%(+17.0)#67 | 14.8%(+18.5)#2,018 |
| 68. | Sleepy Hollow | 33.1% | 16.3%(+16.8)#68 | 14.8%(+18.3)#2,037 |
| 69. | Plainfield | 32.7% | 16.3%(+16.4)#69 | 14.8%(+17.9)#2,062 |
| 70. | Prairie Grove | 32.6% | 16.3%(+16.3)#70 | 14.8%(+17.8)#2,082 |
| 71. | Knollwood | 32.6% | 16.3%(+16.3)#71 | 14.8%(+17.8)#2,084 |
| 72. | Lake Zurich | 32.3% | 16.3%(+16.0)#72 | 14.8%(+17.5)#2,116 |
| 73. | Winfield | 31.6% | 16.3%(+15.3)#73 | 14.8%(+16.8)#2,190 |
| 74. | Wheaton | 31.1% | 16.3%(+14.8)#74 | 14.8%(+16.3)#2,240 |
| 75. | Lisle | 30.6% | 16.3%(+14.3)#75 | 14.8%(+15.8)#2,293 |
| 76. | Vernon Hills | 30.4% | 16.3%(+14.1)#76 | 14.8%(+15.6)#2,317 |
| 77. | Batavia | 29.6% | 16.3%(+13.3)#77 | 14.8%(+14.8)#2,415 |
| 78. | Port Barrington | 29.6% | 16.3%(+13.3)#78 | 14.8%(+14.8)#2,423 |
| 79. | Arlington Heights | 29.5% | 16.3%(+13.2)#79 | 14.8%(+14.7)#2,427 |
| 80. | La Grange Park | 29.4% | 16.3%(+13.1)#80 | 14.8%(+14.6)#2,441 |
| 81. | Sherman | 29.1% | 16.3%(+12.8)#81 | 14.8%(+14.3)#2,488 |
| 82. | Lincolnwood | 29.0% | 16.3%(+12.7)#82 | 14.8%(+14.2)#2,496 |
| 83. | Buffalo Grove | 28.9% | 16.3%(+12.6)#83 | 14.8%(+14.1)#2,505 |
| 84. | Gurnee | 28.9% | 16.3%(+12.6)#84 | 14.8%(+14.1)#2,507 |
| 85. | Ringwood | 28.8% | 16.3%(+12.5)#85 | 14.8%(+14.0)#2,534 |
| 86. | Edwardsville | 28.7% | 16.3%(+12.4)#86 | 14.8%(+13.9)#2,540 |
| 87. | Monee | 28.5% | 16.3%(+12.2)#87 | 14.8%(+13.7)#2,585 |
| 88. | Grayslake | 28.3% | 16.3%(+12.0)#88 | 14.8%(+13.5)#2,605 |
| 89. | The Galena Territory | 28.3% | 16.3%(+12.0)#89 | 14.8%(+13.5)#2,613 |
| 90. | Dunlap | 28.0% | 16.3%(+11.7)#90 | 14.8%(+13.2)#2,659 |
| 91. | Makanda | 28.0% | 16.3%(+11.7)#91 | 14.8%(+13.2)#2,662 |
| 92. | Spring Grove | 27.9% | 16.3%(+11.6)#92 | 14.8%(+13.1)#2,672 |
| 93. | Wadsworth | 27.9% | 16.3%(+11.6)#93 | 14.8%(+13.1)#2,676 |
| 94. | Homer Glen | 27.8% | 16.3%(+11.5)#94 | 14.8%(+13.0)#2,684 |
| 95. | Twin Grove | 27.4% | 16.3%(+11.1)#95 | 14.8%(+12.6)#2,757 |
| 96. | Lemont | 27.2% | 16.3%(+10.9)#96 | 14.8%(+12.4)#2,781 |
| 97. | Johnsburg | 27.2% | 16.3%(+10.9)#97 | 14.8%(+12.4)#2,782 |
| 98. | Lake Villa | 26.8% | 16.3%(+10.5)#98 | 14.8%(+12.0)#2,840 |
| 99. | St Charles | 26.7% | 16.3%(+10.4)#99 | 14.8%(+11.9)#2,853 |
| 100. | Savoy | 26.7% | 16.3%(+10.4)#100 | 14.8%(+11.9)#2,855 |
Common Questions
What are the Top 10 Cities with the Highest Percentage of Families with Income Above $200,000 in Illinois?
Top 10 Cities with the Highest Percentage of Families with Income Above $200,000 in Illinois are:
#1
72.0%
#2
71.9%
#3
71.3%
#4
71.1%
#5
65.6%
#6
61.5%
#7
61.4%
#8
60.4%
#9
59.8%
#10
59.7%
What city has the Highest Percentage of Families with Income Above $200,000 in Illinois?
Winnetka has the Highest Percentage of Families with Income Above $200,000 in Illinois with 72.0%.
What is the Percentage of Families with Income Above $200,000 in the State of Illinois?
Percentage of Families with Income Above $200,000 in Illinois is 16.3%.
What is the Percentage of Families with Income Above $200,000 in the United States?
Percentage of Families with Income Above $200,000 in the United States is 14.8%.