Cities with the Highest Percentage of Families with Income Above $200,000 in Alabama
RELATED REPORTS & OPTIONS
Family Income | $200k+
Alabama
Compare Cities
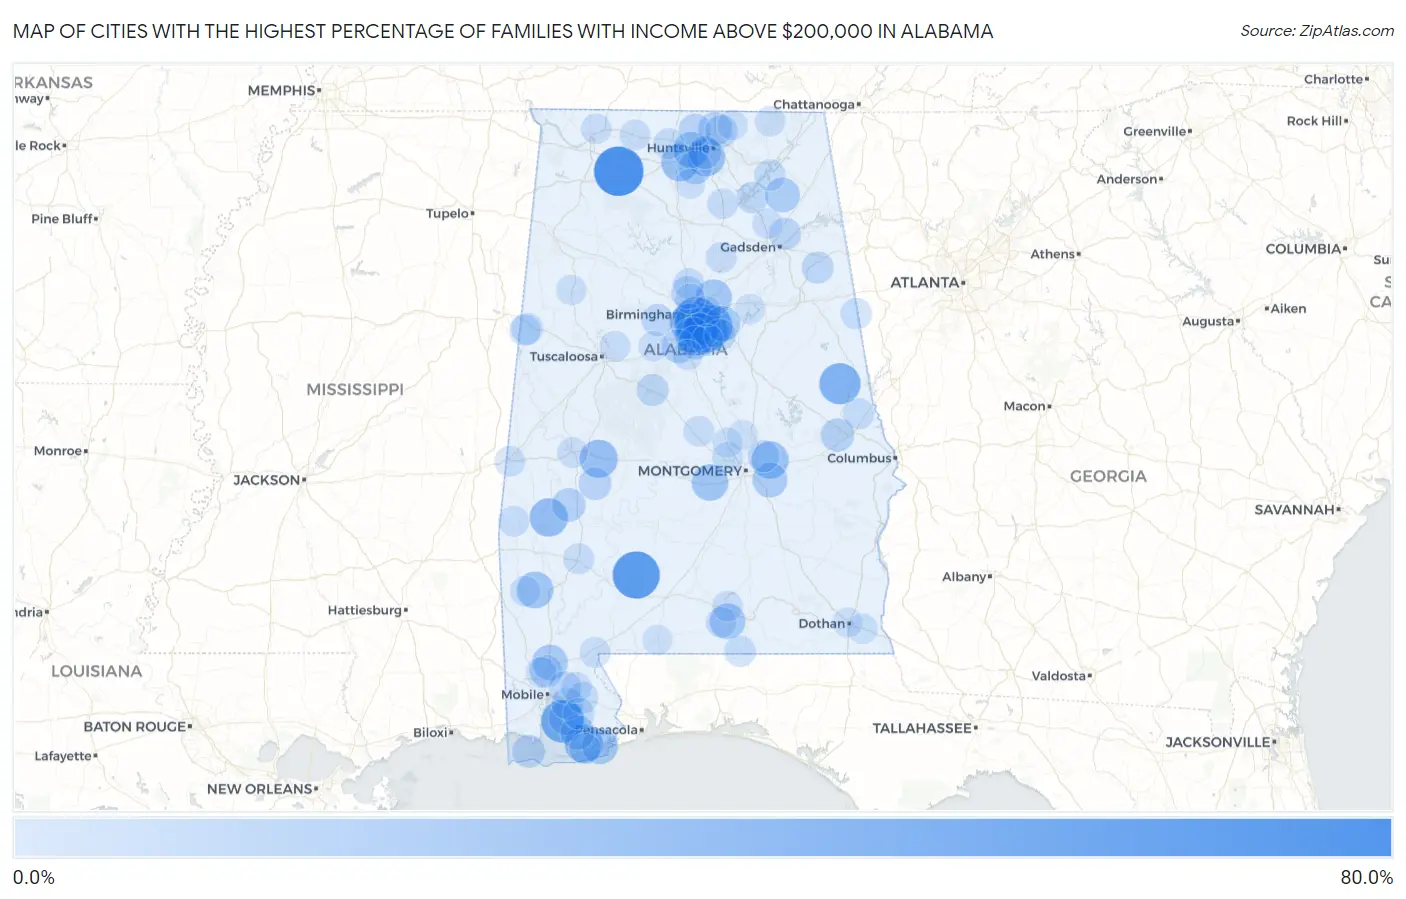
Map of Cities with the Highest Percentage of Families with Income Above $200,000 in Alabama
0.0%
80.0%
Cities with the Highest Percentage of Families with Income Above $200,000 in Alabama
| City | Families with Income > $200k | vs State | vs National | |
| 1. | Hatton | 64.1% | 9.0%(+55.1)#1 | 14.8%(+49.3)#288 |
| 2. | Peterman | 57.1% | 9.0%(+48.1)#2 | 14.8%(+42.3)#506 |
| 3. | Mountain Brook | 51.8% | 9.0%(+42.8)#3 | 14.8%(+37.0)#712 |
| 4. | Point Clear | 44.2% | 9.0%(+35.2)#4 | 14.8%(+29.4)#1,086 |
| 5. | Highland Lakes | 43.7% | 9.0%(+34.7)#5 | 14.8%(+28.9)#1,123 |
| 6. | Shoal Creek | 43.6% | 9.0%(+34.6)#6 | 14.8%(+28.8)#1,135 |
| 7. | Vestavia Hills | 40.6% | 9.0%(+31.6)#7 | 14.8%(+25.8)#1,352 |
| 8. | Penton | 40.0% | 9.0%(+31.0)#8 | 14.8%(+25.2)#1,416 |
| 9. | Eagle Point | 32.2% | 9.0%(+23.2)#9 | 14.8%(+17.4)#2,133 |
| 10. | Indian Springs Village | 31.5% | 9.0%(+22.5)#10 | 14.8%(+16.7)#2,205 |
| 11. | Bon Secour | 31.4% | 9.0%(+22.4)#11 | 14.8%(+16.6)#2,214 |
| 12. | Putnam | 31.3% | 9.0%(+22.3)#12 | 14.8%(+16.5)#2,232 |
| 13. | Faunsdale | 30.8% | 9.0%(+21.8)#13 | 14.8%(+16.0)#2,281 |
| 14. | Homewood | 30.3% | 9.0%(+21.3)#14 | 14.8%(+15.5)#2,329 |
| 15. | Redstone Arsenal | 29.6% | 9.0%(+20.6)#15 | 14.8%(+14.8)#2,426 |
| 16. | Mooresville | 29.4% | 9.0%(+20.4)#16 | 14.8%(+14.6)#2,458 |
| 17. | Equality | 29.2% | 9.0%(+20.2)#17 | 14.8%(+14.4)#2,484 |
| 18. | Brook Highland | 29.0% | 9.0%(+20.0)#18 | 14.8%(+14.2)#2,497 |
| 19. | Emerald Mountain | 28.6% | 9.0%(+19.6)#19 | 14.8%(+13.8)#2,561 |
| 20. | Hobson | 27.0% | 9.0%(+18.0)#20 | 14.8%(+12.2)#2,819 |
| 21. | Meadowbrook | 26.5% | 9.0%(+17.5)#21 | 14.8%(+11.7)#2,878 |
| 22. | Lowndesboro | 26.5% | 9.0%(+17.5)#22 | 14.8%(+11.7)#2,882 |
| 23. | Trussville | 25.2% | 9.0%(+16.2)#23 | 14.8%(+10.4)#3,069 |
| 24. | Madison | 24.7% | 9.0%(+15.7)#24 | 14.8%(+9.90)#3,167 |
| 25. | Orange Beach | 24.3% | 9.0%(+15.3)#25 | 14.8%(+9.50)#3,235 |
| 26. | Libertyville | 24.2% | 9.0%(+15.2)#26 | 14.8%(+9.40)#3,259 |
| 27. | Hoover | 23.8% | 9.0%(+14.8)#27 | 14.8%(+9.00)#3,313 |
| 28. | Axis | 23.6% | 9.0%(+14.6)#28 | 14.8%(+8.80)#3,369 |
| 29. | Vandiver | 22.9% | 9.0%(+13.9)#29 | 14.8%(+8.10)#3,482 |
| 30. | Fairhope | 22.4% | 9.0%(+13.4)#30 | 14.8%(+7.60)#3,584 |
| 31. | Pike Road | 21.7% | 9.0%(+12.7)#31 | 14.8%(+6.90)#3,738 |
| 32. | Lakeview | 21.1% | 9.0%(+12.1)#32 | 14.8%(+6.30)#3,877 |
| 33. | Magnolia Springs | 20.2% | 9.0%(+11.2)#33 | 14.8%(+5.40)#4,076 |
| 34. | Helena | 19.1% | 9.0%(+10.1)#34 | 14.8%(+4.30)#4,319 |
| 35. | Sweet Water | 18.2% | 9.0%(+9.20)#35 | 14.8%(+3.40)#4,577 |
| 36. | Meridianville | 18.0% | 9.0%(+9.00)#36 | 14.8%(+3.20)#4,630 |
| 37. | Triana | 18.0% | 9.0%(+9.00)#37 | 14.8%(+3.20)#4,641 |
| 38. | Pelham | 17.6% | 9.0%(+8.60)#38 | 14.8%(+2.80)#4,741 |
| 39. | Auburn | 17.4% | 9.0%(+8.40)#39 | 14.8%(+2.60)#4,816 |
| 40. | Huntsville | 16.5% | 9.0%(+7.50)#40 | 14.8%(+1.70)#5,094 |
| 41. | Dauphin Island | 16.2% | 9.0%(+7.20)#41 | 14.8%(+1.40)#5,213 |
| 42. | Gardendale | 15.9% | 9.0%(+6.90)#42 | 14.8%(+1.10)#5,301 |
| 43. | Thomaston | 15.8% | 9.0%(+6.80)#43 | 14.8%(+1.000)#5,366 |
| 44. | Harvest | 15.7% | 9.0%(+6.70)#44 | 14.8%(+0.900)#5,384 |
| 45. | Satsuma | 15.0% | 9.0%(+6.00)#45 | 14.8%(+0.200)#5,632 |
| 46. | Moores Mill | 15.0% | 9.0%(+6.00)#46 | 14.8%(+0.200)#5,634 |
| 47. | Spanish Fort | 14.8% | 9.0%(+5.80)#47 | 14.8%(=0.000)#5,709 |
| 48. | Centreville | 14.2% | 9.0%(+5.20)#48 | 14.8%(-0.600)#5,969 |
| 49. | Lookout Mountain | 14.1% | 9.0%(+5.10)#49 | 14.8%(-0.700)#6,008 |
| 50. | Nances Creek | 14.0% | 9.0%(+5.00)#50 | 14.8%(-0.800)#6,062 |
| 51. | Rock Creek | 13.8% | 9.0%(+4.80)#51 | 14.8%(-1.00)#6,153 |
| 52. | Daphne | 13.6% | 9.0%(+4.60)#52 | 14.8%(-1.20)#6,226 |
| 53. | Redland | 13.5% | 9.0%(+4.50)#53 | 14.8%(-1.30)#6,284 |
| 54. | Westover | 13.4% | 9.0%(+4.40)#54 | 14.8%(-1.40)#6,332 |
| 55. | Guntersville | 13.2% | 9.0%(+4.20)#55 | 14.8%(-1.60)#6,417 |
| 56. | Chelsea | 12.5% | 9.0%(+3.50)#56 | 14.8%(-2.30)#6,720 |
| 57. | Ethelsville | 12.5% | 9.0%(+3.50)#57 | 14.8%(-2.30)#6,781 |
| 58. | Loxley | 12.4% | 9.0%(+3.40)#58 | 14.8%(-2.40)#6,804 |
| 59. | Silverhill | 12.1% | 9.0%(+3.10)#59 | 14.8%(-2.70)#6,977 |
| 60. | Lockhart | 11.8% | 9.0%(+2.80)#60 | 14.8%(-3.00)#7,131 |
| 61. | Langston | 11.8% | 9.0%(+2.80)#61 | 14.8%(-3.00)#7,134 |
| 62. | Gulf Shores | 11.4% | 9.0%(+2.40)#62 | 14.8%(-3.40)#7,345 |
| 63. | Ranburne | 11.4% | 9.0%(+2.40)#63 | 14.8%(-3.40)#7,392 |
| 64. | Prattville | 11.3% | 9.0%(+2.30)#64 | 14.8%(-3.50)#7,402 |
| 65. | Macedonia | 11.3% | 9.0%(+2.30)#65 | 14.8%(-3.50)#7,457 |
| 66. | Cusseta | 11.3% | 9.0%(+2.30)#66 | 14.8%(-3.50)#7,458 |
| 67. | Athens | 11.2% | 9.0%(+2.20)#67 | 14.8%(-3.60)#7,465 |
| 68. | Morris | 11.0% | 9.0%(+2.00)#68 | 14.8%(-3.80)#7,633 |
| 69. | Grove Hill | 10.9% | 9.0%(+1.90)#69 | 14.8%(-3.90)#7,693 |
| 70. | Saraland | 10.8% | 9.0%(+1.80)#70 | 14.8%(-4.00)#7,724 |
| 71. | Stapleton | 10.8% | 9.0%(+1.80)#71 | 14.8%(-4.00)#7,745 |
| 72. | Oneonta | 10.5% | 9.0%(+1.50)#72 | 14.8%(-4.30)#7,901 |
| 73. | Perdido | 10.5% | 9.0%(+1.50)#73 | 14.8%(-4.30)#7,932 |
| 74. | Needham | 10.5% | 9.0%(+1.50)#74 | 14.8%(-4.30)#7,949 |
| 75. | Billingsley | 10.5% | 9.0%(+1.50)#75 | 14.8%(-4.30)#7,952 |
| 76. | Tuscaloosa | 10.3% | 9.0%(+1.30)#76 | 14.8%(-4.50)#8,017 |
| 77. | Cuba | 10.3% | 9.0%(+1.30)#77 | 14.8%(-4.50)#8,072 |
| 78. | Rogersville | 10.2% | 9.0%(+1.20)#78 | 14.8%(-4.60)#8,123 |
| 79. | Carolina | 10.1% | 9.0%(+1.10)#79 | 14.8%(-4.70)#8,224 |
| 80. | Arab | 10.0% | 9.0%(+1.00)#80 | 14.8%(-4.80)#8,249 |
| 81. | Heath | 10.0% | 9.0%(+1.00)#81 | 14.8%(-4.80)#8,292 |
| 82. | Alabaster | 9.9% | 9.0%(+0.900)#82 | 14.8%(-4.90)#8,325 |
| 83. | Lake View | 9.9% | 9.0%(+0.900)#83 | 14.8%(-4.90)#8,352 |
| 84. | Mccalla | 9.8% | 9.0%(+0.800)#84 | 14.8%(-5.00)#8,398 |
| 85. | Demopolis | 9.7% | 9.0%(+0.700)#85 | 14.8%(-5.10)#8,484 |
| 86. | Sardis City | 9.7% | 9.0%(+0.700)#86 | 14.8%(-5.10)#8,510 |
| 87. | Chatom | 9.7% | 9.0%(+0.700)#87 | 14.8%(-5.10)#8,525 |
| 88. | St Florian | 9.7% | 9.0%(+0.700)#88 | 14.8%(-5.10)#8,528 |
| 89. | Irondale | 9.5% | 9.0%(+0.500)#89 | 14.8%(-5.30)#8,611 |
| 90. | Hytop | 9.3% | 9.0%(+0.300)#90 | 14.8%(-5.50)#8,807 |
| 91. | Avon | 9.3% | 9.0%(+0.300)#91 | 14.8%(-5.50)#8,809 |
| 92. | New Market | 9.2% | 9.0%(+0.200)#92 | 14.8%(-5.60)#8,879 |
| 93. | Fultondale | 9.1% | 9.0%(+0.100)#93 | 14.8%(-5.70)#8,909 |
| 94. | Fayette | 9.1% | 9.0%(+0.100)#94 | 14.8%(-5.70)#8,919 |
| 95. | Holtville | 9.0% | 9.0%(=0.000)#95 | 14.8%(-5.80)#9,015 |
| 96. | Pine Level | 8.9% | 9.0%(-0.100)#96 | 14.8%(-5.90)#9,084 |
| 97. | Dothan | 8.8% | 9.0%(-0.200)#97 | 14.8%(-6.00)#9,127 |
| 98. | Brewton | 8.7% | 9.0%(-0.300)#98 | 14.8%(-6.10)#9,245 |
| 99. | Somerville | 8.7% | 9.0%(-0.300)#99 | 14.8%(-6.10)#9,288 |
| 100. | Pell City | 8.6% | 9.0%(-0.400)#100 | 14.8%(-6.20)#9,325 |
Common Questions
What are the Top 10 Cities with the Highest Percentage of Families with Income Above $200,000 in Alabama?
Top 10 Cities with the Highest Percentage of Families with Income Above $200,000 in Alabama are:
#1
64.1%
#2
57.1%
#3
51.8%
#4
44.2%
#5
43.7%
#6
43.6%
#7
40.6%
#8
40.0%
#9
31.5%
#10
31.4%
What city has the Highest Percentage of Families with Income Above $200,000 in Alabama?
Hatton has the Highest Percentage of Families with Income Above $200,000 in Alabama with 64.1%.
What is the Percentage of Families with Income Above $200,000 in the State of Alabama?
Percentage of Families with Income Above $200,000 in Alabama is 9.0%.
What is the Percentage of Families with Income Above $200,000 in the United States?
Percentage of Families with Income Above $200,000 in the United States is 14.8%.