Cities with the Highest Percentage of Families with Income Above $200,000 in Oklahoma
RELATED REPORTS & OPTIONS
Family Income | $200k+
Oklahoma
Compare Cities
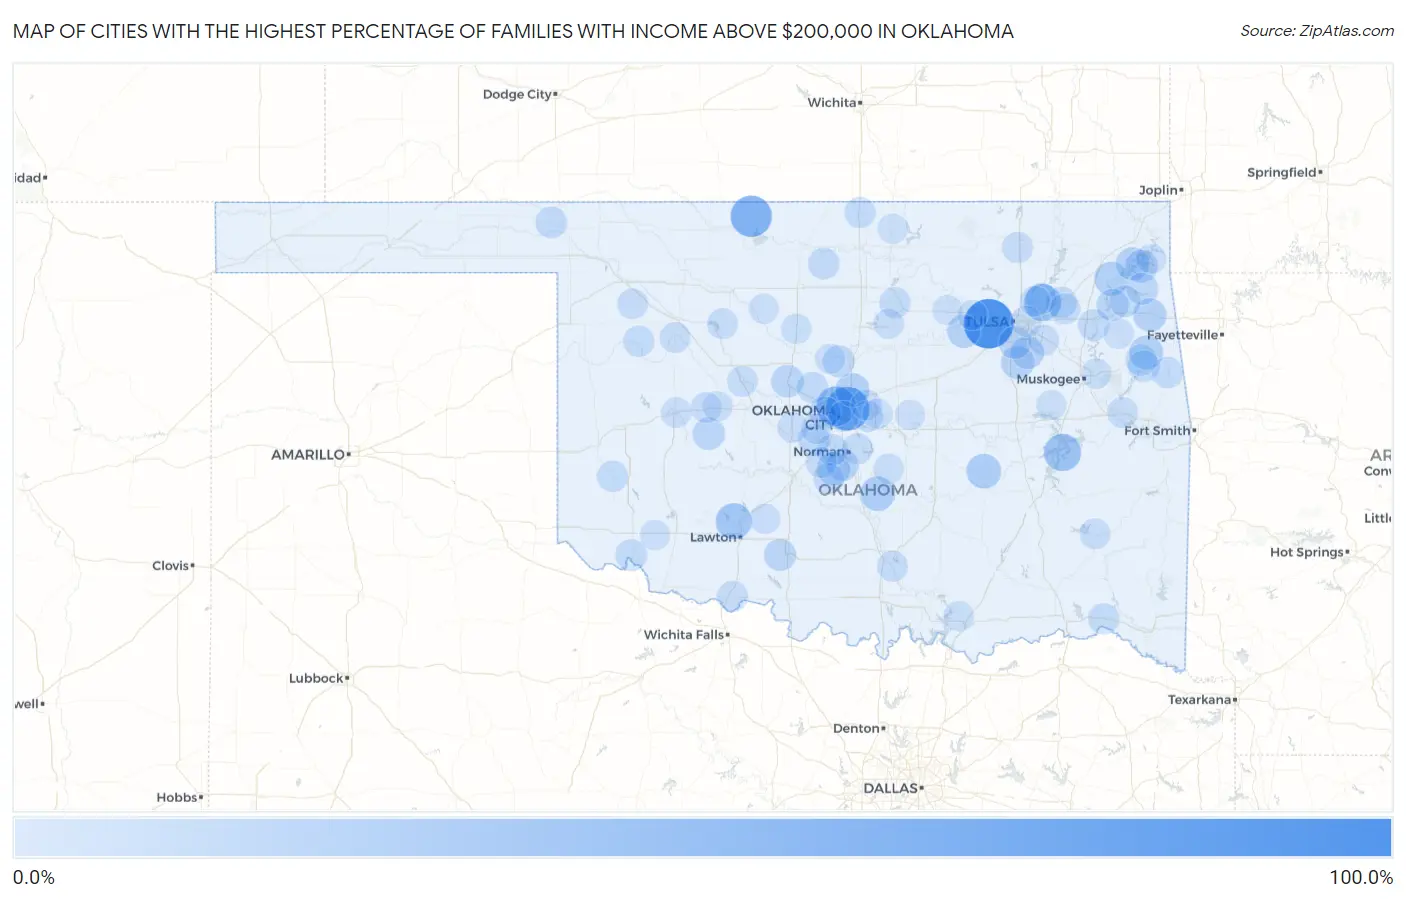
Map of Cities with the Highest Percentage of Families with Income Above $200,000 in Oklahoma
0.0%
100.0%
Cities with the Highest Percentage of Families with Income Above $200,000 in Oklahoma
| City | Families with Income > $200k | vs State | vs National | |
| 1. | Lotsee | 100.0% | 8.6%(+91.4)#1 | 14.8%(+85.2)#51 |
| 2. | Lake Aluma | 71.4% | 8.6%(+62.8)#2 | 14.8%(+56.6)#161 |
| 3. | Byron | 60.0% | 8.6%(+51.4)#3 | 14.8%(+45.2)#412 |
| 4. | Nichols Hills | 52.1% | 8.6%(+43.5)#4 | 14.8%(+37.3)#703 |
| 5. | Sparrowhawk | 51.5% | 8.6%(+42.9)#5 | 14.8%(+36.7)#734 |
| 6. | Hochatown | 40.0% | 8.6%(+31.4)#6 | 14.8%(+25.2)#1,412 |
| 7. | Carlton Landing | 40.0% | 8.6%(+31.4)#7 | 14.8%(+25.2)#1,417 |
| 8. | Scipio | 40.0% | 8.6%(+31.4)#8 | 14.8%(+25.2)#1,419 |
| 9. | Valley Park | 40.0% | 8.6%(+31.4)#9 | 14.8%(+25.2)#1,422 |
| 10. | Medicine Park | 35.6% | 8.6%(+27.0)#10 | 14.8%(+20.8)#1,786 |
| 11. | Pumpkin Hollow | 29.4% | 8.6%(+20.8)#11 | 14.8%(+14.6)#2,457 |
| 12. | Little Rock | 28.9% | 8.6%(+20.3)#12 | 14.8%(+14.1)#2,523 |
| 13. | Rosedale | 28.6% | 8.6%(+20.0)#13 | 14.8%(+13.8)#2,577 |
| 14. | Horntown | 28.0% | 8.6%(+19.4)#14 | 14.8%(+13.2)#2,664 |
| 15. | Bug Tussle | 25.5% | 8.6%(+16.9)#15 | 14.8%(+10.7)#3,037 |
| 16. | Pensacola | 25.0% | 8.6%(+16.4)#16 | 14.8%(+10.2)#3,118 |
| 17. | Edmond | 24.7% | 8.6%(+16.1)#17 | 14.8%(+9.90)#3,166 |
| 18. | Eldon | 24.4% | 8.6%(+15.8)#18 | 14.8%(+9.60)#3,225 |
| 19. | Kansas | 22.4% | 8.6%(+13.8)#19 | 14.8%(+7.60)#3,598 |
| 20. | Cleora | 22.3% | 8.6%(+13.7)#20 | 14.8%(+7.50)#3,612 |
| 21. | Cole | 22.2% | 8.6%(+13.6)#21 | 14.8%(+7.40)#3,629 |
| 22. | Lawrence Creek | 22.2% | 8.6%(+13.6)#22 | 14.8%(+7.40)#3,636 |
| 23. | Sand Point | 21.3% | 8.6%(+12.7)#23 | 14.8%(+6.50)#3,819 |
| 24. | Liberty | 21.3% | 8.6%(+12.7)#24 | 14.8%(+6.50)#3,820 |
| 25. | Earl | 21.1% | 8.6%(+12.5)#25 | 14.8%(+6.30)#3,878 |
| 26. | Bixby | 20.3% | 8.6%(+11.7)#26 | 14.8%(+5.50)#4,041 |
| 27. | Shady Grove Cdp Mcintosh County | 20.3% | 8.6%(+11.7)#27 | 14.8%(+5.50)#4,055 |
| 28. | Dennis | 20.3% | 8.6%(+11.7)#28 | 14.8%(+5.50)#4,059 |
| 29. | Okarche | 19.1% | 8.6%(+10.5)#29 | 14.8%(+4.30)#4,336 |
| 30. | Jenks | 19.0% | 8.6%(+10.4)#30 | 14.8%(+4.20)#4,348 |
| 31. | Sunray | 18.9% | 8.6%(+10.3)#31 | 14.8%(+4.10)#4,391 |
| 32. | Colony | 18.2% | 8.6%(+9.60)#32 | 14.8%(+3.40)#4,580 |
| 33. | Goldsby | 17.3% | 8.6%(+8.70)#33 | 14.8%(+2.50)#4,871 |
| 34. | Empire City | 16.9% | 8.6%(+8.30)#34 | 14.8%(+2.10)#4,991 |
| 35. | Enterprise | 16.7% | 8.6%(+8.10)#35 | 14.8%(+1.90)#5,051 |
| 36. | Pump Back | 16.7% | 8.6%(+8.10)#36 | 14.8%(+1.90)#5,052 |
| 37. | Reagan | 16.7% | 8.6%(+8.10)#37 | 14.8%(+1.90)#5,060 |
| 38. | Cedar Valley | 16.4% | 8.6%(+7.80)#38 | 14.8%(+1.60)#5,155 |
| 39. | Woodlawn Park | 15.8% | 8.6%(+7.20)#39 | 14.8%(+1.000)#5,372 |
| 40. | Cave Spring | 15.8% | 8.6%(+7.20)#40 | 14.8%(+1.000)#5,374 |
| 41. | New Eucha | 15.7% | 8.6%(+7.10)#41 | 14.8%(+0.900)#5,403 |
| 42. | Tuttle | 15.4% | 8.6%(+6.80)#42 | 14.8%(+0.600)#5,485 |
| 43. | Caney | 14.9% | 8.6%(+6.30)#43 | 14.8%(+0.100)#5,690 |
| 44. | Kenwood | 14.7% | 8.6%(+6.10)#44 | 14.8%(-0.100)#5,756 |
| 45. | Gate | 14.3% | 8.6%(+5.70)#45 | 14.8%(-0.500)#5,935 |
| 46. | Elmer | 14.3% | 8.6%(+5.70)#46 | 14.8%(-0.500)#5,945 |
| 47. | Justice | 14.0% | 8.6%(+5.40)#47 | 14.8%(-0.800)#6,053 |
| 48. | Pin Oak Acres | 14.0% | 8.6%(+5.40)#48 | 14.8%(-0.800)#6,061 |
| 49. | Hunter | 14.0% | 8.6%(+5.40)#49 | 14.8%(-0.800)#6,073 |
| 50. | Newcastle | 13.6% | 8.6%(+5.00)#50 | 14.8%(-1.20)#6,232 |
| 51. | Piedmont | 13.5% | 8.6%(+4.90)#51 | 14.8%(-1.30)#6,279 |
| 52. | Choctaw | 13.3% | 8.6%(+4.70)#52 | 14.8%(-1.50)#6,365 |
| 53. | Zion | 13.3% | 8.6%(+4.70)#53 | 14.8%(-1.50)#6,402 |
| 54. | Welling | 13.2% | 8.6%(+4.60)#54 | 14.8%(-1.60)#6,432 |
| 55. | Willow | 13.0% | 8.6%(+4.40)#55 | 14.8%(-1.80)#6,539 |
| 56. | Braman | 13.0% | 8.6%(+4.40)#56 | 14.8%(-1.80)#6,540 |
| 57. | Camargo | 12.9% | 8.6%(+4.30)#57 | 14.8%(-1.90)#6,591 |
| 58. | Limestone | 12.5% | 8.6%(+3.90)#58 | 14.8%(-2.30)#6,758 |
| 59. | Swink | 12.5% | 8.6%(+3.90)#59 | 14.8%(-2.30)#6,783 |
| 60. | Morrison | 12.0% | 8.6%(+3.40)#60 | 14.8%(-2.80)#7,028 |
| 61. | Bartlesville | 11.8% | 8.6%(+3.20)#61 | 14.8%(-3.00)#7,095 |
| 62. | Randlett | 11.5% | 8.6%(+2.90)#62 | 14.8%(-3.30)#7,313 |
| 63. | Tiawah | 11.5% | 8.6%(+2.90)#63 | 14.8%(-3.30)#7,326 |
| 64. | Tulsa | 11.4% | 8.6%(+2.80)#64 | 14.8%(-3.40)#7,330 |
| 65. | Weatherford | 11.4% | 8.6%(+2.80)#65 | 14.8%(-3.40)#7,346 |
| 66. | Dibble | 11.3% | 8.6%(+2.70)#66 | 14.8%(-3.50)#7,440 |
| 67. | Carlisle | 11.3% | 8.6%(+2.70)#67 | 14.8%(-3.50)#7,448 |
| 68. | Broken Arrow | 11.1% | 8.6%(+2.50)#68 | 14.8%(-3.70)#7,514 |
| 69. | Blanchard | 11.1% | 8.6%(+2.50)#69 | 14.8%(-3.70)#7,533 |
| 70. | Norman | 10.9% | 8.6%(+2.30)#70 | 14.8%(-3.90)#7,658 |
| 71. | Dougherty | 10.9% | 8.6%(+2.30)#71 | 14.8%(-3.90)#7,713 |
| 72. | Sharon | 10.8% | 8.6%(+2.20)#72 | 14.8%(-4.00)#7,769 |
| 73. | Taloga | 10.7% | 8.6%(+2.10)#73 | 14.8%(-4.10)#7,822 |
| 74. | Greenfield | 10.7% | 8.6%(+2.10)#74 | 14.8%(-4.10)#7,828 |
| 75. | Oklahoma City | 10.5% | 8.6%(+1.90)#75 | 14.8%(-4.30)#7,887 |
| 76. | Tuskahoma | 10.5% | 8.6%(+1.90)#76 | 14.8%(-4.30)#7,953 |
| 77. | Owasso | 10.4% | 8.6%(+1.80)#77 | 14.8%(-4.40)#7,957 |
| 78. | Longdale | 10.3% | 8.6%(+1.70)#78 | 14.8%(-4.50)#8,081 |
| 79. | Jones | 10.0% | 8.6%(+1.40)#79 | 14.8%(-4.80)#8,262 |
| 80. | Union City | 9.9% | 8.6%(+1.30)#80 | 14.8%(-4.90)#8,372 |
| 81. | Mustang | 9.8% | 8.6%(+1.20)#81 | 14.8%(-5.00)#8,394 |
| 82. | Silo | 9.1% | 8.6%(+0.500)#82 | 14.8%(-5.70)#8,957 |
| 83. | Tribbey | 9.1% | 8.6%(+0.500)#83 | 14.8%(-5.70)#8,963 |
| 84. | Stillwater | 9.0% | 8.6%(+0.400)#84 | 14.8%(-5.80)#8,997 |
| 85. | Sterling | 9.0% | 8.6%(+0.400)#85 | 14.8%(-5.80)#9,043 |
| 86. | Clinton | 8.9% | 8.6%(+0.300)#86 | 14.8%(-5.90)#9,066 |
| 87. | Hennessey | 8.8% | 8.6%(+0.200)#87 | 14.8%(-6.00)#9,159 |
| 88. | Harrah | 8.7% | 8.6%(+0.100)#88 | 14.8%(-6.10)#9,241 |
| 89. | Council Hill | 8.7% | 8.6%(+0.100)#89 | 14.8%(-6.10)#9,306 |
| 90. | Hallett | 8.7% | 8.6%(+0.100)#90 | 14.8%(-6.10)#9,311 |
| 91. | Peggs | 8.6% | 8.6%(=0.000)#91 | 14.8%(-6.20)#9,386 |
| 92. | Grove | 8.3% | 8.6%(-0.300)#92 | 14.8%(-6.50)#9,589 |
| 93. | Cimarron City | 8.3% | 8.6%(-0.300)#93 | 14.8%(-6.50)#9,651 |
| 94. | Headrick | 8.3% | 8.6%(-0.300)#94 | 14.8%(-6.50)#9,658 |
| 95. | Kildare | 8.3% | 8.6%(-0.300)#95 | 14.8%(-6.50)#9,661 |
| 96. | Fort Gibson | 8.1% | 8.6%(-0.500)#96 | 14.8%(-6.70)#9,806 |
| 97. | Meeker | 8.1% | 8.6%(-0.500)#97 | 14.8%(-6.70)#9,829 |
| 98. | Westport | 8.1% | 8.6%(-0.500)#98 | 14.8%(-6.70)#9,853 |
| 99. | Ames | 8.1% | 8.6%(-0.500)#99 | 14.8%(-6.70)#9,862 |
| 100. | Hydro | 8.0% | 8.6%(-0.600)#100 | 14.8%(-6.80)#9,932 |
Common Questions
What are the Top 10 Cities with the Highest Percentage of Families with Income Above $200,000 in Oklahoma?
Top 10 Cities with the Highest Percentage of Families with Income Above $200,000 in Oklahoma are:
#1
100.0%
#2
71.4%
#3
60.0%
#4
52.1%
#5
40.0%
#6
40.0%
#7
35.6%
#8
28.6%
#9
28.0%
#10
25.0%
What city has the Highest Percentage of Families with Income Above $200,000 in Oklahoma?
Lotsee has the Highest Percentage of Families with Income Above $200,000 in Oklahoma with 100.0%.
What is the Percentage of Families with Income Above $200,000 in the State of Oklahoma?
Percentage of Families with Income Above $200,000 in Oklahoma is 8.6%.
What is the Percentage of Families with Income Above $200,000 in the United States?
Percentage of Families with Income Above $200,000 in the United States is 14.8%.