Cities with the Highest Percentage of Families with Income Above $200,000 in Delaware
RELATED REPORTS & OPTIONS
Family Income | $200k+
Delaware
Compare Cities
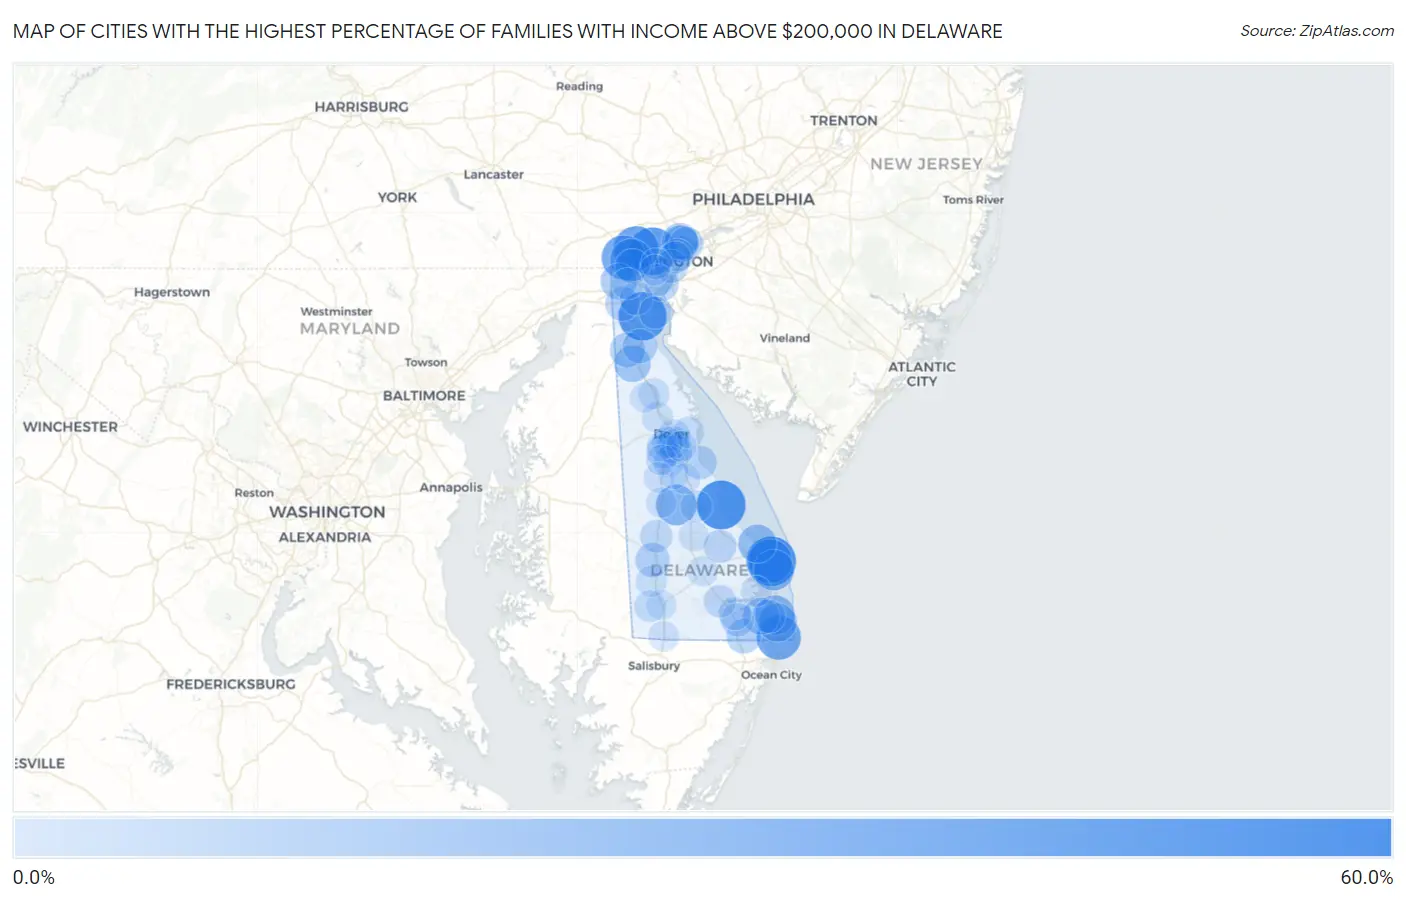
Map of Cities with the Highest Percentage of Families with Income Above $200,000 in Delaware
0.0%
60.0%
Cities with the Highest Percentage of Families with Income Above $200,000 in Delaware
| City | Families with Income > $200k | vs State | vs National | |
| 1. | Henlopen Acres | 58.8% | 13.5%(+45.3)#1 | 14.8%(+44.0)#437 |
| 2. | Slaughter Beach | 56.7% | 13.5%(+43.2)#2 | 14.8%(+41.9)#521 |
| 3. | St Georges | 54.9% | 13.5%(+41.4)#3 | 14.8%(+40.1)#584 |
| 4. | Greenville | 52.3% | 13.5%(+38.8)#4 | 14.8%(+37.5)#696 |
| 5. | Hockessin | 45.4% | 13.5%(+31.9)#5 | 14.8%(+30.6)#1,026 |
| 6. | Fenwick Island | 42.5% | 13.5%(+29.0)#6 | 14.8%(+27.7)#1,215 |
| 7. | North Star | 42.1% | 13.5%(+28.6)#7 | 14.8%(+27.3)#1,248 |
| 8. | Rehoboth Beach | 41.9% | 13.5%(+28.4)#8 | 14.8%(+27.1)#1,268 |
| 9. | Pike Creek | 36.9% | 13.5%(+23.4)#9 | 14.8%(+22.1)#1,664 |
| 10. | Houston | 31.4% | 13.5%(+17.9)#10 | 14.8%(+16.6)#2,218 |
| 11. | Dewey Beach | 31.4% | 13.5%(+17.9)#11 | 14.8%(+16.6)#2,219 |
| 12. | Bethany Beach | 27.8% | 13.5%(+14.3)#12 | 14.8%(+13.0)#2,695 |
| 13. | South Bethany | 25.0% | 13.5%(+11.5)#13 | 14.8%(+10.2)#3,111 |
| 14. | Lewes | 24.4% | 13.5%(+10.9)#14 | 14.8%(+9.60)#3,219 |
| 15. | Millville | 19.8% | 13.5%(+6.30)#15 | 14.8%(+5.00)#4,178 |
| 16. | Ardencroft | 19.2% | 13.5%(+5.70)#16 | 14.8%(+4.40)#4,315 |
| 17. | Townsend | 18.6% | 13.5%(+5.10)#17 | 14.8%(+3.80)#4,467 |
| 18. | Arden | 17.9% | 13.5%(+4.40)#18 | 14.8%(+3.10)#4,668 |
| 19. | Newark | 17.6% | 13.5%(+4.10)#19 | 14.8%(+2.80)#4,738 |
| 20. | Middletown | 14.5% | 13.5%(+1.000)#20 | 14.8%(-0.300)#5,813 |
| 21. | Pike Creek Valley | 13.6% | 13.5%(+0.100)#21 | 14.8%(-1.20)#6,233 |
| 22. | New Castle | 13.0% | 13.5%(-0.500)#22 | 14.8%(-1.80)#6,503 |
| 23. | Odessa | 13.0% | 13.5%(-0.500)#23 | 14.8%(-1.80)#6,531 |
| 24. | Selbyville | 12.9% | 13.5%(-0.600)#24 | 14.8%(-1.90)#6,573 |
| 25. | Glasgow | 12.4% | 13.5%(-1.10)#25 | 14.8%(-2.40)#6,790 |
| 26. | Bridgeville | 12.1% | 13.5%(-1.40)#26 | 14.8%(-2.70)#6,967 |
| 27. | Lincoln | 11.8% | 13.5%(-1.70)#27 | 14.8%(-3.00)#7,118 |
| 28. | Ardentown | 11.8% | 13.5%(-1.70)#28 | 14.8%(-3.00)#7,136 |
| 29. | Camden | 11.5% | 13.5%(-2.00)#29 | 14.8%(-3.30)#7,289 |
| 30. | Bowers | 10.8% | 13.5%(-2.70)#30 | 14.8%(-4.00)#7,765 |
| 31. | Claymont | 10.6% | 13.5%(-2.90)#31 | 14.8%(-4.20)#7,840 |
| 32. | Ocean View | 9.6% | 13.5%(-3.90)#32 | 14.8%(-5.20)#8,561 |
| 33. | Wilmington | 9.3% | 13.5%(-4.20)#33 | 14.8%(-5.50)#8,741 |
| 34. | Highland Acres | 8.7% | 13.5%(-4.80)#34 | 14.8%(-6.10)#9,247 |
| 35. | Frankford | 8.3% | 13.5%(-5.20)#35 | 14.8%(-6.50)#9,624 |
| 36. | Bear | 8.1% | 13.5%(-5.40)#36 | 14.8%(-6.70)#9,783 |
| 37. | Milton | 7.9% | 13.5%(-5.60)#37 | 14.8%(-6.90)#10,009 |
| 38. | Dagsboro | 7.7% | 13.5%(-5.80)#38 | 14.8%(-7.10)#10,211 |
| 39. | Greenwood | 7.4% | 13.5%(-6.10)#39 | 14.8%(-7.40)#10,516 |
| 40. | Millsboro | 6.9% | 13.5%(-6.60)#40 | 14.8%(-7.90)#11,026 |
| 41. | Bellefonte | 6.9% | 13.5%(-6.60)#41 | 14.8%(-7.90)#11,061 |
| 42. | Delaware City | 6.8% | 13.5%(-6.70)#42 | 14.8%(-8.00)#11,161 |
| 43. | Kent Acres | 6.2% | 13.5%(-7.30)#43 | 14.8%(-8.60)#11,903 |
| 44. | Edgemoor | 6.1% | 13.5%(-7.40)#44 | 14.8%(-8.70)#11,967 |
| 45. | Rising Sun Lebanon | 5.9% | 13.5%(-7.60)#45 | 14.8%(-8.90)#12,245 |
| 46. | Wilmington Manor | 5.1% | 13.5%(-8.40)#46 | 14.8%(-9.70)#13,284 |
| 47. | Milford | 4.7% | 13.5%(-8.80)#47 | 14.8%(-10.1)#13,869 |
| 48. | Bethel | 4.4% | 13.5%(-9.10)#48 | 14.8%(-10.4)#14,437 |
| 49. | Brookside | 4.2% | 13.5%(-9.30)#49 | 14.8%(-10.6)#14,657 |
| 50. | Dover | 3.4% | 13.5%(-10.1)#50 | 14.8%(-11.4)#15,993 |
| 51. | Rodney Village | 3.2% | 13.5%(-10.3)#51 | 14.8%(-11.6)#16,454 |
| 52. | Little Creek | 3.1% | 13.5%(-10.4)#52 | 14.8%(-11.7)#16,680 |
| 53. | Cheswold | 3.0% | 13.5%(-10.5)#53 | 14.8%(-11.8)#16,763 |
| 54. | Seaford | 2.9% | 13.5%(-10.6)#54 | 14.8%(-11.9)#16,866 |
| 55. | Elsmere | 2.9% | 13.5%(-10.6)#55 | 14.8%(-11.9)#16,875 |
| 56. | Wyoming | 2.9% | 13.5%(-10.6)#56 | 14.8%(-11.9)#16,920 |
| 57. | Smyrna | 2.8% | 13.5%(-10.7)#57 | 14.8%(-12.0)#17,063 |
| 58. | Long Neck | 2.2% | 13.5%(-11.3)#58 | 14.8%(-12.6)#18,208 |
| 59. | Woodside East | 1.9% | 13.5%(-11.6)#59 | 14.8%(-12.9)#18,811 |
| 60. | Delmar | 1.6% | 13.5%(-11.9)#60 | 14.8%(-13.2)#19,404 |
| 61. | Newport | 1.6% | 13.5%(-11.9)#61 | 14.8%(-13.2)#19,448 |
| 62. | Riverview | 1.5% | 13.5%(-12.0)#62 | 14.8%(-13.3)#19,597 |
| 63. | Felton | 1.5% | 13.5%(-12.0)#63 | 14.8%(-13.3)#19,633 |
| 64. | Woodside | 1.3% | 13.5%(-12.2)#64 | 14.8%(-13.5)#20,118 |
| 65. | Dover Base Housing | 1.2% | 13.5%(-12.3)#65 | 14.8%(-13.6)#20,166 |
| 66. | Laurel | 1.0% | 13.5%(-12.5)#66 | 14.8%(-13.8)#20,500 |
| 67. | Frederica | 0.90% | 13.5%(-12.6)#67 | 14.8%(-13.9)#20,740 |
| 68. | Clayton | 0.80% | 13.5%(-12.7)#68 | 14.8%(-14.0)#20,826 |
| 69. | Georgetown | 0.70% | 13.5%(-12.8)#69 | 14.8%(-14.1)#20,964 |
| 70. | Ellendale | 0.70% | 13.5%(-12.8)#70 | 14.8%(-14.1)#21,056 |
| 71. | Harrington | 0.60% | 13.5%(-12.9)#71 | 14.8%(-14.2)#21,126 |
1
Common Questions
What are the Top 10 Cities with the Highest Percentage of Families with Income Above $200,000 in Delaware?
Top 10 Cities with the Highest Percentage of Families with Income Above $200,000 in Delaware are:
#1
58.8%
#2
56.7%
#3
54.9%
#4
52.3%
#5
45.4%
#6
42.5%
#7
42.1%
#8
41.9%
#9
36.9%
#10
31.4%
What city has the Highest Percentage of Families with Income Above $200,000 in Delaware?
Henlopen Acres has the Highest Percentage of Families with Income Above $200,000 in Delaware with 58.8%.
What is the Percentage of Families with Income Above $200,000 in the State of Delaware?
Percentage of Families with Income Above $200,000 in Delaware is 13.5%.
What is the Percentage of Families with Income Above $200,000 in the United States?
Percentage of Families with Income Above $200,000 in the United States is 14.8%.