Cities with the Highest Percentage of Families with Income Above $200,000 in Montana
RELATED REPORTS & OPTIONS
Family Income | $200k+
Montana
Compare Cities
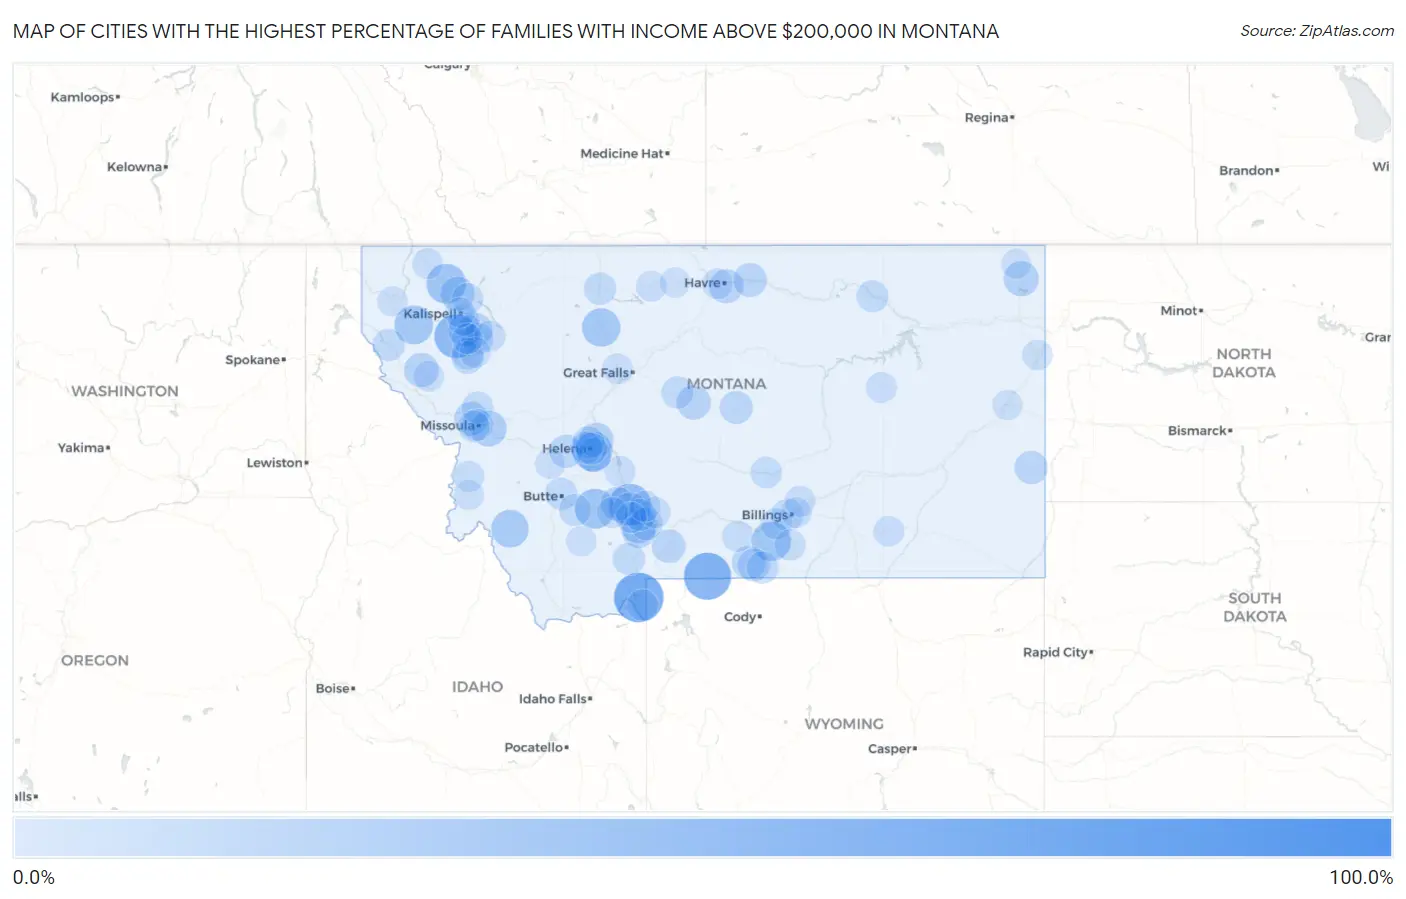
Map of Cities with the Highest Percentage of Families with Income Above $200,000 in Montana
0.0%
100.0%
Cities with the Highest Percentage of Families with Income Above $200,000 in Montana
| City | Families with Income > $200k | vs State | vs National | |
| 1. | Mammoth | 100.0% | 9.6%(+90.4)#1 | 14.8%(+85.2)#46 |
| 2. | Hebgen Lake Estates | 69.0% | 9.6%(+59.4)#2 | 14.8%(+54.2)#196 |
| 3. | Silver Gate | 61.4% | 9.6%(+51.8)#3 | 14.8%(+46.6)#366 |
| 4. | Lake Mary Ronan | 50.0% | 9.6%(+40.4)#4 | 14.8%(+35.2)#795 |
| 5. | Fords Creek Colony | 50.0% | 9.6%(+40.4)#5 | 14.8%(+35.2)#796 |
| 6. | Ayers Ranch Colony | 50.0% | 9.6%(+40.4)#6 | 14.8%(+35.2)#798 |
| 7. | Hardy | 47.4% | 9.6%(+37.8)#7 | 14.8%(+32.6)#914 |
| 8. | Gallatin River Ranch | 45.5% | 9.6%(+35.9)#8 | 14.8%(+30.7)#1,022 |
| 9. | Rockvale | 39.6% | 9.6%(+30.0)#9 | 14.8%(+24.8)#1,450 |
| 10. | Cardwell | 37.5% | 9.6%(+27.9)#10 | 14.8%(+22.7)#1,618 |
| 11. | South Hills | 37.4% | 9.6%(+27.8)#11 | 14.8%(+22.6)#1,624 |
| 12. | Olney | 36.8% | 9.6%(+27.2)#12 | 14.8%(+22.0)#1,679 |
| 13. | Edgar | 35.7% | 9.6%(+26.1)#13 | 14.8%(+20.9)#1,776 |
| 14. | Happys Inn | 33.3% | 9.6%(+23.7)#14 | 14.8%(+18.5)#2,012 |
| 15. | Brady | 32.4% | 9.6%(+22.8)#15 | 14.8%(+17.6)#2,111 |
| 16. | Wisdom | 30.0% | 9.6%(+20.4)#16 | 14.8%(+15.2)#2,376 |
| 17. | Rapelje | 28.0% | 9.6%(+18.4)#17 | 14.8%(+13.2)#2,665 |
| 18. | Four Corners | 27.6% | 9.6%(+18.0)#18 | 14.8%(+12.8)#2,721 |
| 19. | Turah | 24.6% | 9.6%(+15.0)#19 | 14.8%(+9.80)#3,193 |
| 20. | York | 23.5% | 9.6%(+13.9)#20 | 14.8%(+8.70)#3,381 |
| 21. | Twin Creeks | 22.7% | 9.6%(+13.1)#21 | 14.8%(+7.90)#3,536 |
| 22. | Reserve | 22.2% | 9.6%(+12.6)#22 | 14.8%(+7.40)#3,644 |
| 23. | Woods Bay | 21.2% | 9.6%(+11.6)#23 | 14.8%(+6.40)#3,848 |
| 24. | Helena Valley Northeast | 20.7% | 9.6%(+11.1)#24 | 14.8%(+5.90)#3,946 |
| 25. | Montana City | 20.0% | 9.6%(+10.4)#25 | 14.8%(+5.20)#4,119 |
| 26. | Weeksville | 20.0% | 9.6%(+10.4)#26 | 14.8%(+5.20)#4,135 |
| 27. | Silver Star | 20.0% | 9.6%(+10.4)#27 | 14.8%(+5.20)#4,137 |
| 28. | Maverick Mountain | 20.0% | 9.6%(+10.4)#28 | 14.8%(+5.20)#4,139 |
| 29. | Whitefish | 19.9% | 9.6%(+10.3)#29 | 14.8%(+5.10)#4,150 |
| 30. | Stanford | 19.1% | 9.6%(+9.50)#30 | 14.8%(+4.30)#4,344 |
| 31. | Saddle Butte | 19.1% | 9.6%(+9.50)#31 | 14.8%(+4.30)#4,345 |
| 32. | Wheatland | 18.9% | 9.6%(+9.30)#32 | 14.8%(+4.10)#4,389 |
| 33. | Wye | 18.7% | 9.6%(+9.10)#33 | 14.8%(+3.90)#4,452 |
| 34. | Chinook | 18.0% | 9.6%(+8.40)#34 | 14.8%(+3.20)#4,644 |
| 35. | Red Lodge | 17.4% | 9.6%(+7.80)#35 | 14.8%(+2.60)#4,838 |
| 36. | Pray | 17.3% | 9.6%(+7.70)#36 | 14.8%(+2.50)#4,880 |
| 37. | Lakeside | 16.9% | 9.6%(+7.30)#37 | 14.8%(+2.10)#4,985 |
| 38. | Elliston | 16.7% | 9.6%(+7.10)#38 | 14.8%(+1.90)#5,047 |
| 39. | Baker | 16.3% | 9.6%(+6.70)#39 | 14.8%(+1.50)#5,172 |
| 40. | Gallatin Gateway | 16.3% | 9.6%(+6.70)#40 | 14.8%(+1.50)#5,181 |
| 41. | Lewistown Heights | 15.4% | 9.6%(+5.80)#41 | 14.8%(+0.600)#5,506 |
| 42. | Manhattan | 15.1% | 9.6%(+5.50)#42 | 14.8%(+0.300)#5,607 |
| 43. | Bozeman | 15.0% | 9.6%(+5.40)#43 | 14.8%(+0.200)#5,622 |
| 44. | Kerr | 14.3% | 9.6%(+4.70)#44 | 14.8%(-0.500)#5,927 |
| 45. | Bearcreek | 14.3% | 9.6%(+4.70)#45 | 14.8%(-0.500)#5,933 |
| 46. | Helena Valley West Central | 13.6% | 9.6%(+4.00)#46 | 14.8%(-1.20)#6,236 |
| 47. | Shelby | 13.5% | 9.6%(+3.90)#47 | 14.8%(-1.30)#6,288 |
| 48. | Big Sky | 13.4% | 9.6%(+3.80)#48 | 14.8%(-1.40)#6,327 |
| 49. | Geyser | 13.3% | 9.6%(+3.70)#49 | 14.8%(-1.50)#6,398 |
| 50. | Trout Creek | 13.2% | 9.6%(+3.60)#50 | 14.8%(-1.60)#6,441 |
| 51. | Helena West Side | 13.0% | 9.6%(+3.40)#51 | 14.8%(-1.80)#6,516 |
| 52. | Belfry | 12.8% | 9.6%(+3.20)#52 | 14.8%(-2.00)#6,642 |
| 53. | Bear Dance | 12.5% | 9.6%(+2.90)#53 | 14.8%(-2.30)#6,768 |
| 54. | Walkerville | 12.4% | 9.6%(+2.80)#54 | 14.8%(-2.40)#6,822 |
| 55. | Billings | 12.3% | 9.6%(+2.70)#55 | 14.8%(-2.50)#6,833 |
| 56. | Rader Creek | 12.2% | 9.6%(+2.60)#56 | 14.8%(-2.60)#6,921 |
| 57. | Hinsdale | 12.1% | 9.6%(+2.50)#57 | 14.8%(-2.70)#6,985 |
| 58. | Evaro | 12.0% | 9.6%(+2.40)#58 | 14.8%(-2.80)#7,031 |
| 59. | Rocky Point | 12.0% | 9.6%(+2.40)#59 | 14.8%(-2.80)#7,039 |
| 60. | Belgrade | 11.9% | 9.6%(+2.30)#60 | 14.8%(-2.90)#7,056 |
| 61. | Missoula | 11.7% | 9.6%(+2.10)#61 | 14.8%(-3.10)#7,145 |
| 62. | Helena | 11.5% | 9.6%(+1.90)#62 | 14.8%(-3.30)#7,266 |
| 63. | Orchard Homes | 11.3% | 9.6%(+1.70)#63 | 14.8%(-3.50)#7,416 |
| 64. | Forest Hill Village | 10.7% | 9.6%(+1.10)#64 | 14.8%(-4.10)#7,824 |
| 65. | Lavina | 10.7% | 9.6%(+1.10)#65 | 14.8%(-4.10)#7,827 |
| 66. | Columbia Falls | 10.5% | 9.6%(+0.900)#66 | 14.8%(-4.30)#7,904 |
| 67. | Laurel | 10.4% | 9.6%(+0.800)#67 | 14.8%(-4.40)#7,968 |
| 68. | Bridger | 10.3% | 9.6%(+0.700)#68 | 14.8%(-4.50)#8,079 |
| 69. | West Yellowstone | 10.1% | 9.6%(+0.500)#69 | 14.8%(-4.70)#8,198 |
| 70. | Unionville | 9.9% | 9.6%(+0.300)#70 | 14.8%(-4.90)#8,385 |
| 71. | Swan Lake | 9.6% | 9.6%(=0.000)#71 | 14.8%(-5.20)#8,597 |
| 72. | Absarokee | 9.5% | 9.6%(-0.100)#72 | 14.8%(-5.30)#8,643 |
| 73. | Springhill | 9.3% | 9.6%(-0.300)#73 | 14.8%(-5.50)#8,820 |
| 74. | Shepherd | 9.1% | 9.6%(-0.500)#74 | 14.8%(-5.70)#8,951 |
| 75. | Pryor | 9.1% | 9.6%(-0.500)#75 | 14.8%(-5.70)#8,953 |
| 76. | Hamilton | 9.0% | 9.6%(-0.600)#76 | 14.8%(-5.80)#9,017 |
| 77. | Plains | 8.8% | 9.6%(-0.800)#77 | 14.8%(-6.00)#9,170 |
| 78. | Churchill | 8.8% | 9.6%(-0.800)#78 | 14.8%(-6.00)#9,174 |
| 79. | Jordan | 8.8% | 9.6%(-0.800)#79 | 14.8%(-6.00)#9,203 |
| 80. | Willow Creek | 8.8% | 9.6%(-0.800)#80 | 14.8%(-6.00)#9,208 |
| 81. | Townsend | 8.7% | 9.6%(-0.900)#81 | 14.8%(-6.10)#9,258 |
| 82. | Muddy | 8.7% | 9.6%(-0.900)#82 | 14.8%(-6.10)#9,290 |
| 83. | Finley Point | 8.6% | 9.6%(-1.00)#83 | 14.8%(-6.20)#9,398 |
| 84. | Rollins | 8.6% | 9.6%(-1.00)#84 | 14.8%(-6.20)#9,408 |
| 85. | Fortine | 8.4% | 9.6%(-1.20)#85 | 14.8%(-6.40)#9,564 |
| 86. | Vaughn | 8.3% | 9.6%(-1.30)#86 | 14.8%(-6.50)#9,619 |
| 87. | Beaver Creek | 8.3% | 9.6%(-1.30)#87 | 14.8%(-6.50)#9,636 |
| 88. | New Miami Colony | 8.3% | 9.6%(-1.30)#88 | 14.8%(-6.50)#9,649 |
| 89. | Essex | 8.3% | 9.6%(-1.30)#89 | 14.8%(-6.50)#9,662 |
| 90. | Chester | 8.1% | 9.6%(-1.50)#90 | 14.8%(-6.70)#9,837 |
| 91. | Sidney | 7.8% | 9.6%(-1.80)#91 | 14.8%(-7.00)#10,093 |
| 92. | Lockwood | 7.7% | 9.6%(-1.90)#92 | 14.8%(-7.10)#10,183 |
| 93. | Sheridan | 7.3% | 9.6%(-2.30)#93 | 14.8%(-7.50)#10,637 |
| 94. | Rudyard | 6.9% | 9.6%(-2.70)#94 | 14.8%(-7.90)#11,083 |
| 95. | White Haven | 6.8% | 9.6%(-2.80)#95 | 14.8%(-8.00)#11,183 |
| 96. | Kalispell | 6.7% | 9.6%(-2.90)#96 | 14.8%(-8.10)#11,220 |
| 97. | Deer Lodge | 6.7% | 9.6%(-2.90)#97 | 14.8%(-8.10)#11,265 |
| 98. | Plentywood | 6.7% | 9.6%(-2.90)#98 | 14.8%(-8.10)#11,277 |
| 99. | Darby | 6.7% | 9.6%(-2.90)#99 | 14.8%(-8.10)#11,306 |
| 100. | Glendive | 6.6% | 9.6%(-3.00)#100 | 14.8%(-8.20)#11,398 |
Common Questions
What are the Top 10 Cities with the Highest Percentage of Families with Income Above $200,000 in Montana?
Top 10 Cities with the Highest Percentage of Families with Income Above $200,000 in Montana are:
#1
69.0%
#2
61.4%
#3
50.0%
#4
45.5%
#5
37.5%
#6
37.4%
#7
36.8%
#8
35.7%
#9
33.3%
#10
32.4%
What city has the Highest Percentage of Families with Income Above $200,000 in Montana?
Hebgen Lake Estates has the Highest Percentage of Families with Income Above $200,000 in Montana with 69.0%.
What is the Percentage of Families with Income Above $200,000 in the State of Montana?
Percentage of Families with Income Above $200,000 in Montana is 9.6%.
What is the Percentage of Families with Income Above $200,000 in the United States?
Percentage of Families with Income Above $200,000 in the United States is 14.8%.