Zip Codes with the Highest Percentage of Families with Income Above $200,000 in San Diego, CA
RELATED REPORTS & OPTIONS
Family Income | $200k+
San Diego
Compare Zip Codes
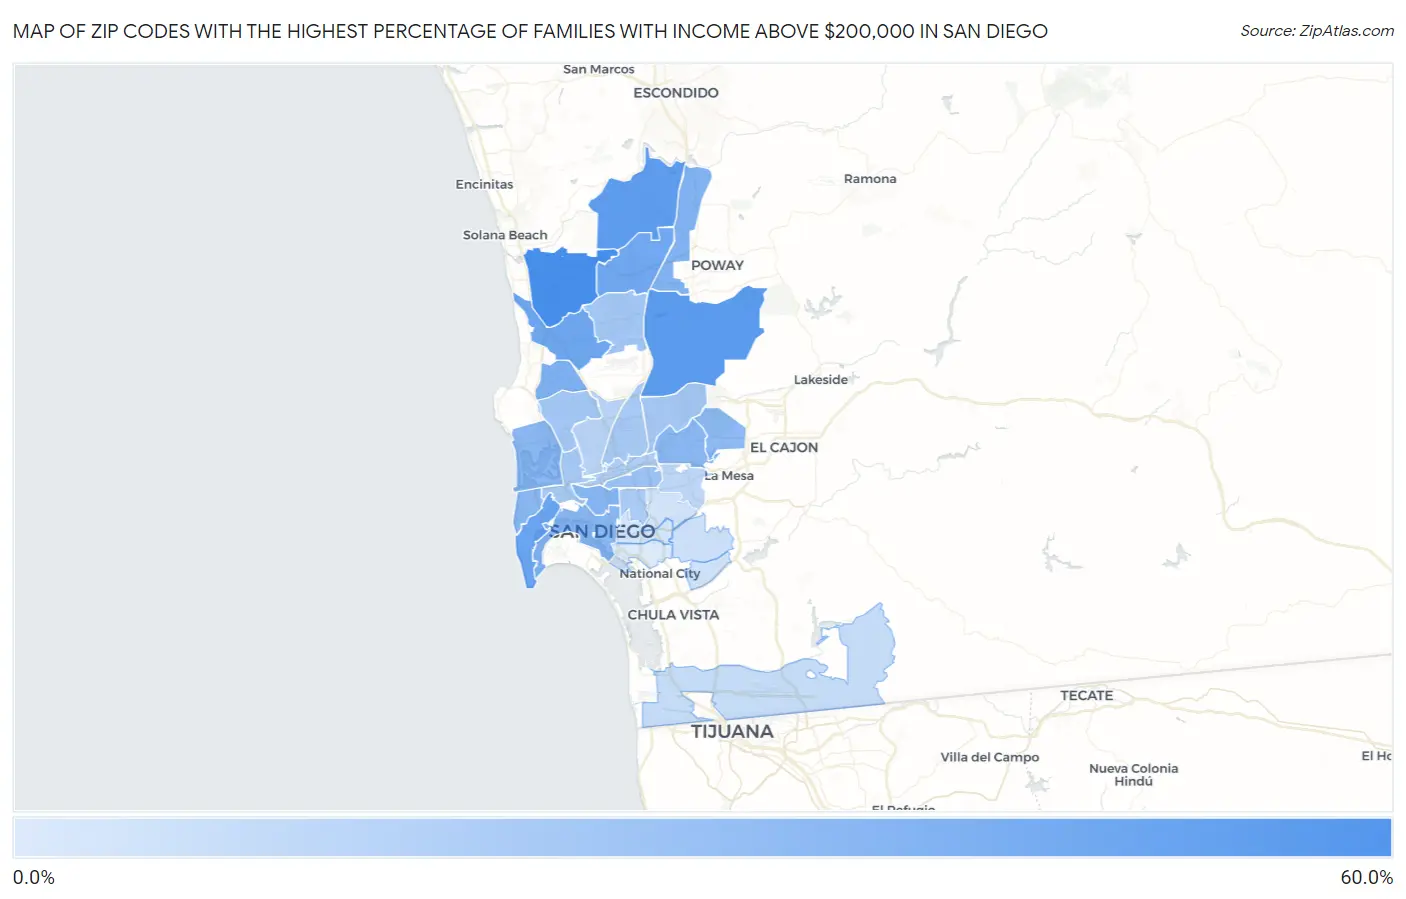
Map of Zip Codes with the Highest Percentage of Families with Income Above $200,000 in San Diego
3.2%
55.0%
Zip Codes with the Highest Percentage of Families with Income Above $200,000 in San Diego, CA
| Zip Code | Families with Income > $200k | vs State | vs National | |
| 1. | 92130 | 55.0% | 21.1%(+33.9)#89 | 14.8%(+40.2)#452 |
| 2. | 92131 | 47.4% | 21.1%(+26.3)#140 | 14.8%(+32.6)#789 |
| 3. | 92127 | 45.8% | 21.1%(+24.7)#153 | 14.8%(+31.0)#880 |
| 4. | 92106 | 41.0% | 21.1%(+19.9)#202 | 14.8%(+26.2)#1,224 |
| 5. | 92121 | 39.0% | 21.1%(+17.9)#241 | 14.8%(+24.2)#1,414 |
| 6. | 92129 | 38.3% | 21.1%(+17.2)#258 | 14.8%(+23.5)#1,478 |
| 7. | 92122 | 33.7% | 21.1%(+12.6)#339 | 14.8%(+18.9)#1,994 |
| 8. | 92128 | 32.7% | 21.1%(+11.6)#353 | 14.8%(+17.9)#2,134 |
| 9. | 92103 | 31.3% | 21.1%(+10.2)#378 | 14.8%(+16.5)#2,320 |
| 10. | 92109 | 29.6% | 21.1%(+8.50)#412 | 14.8%(+14.8)#2,569 |
| 11. | 92107 | 29.5% | 21.1%(+8.40)#415 | 14.8%(+14.7)#2,585 |
| 12. | 92101 | 29.1% | 21.1%(+8.00)#423 | 14.8%(+14.3)#2,643 |
| 13. | 92120 | 29.1% | 21.1%(+8.00)#425 | 14.8%(+14.3)#2,647 |
| 14. | 92119 | 27.6% | 21.1%(+6.50)#464 | 14.8%(+12.8)#2,931 |
| 15. | 92116 | 22.7% | 21.1%(+1.60)#586 | 14.8%(+7.90)#4,013 |
| 16. | 92126 | 21.0% | 21.1%(-0.100)#630 | 14.8%(+6.20)#4,493 |
| 17. | 92117 | 21.0% | 21.1%(-0.100)#631 | 14.8%(+6.20)#4,498 |
| 18. | 92124 | 20.3% | 21.1%(-0.800)#650 | 14.8%(+5.50)#4,721 |
| 19. | 92110 | 19.4% | 21.1%(-1.70)#681 | 14.8%(+4.60)#5,005 |
| 20. | 92123 | 19.2% | 21.1%(-1.90)#685 | 14.8%(+4.40)#5,075 |
| 21. | 92104 | 17.9% | 21.1%(-3.20)#727 | 14.8%(+3.10)#5,601 |
| 22. | 92108 | 16.0% | 21.1%(-5.10)#786 | 14.8%(+1.20)#6,447 |
| 23. | 92111 | 14.2% | 21.1%(-6.90)#852 | 14.8%(-0.600)#7,423 |
| 24. | 92115 | 12.9% | 21.1%(-8.20)#905 | 14.8%(-1.90)#8,279 |
| 25. | 92154 | 9.6% | 21.1%(-11.5)#1,083 | 14.8%(-5.20)#11,182 |
| 26. | 92114 | 7.7% | 21.1%(-13.4)#1,199 | 14.8%(-7.10)#13,572 |
| 27. | 92139 | 7.2% | 21.1%(-13.9)#1,221 | 14.8%(-7.60)#14,329 |
| 28. | 92105 | 6.4% | 21.1%(-14.7)#1,268 | 14.8%(-8.40)#15,673 |
| 29. | 92102 | 5.7% | 21.1%(-15.4)#1,308 | 14.8%(-9.10)#16,967 |
| 30. | 92113 | 3.2% | 21.1%(-17.9)#1,444 | 14.8%(-11.6)#22,039 |
1
Common Questions
What are the Top 10 Zip Codes with the Highest Percentage of Families with Income Above $200,000 in San Diego, CA?
Top 10 Zip Codes with the Highest Percentage of Families with Income Above $200,000 in San Diego, CA are:
What zip code has the Highest Percentage of Families with Income Above $200,000 in San Diego, CA?
92130 has the Highest Percentage of Families with Income Above $200,000 in San Diego, CA with 55.0%.
What is the Percentage of Families with Income Above $200,000 in San Diego, CA?
Percentage of Families with Income Above $200,000 in San Diego is 24.0%.
What is the Percentage of Families with Income Above $200,000 in California?
Percentage of Families with Income Above $200,000 in California is 21.1%.
What is the Percentage of Families with Income Above $200,000 in the United States?
Percentage of Families with Income Above $200,000 in the United States is 14.8%.