Woodacre, CA Map & Demographics
Woodacre Map
Woodacre Overview
$87,145
PER CAPITA INCOME
$229,750
AVG FAMILY INCOME
$144,632
AVG HOUSEHOLD INCOME
0.44
INEQUALITY / GINI INDEX
1,389
TOTAL POPULATION
789
MALE POPULATION
600
FEMALE POPULATION
131.50
MALES / 100 FEMALES
76.05
FEMALES / 100 MALES
61.2
MEDIAN AGE
2.7
AVG FAMILY SIZE
2.3
AVG HOUSEHOLD SIZE
1,029
LABOR FORCE [ PEOPLE ]
78.7%
PERCENT IN LABOR FORCE
6.2%
UNEMPLOYMENT RATE
Woodacre Zip Codes
Income in Woodacre
Income Overview in Woodacre
Per Capita Income in Woodacre is $87,145, while median incomes of families and households are $229,750 and $144,632 respectively.
| Characteristic | Number | Measure |
| Per Capita Income | 1,389 | $87,145 |
| Median Family Income | 405 | $229,750 |
| Mean Family Income | 405 | $235,220 |
| Median Household Income | 609 | $144,632 |
| Mean Household Income | 609 | $188,501 |
| Income Deficit | 405 | $0 |
| Wage / Income Gap (%) | 1,389 | 0.00% |
| Wage / Income Gap ($) | 1,389 | 100.00¢ per $1 |
| Gini / Inequality Index | 1,389 | 0.44 |
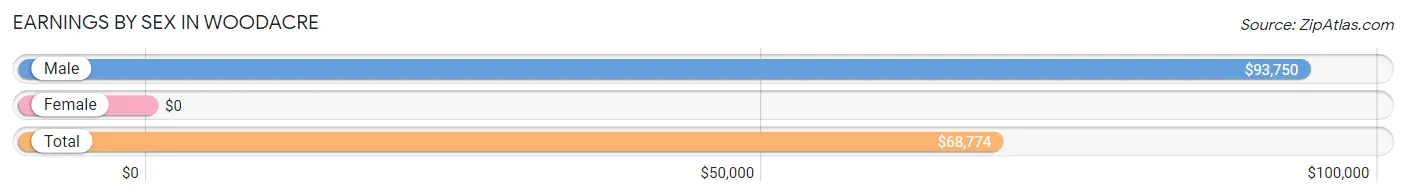
Earnings by Sex in Woodacre
| Sex | Number | Average Earnings |
| Male | 605 (58.0%) | $93,750 |
| Female | 439 (42.0%) | $0 |
| Total | 1,044 (100.0%) | $68,774 |
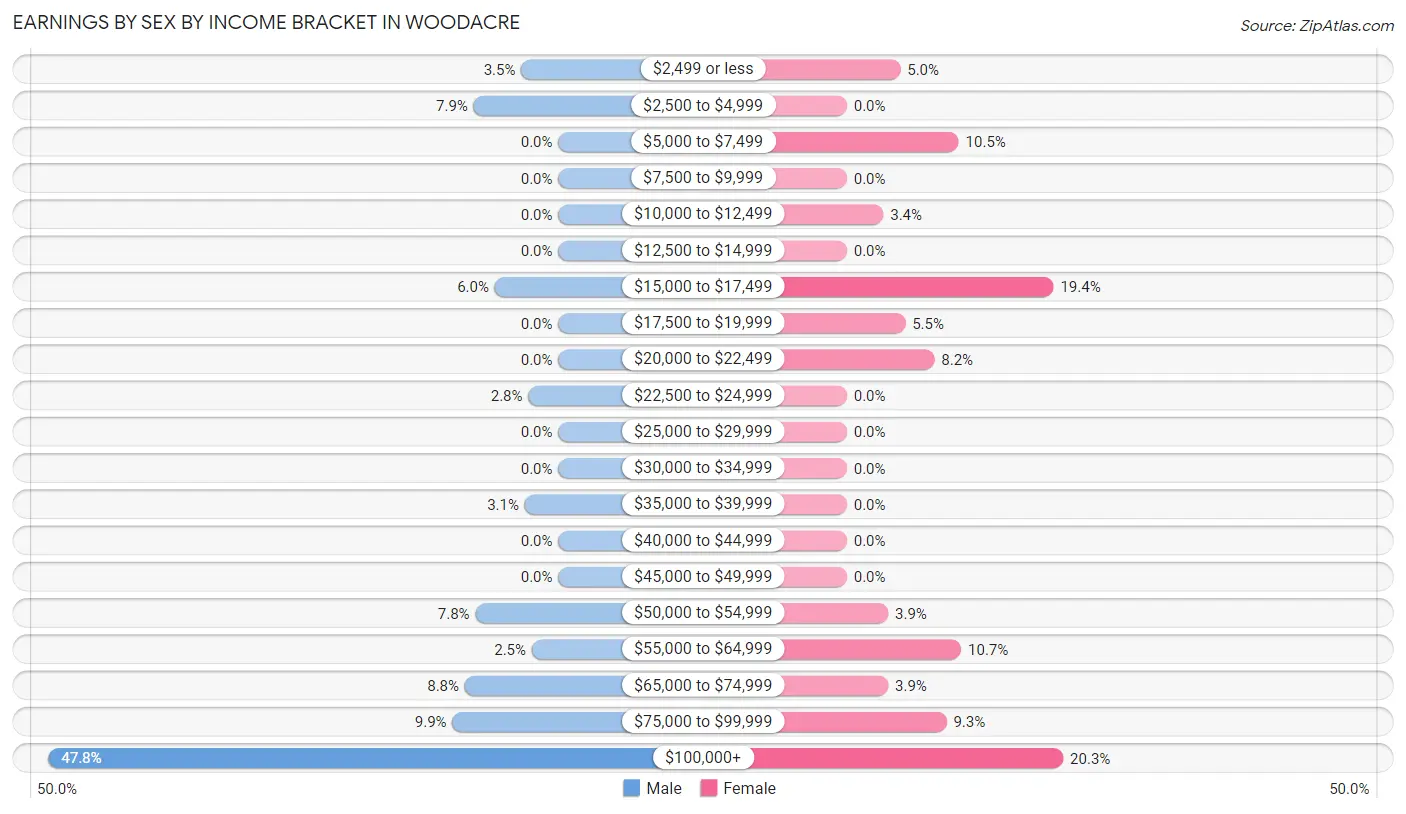
Earnings by Sex by Income Bracket in Woodacre
The most common earnings brackets in Woodacre are $100,000+ for men (289 | 47.8%) and $100,000+ for women (89 | 20.3%).
| Income | Male | Female |
| $2,499 or less | 21 (3.5%) | 22 (5.0%) |
| $2,500 to $4,999 | 48 (7.9%) | 0 (0.0%) |
| $5,000 to $7,499 | 0 (0.0%) | 46 (10.5%) |
| $7,500 to $9,999 | 0 (0.0%) | 0 (0.0%) |
| $10,000 to $12,499 | 0 (0.0%) | 15 (3.4%) |
| $12,500 to $14,999 | 0 (0.0%) | 0 (0.0%) |
| $15,000 to $17,499 | 36 (5.9%) | 85 (19.4%) |
| $17,500 to $19,999 | 0 (0.0%) | 24 (5.5%) |
| $20,000 to $22,499 | 0 (0.0%) | 36 (8.2%) |
| $22,500 to $24,999 | 17 (2.8%) | 0 (0.0%) |
| $25,000 to $29,999 | 0 (0.0%) | 0 (0.0%) |
| $30,000 to $34,999 | 0 (0.0%) | 0 (0.0%) |
| $35,000 to $39,999 | 19 (3.1%) | 0 (0.0%) |
| $40,000 to $44,999 | 0 (0.0%) | 0 (0.0%) |
| $45,000 to $49,999 | 0 (0.0%) | 0 (0.0%) |
| $50,000 to $54,999 | 47 (7.8%) | 17 (3.9%) |
| $55,000 to $64,999 | 15 (2.5%) | 47 (10.7%) |
| $65,000 to $74,999 | 53 (8.8%) | 17 (3.9%) |
| $75,000 to $99,999 | 60 (9.9%) | 41 (9.3%) |
| $100,000+ | 289 (47.8%) | 89 (20.3%) |
| Total | 605 (100.0%) | 439 (100.0%) |
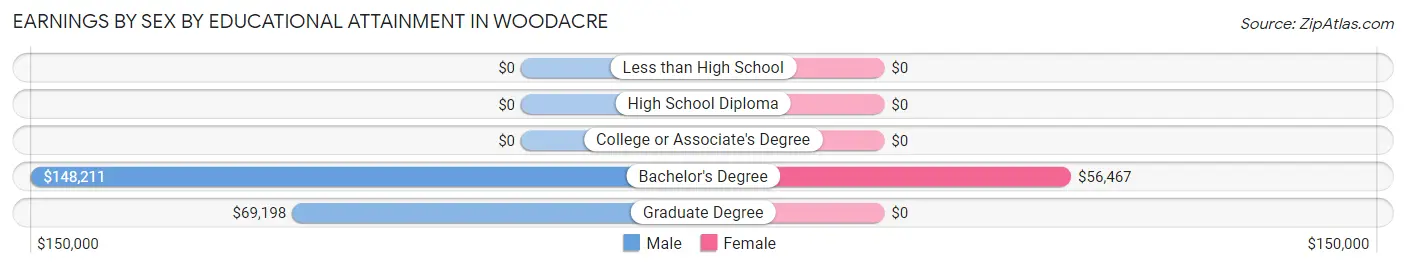
Earnings by Sex by Educational Attainment in Woodacre
Average earnings in Woodacre are $112,950 for men and $55,543 for women, a difference of 50.8%. Men with an educational attainment of bachelor's degree enjoy the highest average annual earnings of $148,211, while those with graduate degree education earn the least with $69,198. Women with an educational attainment of bachelor's degree earn the most with the average annual earnings of $56,467, while those with bachelor's degree education have the smallest earnings of $56,467.
| Educational Attainment | Male Income | Female Income |
| Less than High School | - | - |
| High School Diploma | - | - |
| College or Associate's Degree | - | - |
| Bachelor's Degree | $148,211 | $56,467 |
| Graduate Degree | $69,198 | $0 |
| Total | $112,950 | $55,543 |
Family Income in Woodacre
Family Income Brackets in Woodacre
According to the Woodacre family income data, there are 239 families falling into the $200,000+ income range, which is the most common income bracket and makes up 59.0% of all families.
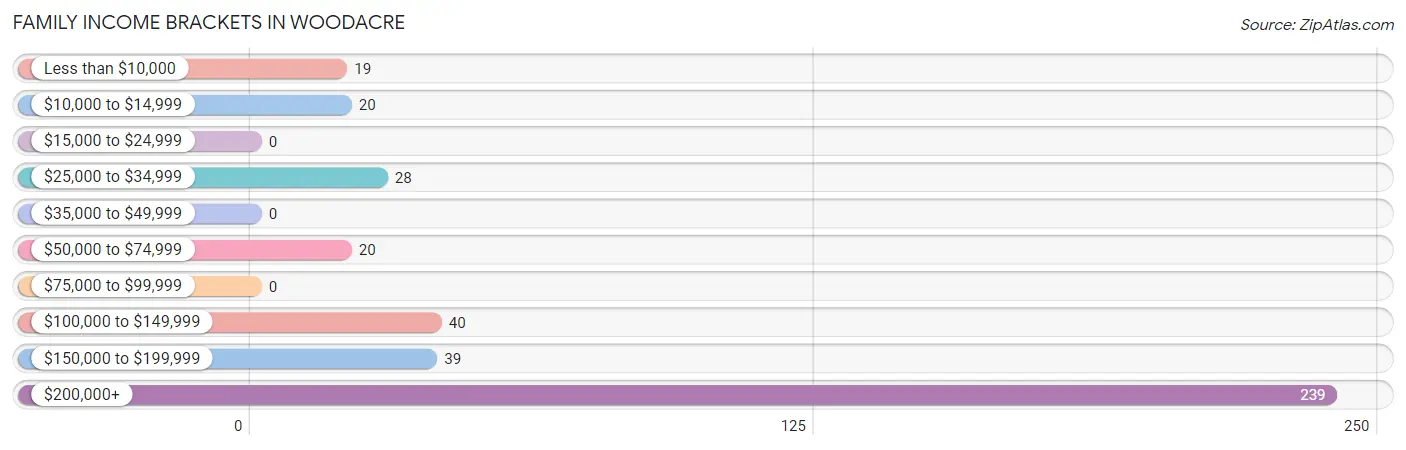
| Income Bracket | # Families | % Families |
| Less than $10,000 | 19 | 4.7% |
| $10,000 to $14,999 | 20 | 4.9% |
| $15,000 to $24,999 | 0 | 0.0% |
| $25,000 to $34,999 | 28 | 6.9% |
| $35,000 to $49,999 | 0 | 0.0% |
| $50,000 to $74,999 | 20 | 4.9% |
| $75,000 to $99,999 | 0 | 0.0% |
| $100,000 to $149,999 | 40 | 9.9% |
| $150,000 to $199,999 | 39 | 9.6% |
| $200,000+ | 239 | 59.0% |
Family Income by Famaliy Size in Woodacre
4-person families (86 | 21.2%) account for the highest median family income in Woodacre with $250,001 per family, while 2-person families (242 | 59.8%) have the highest median income of $84,427 per family member.
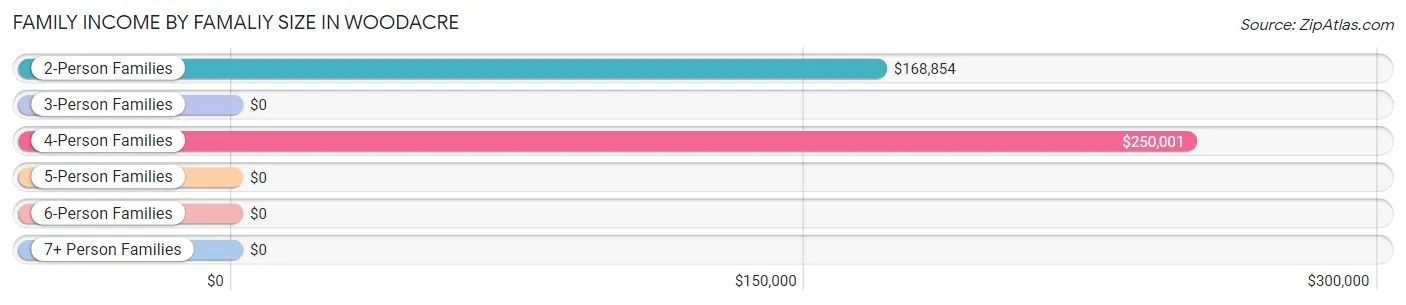
| Income Bracket | # Families | Median Income |
| 2-Person Families | 242 (59.8%) | $168,854 |
| 3-Person Families | 58 (14.3%) | $0 |
| 4-Person Families | 86 (21.2%) | $250,001 |
| 5-Person Families | 19 (4.7%) | $0 |
| 6-Person Families | 0 (0.0%) | $0 |
| 7+ Person Families | 0 (0.0%) | $0 |
| Total | 405 (100.0%) | $229,750 |
Family Income by Number of Earners in Woodacre
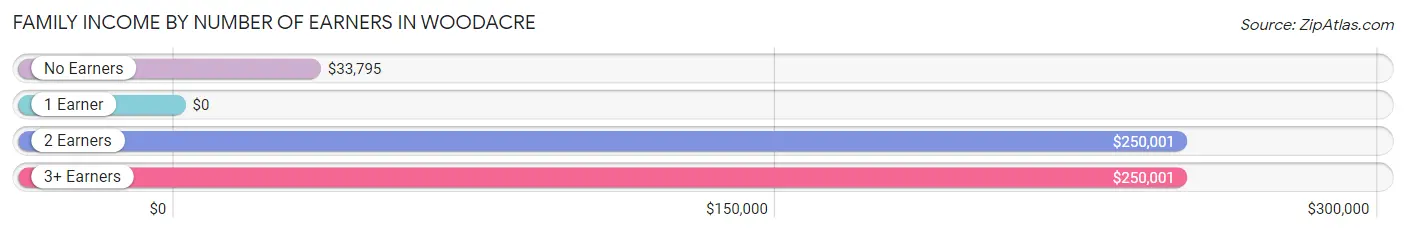
| Number of Earners | # Families | Median Income |
| No Earners | 67 (16.5%) | $33,795 |
| 1 Earner | 54 (13.3%) | $0 |
| 2 Earners | 183 (45.2%) | $250,001 |
| 3+ Earners | 101 (24.9%) | $250,001 |
| Total | 405 (100.0%) | $229,750 |
Household Income in Woodacre
Household Income Brackets in Woodacre
With 287 households falling in the category, the $200,000+ income range is the most frequent in Woodacre, accounting for 47.1% of all households.
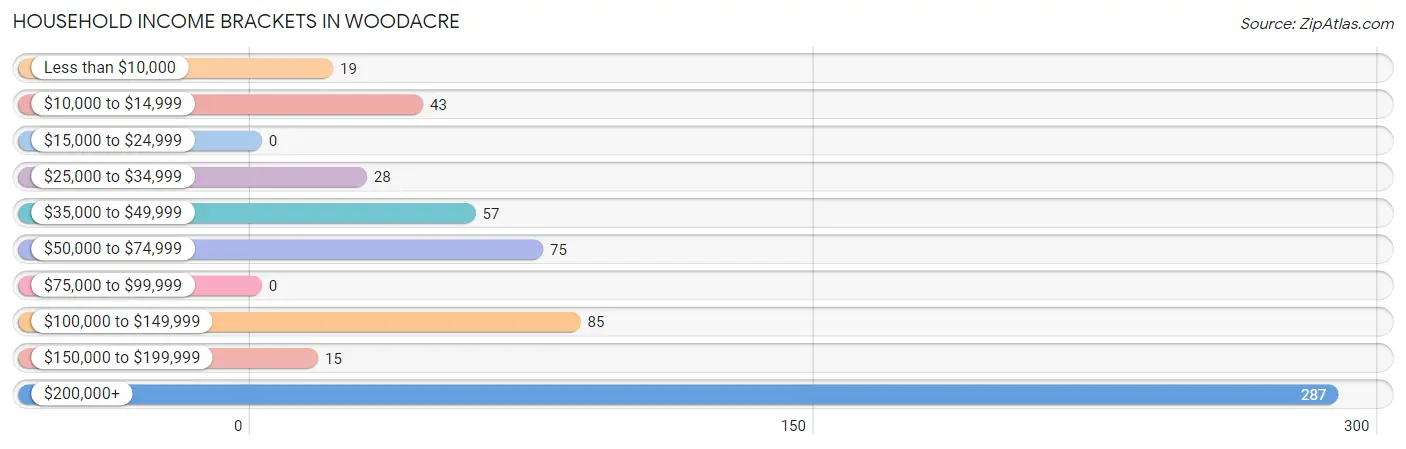
| Income Bracket | # Households | % Households |
| Less than $10,000 | 19 | 3.1% |
| $10,000 to $14,999 | 43 | 7.1% |
| $15,000 to $24,999 | 0 | 0.0% |
| $25,000 to $34,999 | 28 | 4.6% |
| $35,000 to $49,999 | 57 | 9.4% |
| $50,000 to $74,999 | 75 | 12.3% |
| $75,000 to $99,999 | 0 | 0.0% |
| $100,000 to $149,999 | 85 | 14.0% |
| $150,000 to $199,999 | 15 | 2.5% |
| $200,000+ | 287 | 47.1% |
Household Income by Householder Age in Woodacre
The median household income in Woodacre is $144,632, with the highest median household income of $250,001 found in the 45 to 64 years age bracket for the primary householder. A total of 240 households (39.4%) fall into this category.
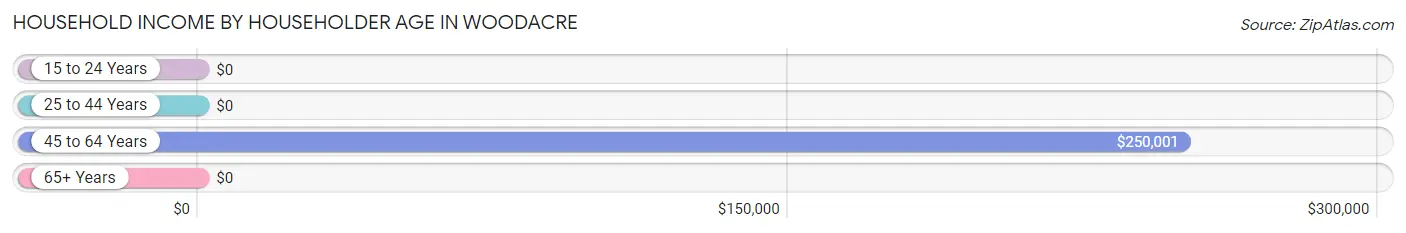
| Income Bracket | # Households | Median Income |
| 15 to 24 Years | 0 (0.0%) | $0 |
| 25 to 44 Years | 61 (10.0%) | $0 |
| 45 to 64 Years | 240 (39.4%) | $250,001 |
| 65+ Years | 308 (50.6%) | $0 |
| Total | 609 (100.0%) | $144,632 |
Poverty in Woodacre
Income Below Poverty by Sex and Age in Woodacre
With 4.1% poverty level for males and 12.8% for females among the residents of Woodacre, under 5 year old males and under 5 year old females are the most vulnerable to poverty, with 10 males (100.0%) and 15 females (100.0%) in their respective age groups living below the poverty level.
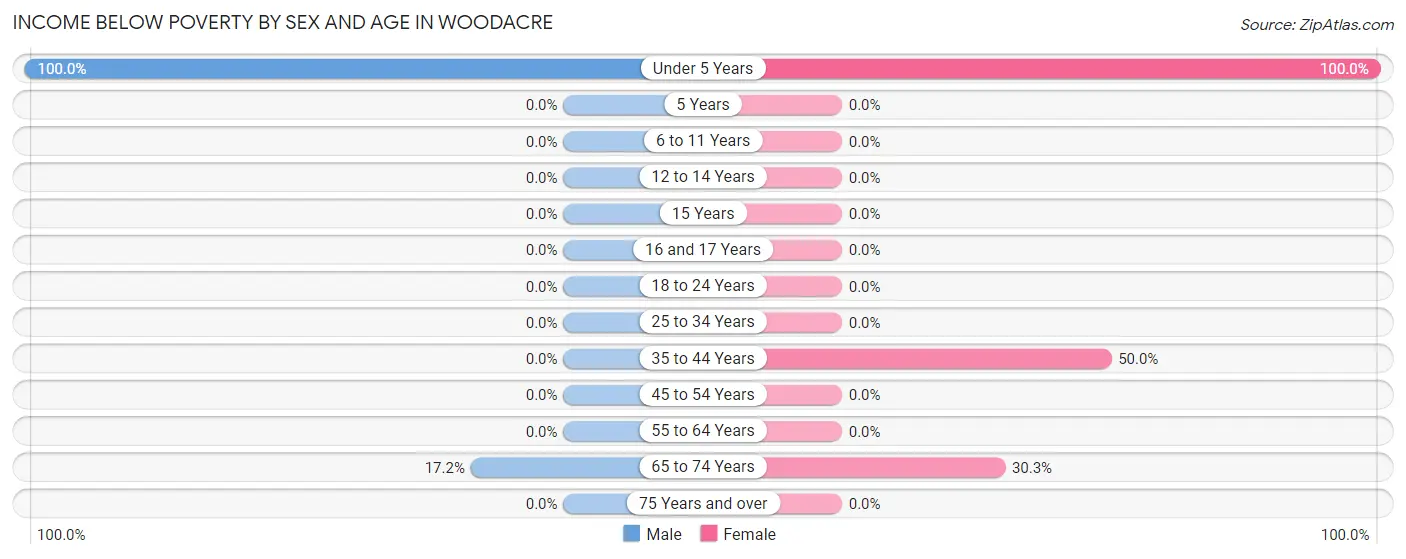
| Age Bracket | Male | Female |
| Under 5 Years | 10 (100.0%) | 15 (100.0%) |
| 5 Years | 0 (0.0%) | 0 (0.0%) |
| 6 to 11 Years | 0 (0.0%) | 0 (0.0%) |
| 12 to 14 Years | 0 (0.0%) | 0 (0.0%) |
| 15 Years | 0 (0.0%) | 0 (0.0%) |
| 16 and 17 Years | 0 (0.0%) | 0 (0.0%) |
| 18 to 24 Years | 0 (0.0%) | 0 (0.0%) |
| 25 to 34 Years | 0 (0.0%) | 0 (0.0%) |
| 35 to 44 Years | 0 (0.0%) | 19 (50.0%) |
| 45 to 54 Years | 0 (0.0%) | 0 (0.0%) |
| 55 to 64 Years | 0 (0.0%) | 0 (0.0%) |
| 65 to 74 Years | 22 (17.2%) | 43 (30.3%) |
| 75 Years and over | 0 (0.0%) | 0 (0.0%) |
| Total | 32 (4.1%) | 77 (12.8%) |
Income Above Poverty by Sex and Age in Woodacre
According to the poverty statistics in Woodacre, males aged 6 to 11 years and females aged 6 to 11 years are the age groups that are most secure financially, with 100.0% of males and 100.0% of females in these age groups living above the poverty line.
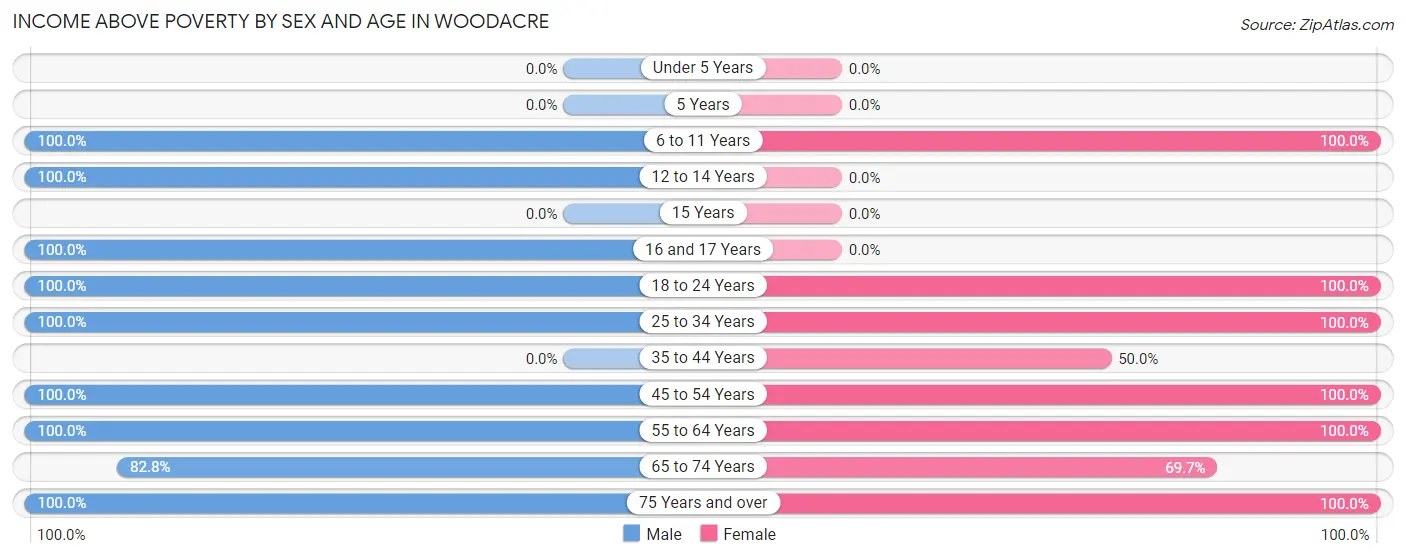
| Age Bracket | Male | Female |
| Under 5 Years | 0 (0.0%) | 0 (0.0%) |
| 5 Years | 0 (0.0%) | 0 (0.0%) |
| 6 to 11 Years | 18 (100.0%) | 19 (100.0%) |
| 12 to 14 Years | 19 (100.0%) | 0 (0.0%) |
| 15 Years | 0 (0.0%) | 0 (0.0%) |
| 16 and 17 Years | 20 (100.0%) | 0 (0.0%) |
| 18 to 24 Years | 36 (100.0%) | 61 (100.0%) |
| 25 to 34 Years | 115 (100.0%) | 40 (100.0%) |
| 35 to 44 Years | 0 (0.0%) | 19 (50.0%) |
| 45 to 54 Years | 63 (100.0%) | 17 (100.0%) |
| 55 to 64 Years | 233 (100.0%) | 215 (100.0%) |
| 65 to 74 Years | 106 (82.8%) | 99 (69.7%) |
| 75 Years and over | 147 (100.0%) | 53 (100.0%) |
| Total | 757 (95.9%) | 523 (87.2%) |
Income Below Poverty Among Married-Couple Families in Woodacre
The poverty statistics for married-couple families in Woodacre show that 5.4% or 20 of the total 371 families live below the poverty line. Families with no children have the highest poverty rate of 6.1%, comprising of 20 families. On the other hand, families with 1 or 2 children have the lowest poverty rate of 0.0%, which includes 0 families.
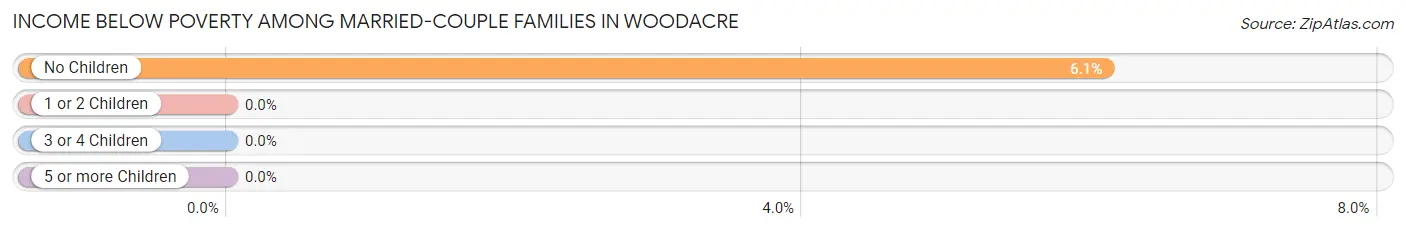
| Children | Above Poverty | Below Poverty |
| No Children | 308 (93.9%) | 20 (6.1%) |
| 1 or 2 Children | 24 (100.0%) | 0 (0.0%) |
| 3 or 4 Children | 19 (100.0%) | 0 (0.0%) |
| 5 or more Children | 0 (0.0%) | 0 (0.0%) |
| Total | 351 (94.6%) | 20 (5.4%) |
Income Below Poverty Among Single-Parent Households in Woodacre
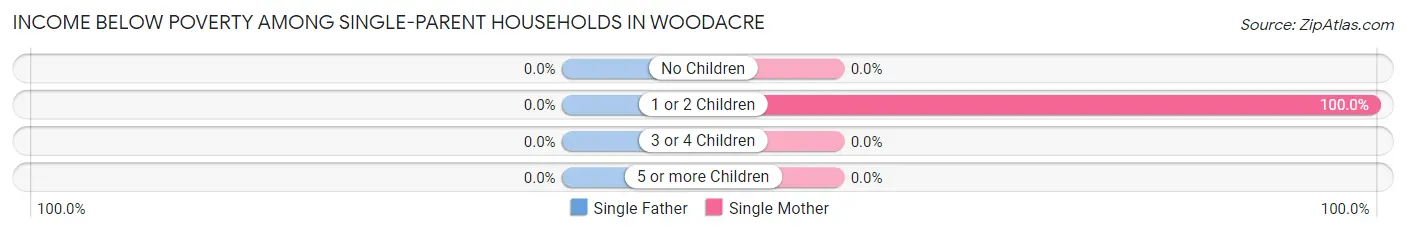
| Children | Single Father | Single Mother |
| No Children | 0 (0.0%) | 0 (0.0%) |
| 1 or 2 Children | 0 (0.0%) | 19 (100.0%) |
| 3 or 4 Children | 0 (0.0%) | 0 (0.0%) |
| 5 or more Children | 0 (0.0%) | 0 (0.0%) |
| Total | 0 (0.0%) | 19 (100.0%) |
Income Below Poverty Among Married-Couple vs Single-Parent Households in Woodacre
The poverty data for Woodacre shows that 20 of the married-couple family households (5.4%) and 19 of the single-parent households (55.9%) are living below the poverty level. Within the married-couple family households, those with no children have the highest poverty rate, with 20 households (6.1%) falling below the poverty line. Among the single-parent households, those with 1 or 2 children have the highest poverty rate, with 19 household (100.0%) living below poverty.
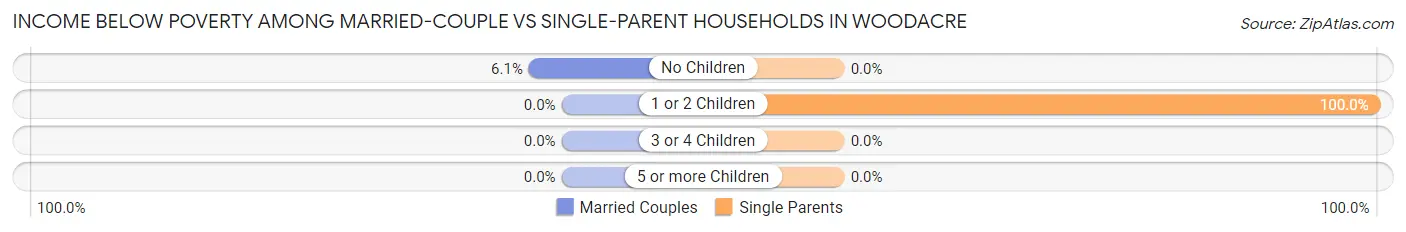
| Children | Married-Couple Families | Single-Parent Households |
| No Children | 20 (6.1%) | 0 (0.0%) |
| 1 or 2 Children | 0 (0.0%) | 19 (100.0%) |
| 3 or 4 Children | 0 (0.0%) | 0 (0.0%) |
| 5 or more Children | 0 (0.0%) | 0 (0.0%) |
| Total | 20 (5.4%) | 19 (55.9%) |
Race in Woodacre
The most populous races in Woodacre are White / Caucasian (1,228 | 88.4%), Two or more Races (144 | 10.4%), and Hawaiian / Pacific (17 | 1.2%).
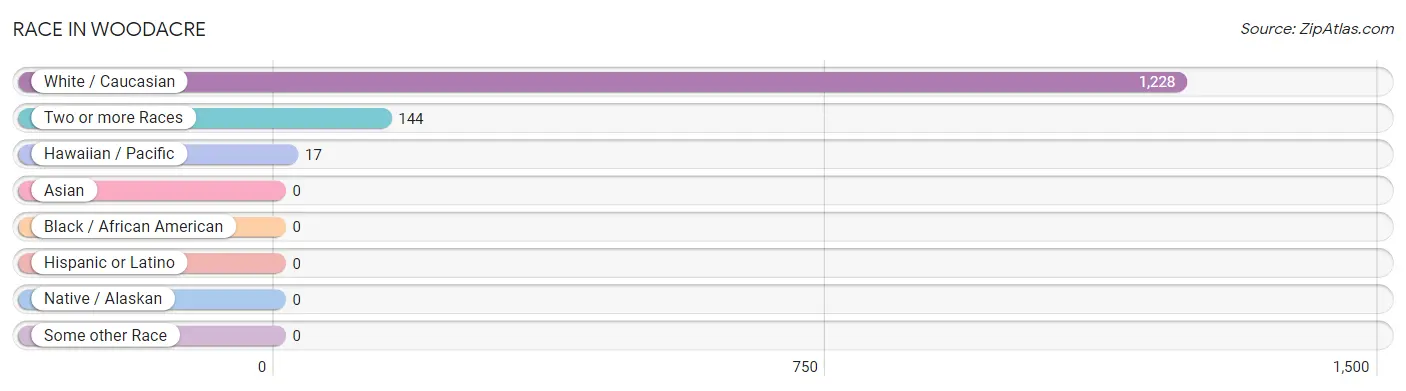
| Race | # Population | % Population |
| Asian | 0 | 0.0% |
| Black / African American | 0 | 0.0% |
| Hawaiian / Pacific | 17 | 1.2% |
| Hispanic or Latino | 0 | 0.0% |
| Native / Alaskan | 0 | 0.0% |
| White / Caucasian | 1,228 | 88.4% |
| Two or more Races | 144 | 10.4% |
| Some other Race | 0 | 0.0% |
| Total | 1,389 | 100.0% |
Ancestry in Woodacre
The most populous ancestries reported in Woodacre are European (259 | 18.6%), English (213 | 15.3%), German (163 | 11.7%), Russian (135 | 9.7%), and French (55 | 4.0%), together accounting for 59.4% of all Woodacre residents.
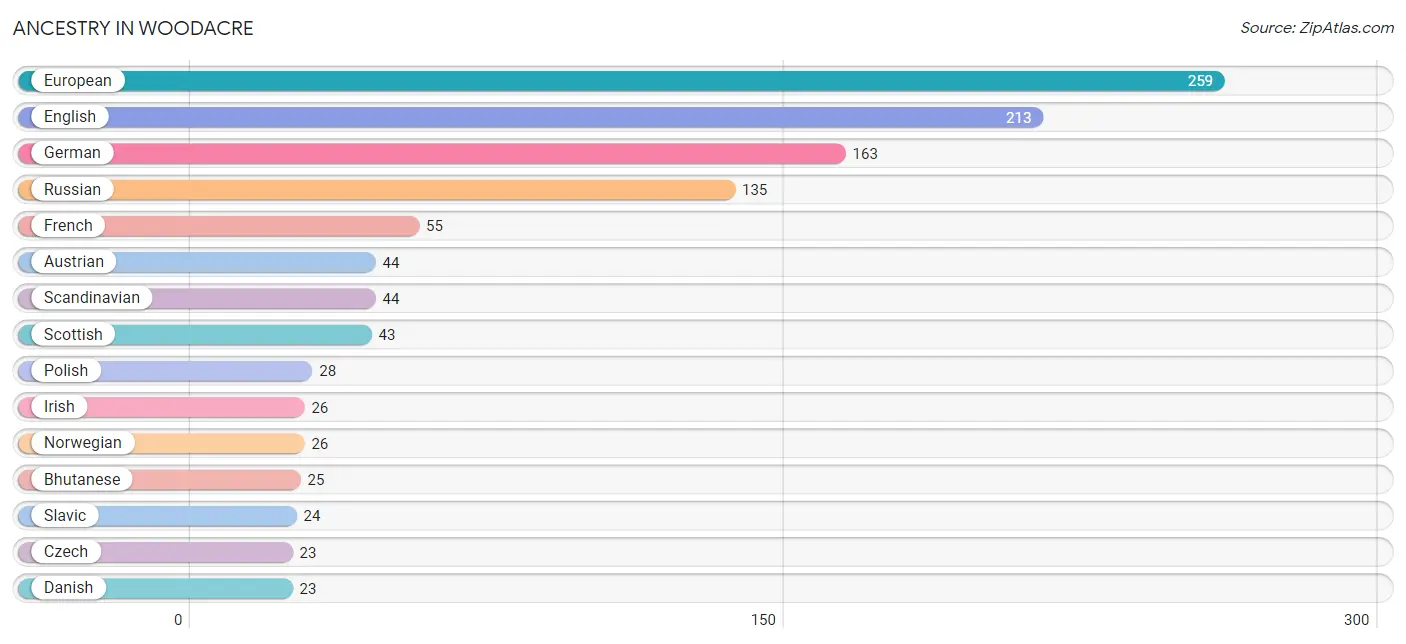
| Ancestry | # Population | % Population |
| Austrian | 44 | 3.2% |
| Bhutanese | 25 | 1.8% |
| Czech | 23 | 1.7% |
| Danish | 23 | 1.7% |
| Eastern European | 11 | 0.8% |
| English | 213 | 15.3% |
| European | 259 | 18.6% |
| French | 55 | 4.0% |
| German | 163 | 11.7% |
| Irish | 26 | 1.9% |
| Italian | 23 | 1.7% |
| Native Hawaiian | 17 | 1.2% |
| Norwegian | 26 | 1.9% |
| Polish | 28 | 2.0% |
| Russian | 135 | 9.7% |
| Scandinavian | 44 | 3.2% |
| Scottish | 43 | 3.1% |
| Slavic | 24 | 1.7% |
| Swedish | 20 | 1.4% | View All 19 Rows |
Immigrants in Woodacre
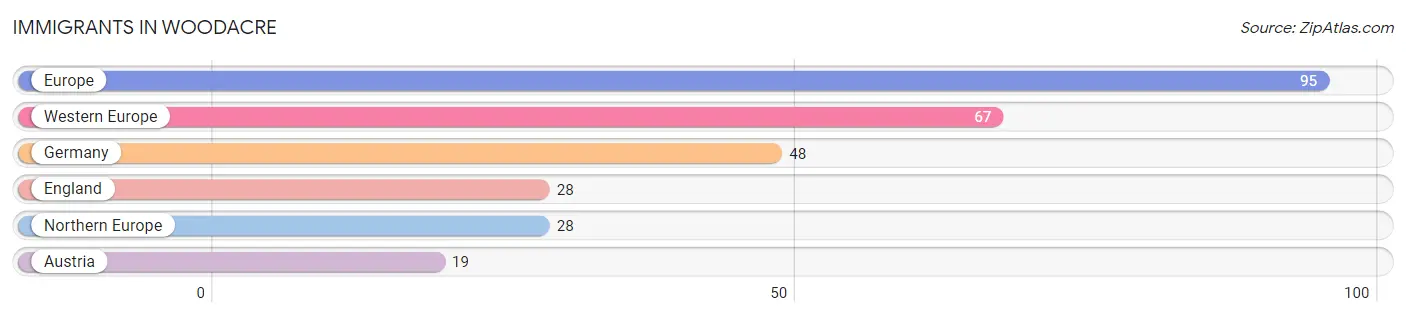
The most numerous immigrant groups reported in Woodacre came from Europe (95 | 6.8%), Western Europe (67 | 4.8%), Germany (48 | 3.5%), England (28 | 2.0%), and Northern Europe (28 | 2.0%), together accounting for 19.2% of all Woodacre residents.
| Immigration Origin | # Population | % Population |
| Austria | 19 | 1.4% |
| England | 28 | 2.0% |
| Europe | 95 | 6.8% |
| Germany | 48 | 3.5% |
| Northern Europe | 28 | 2.0% |
| Western Europe | 67 | 4.8% | View All 6 Rows |
Sex and Age in Woodacre
Sex and Age in Woodacre
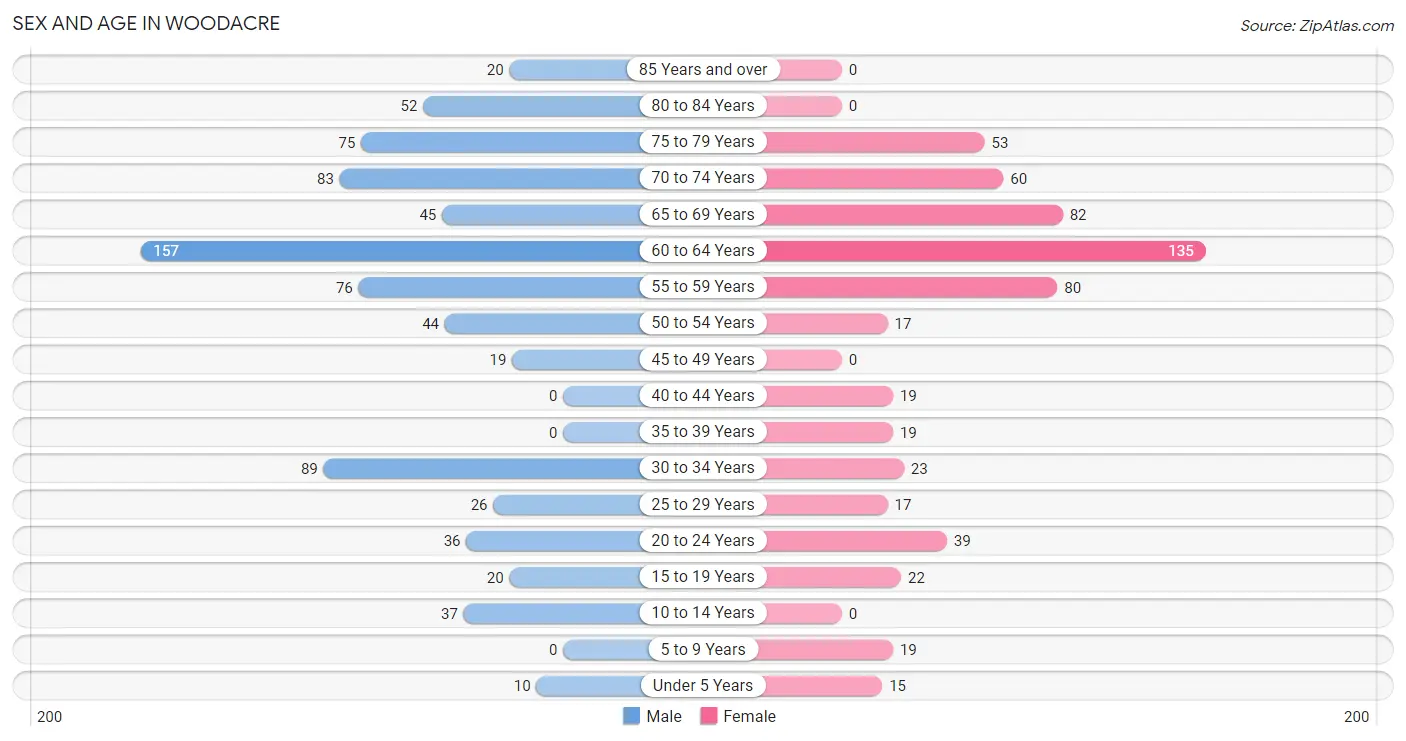
The most populous age groups in Woodacre are 60 to 64 Years (157 | 19.9%) for men and 60 to 64 Years (135 | 22.5%) for women.
| Age Bracket | Male | Female |
| Under 5 Years | 10 (1.3%) | 15 (2.5%) |
| 5 to 9 Years | 0 (0.0%) | 19 (3.2%) |
| 10 to 14 Years | 37 (4.7%) | 0 (0.0%) |
| 15 to 19 Years | 20 (2.5%) | 22 (3.7%) |
| 20 to 24 Years | 36 (4.6%) | 39 (6.5%) |
| 25 to 29 Years | 26 (3.3%) | 17 (2.8%) |
| 30 to 34 Years | 89 (11.3%) | 23 (3.8%) |
| 35 to 39 Years | 0 (0.0%) | 19 (3.2%) |
| 40 to 44 Years | 0 (0.0%) | 19 (3.2%) |
| 45 to 49 Years | 19 (2.4%) | 0 (0.0%) |
| 50 to 54 Years | 44 (5.6%) | 17 (2.8%) |
| 55 to 59 Years | 76 (9.6%) | 80 (13.3%) |
| 60 to 64 Years | 157 (19.9%) | 135 (22.5%) |
| 65 to 69 Years | 45 (5.7%) | 82 (13.7%) |
| 70 to 74 Years | 83 (10.5%) | 60 (10.0%) |
| 75 to 79 Years | 75 (9.5%) | 53 (8.8%) |
| 80 to 84 Years | 52 (6.6%) | 0 (0.0%) |
| 85 Years and over | 20 (2.5%) | 0 (0.0%) |
| Total | 789 (100.0%) | 600 (100.0%) |
Families and Households in Woodacre
Median Family Size in Woodacre
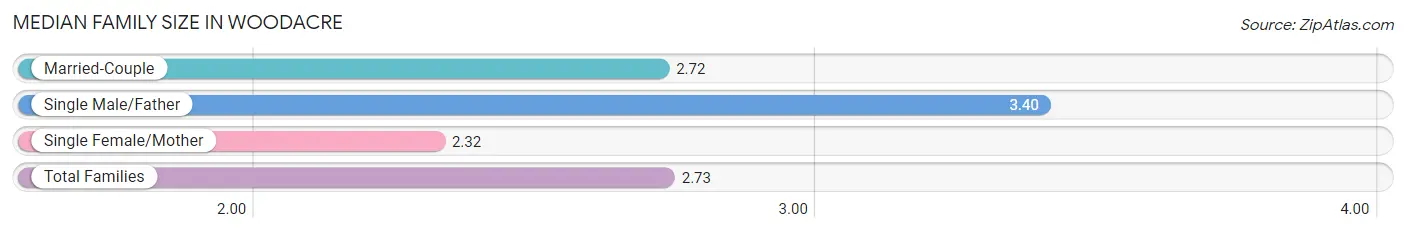
The median family size in Woodacre is 2.73 persons per family, with single male/father families (15 | 3.7%) accounting for the largest median family size of 3.4 persons per family. On the other hand, single female/mother families (19 | 4.7%) represent the smallest median family size with 2.32 persons per family.
| Family Type | # Families | Family Size |
| Married-Couple | 371 (91.6%) | 2.72 |
| Single Male/Father | 15 (3.7%) | 3.40 |
| Single Female/Mother | 19 (4.7%) | 2.32 |
| Total Families | 405 (100.0%) | 2.73 |
Median Household Size in Woodacre
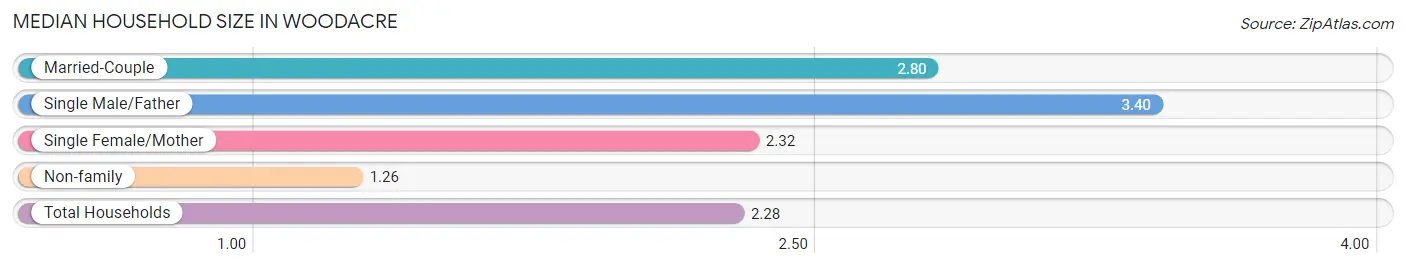
The median household size in Woodacre is 2.28 persons per household, with single male/father households (15 | 2.5%) accounting for the largest median household size of 3.4 persons per household. non-family households (204 | 33.5%) represent the smallest median household size with 1.26 persons per household.
| Household Type | # Households | Household Size |
| Married-Couple | 371 (60.9%) | 2.80 |
| Single Male/Father | 15 (2.5%) | 3.40 |
| Single Female/Mother | 19 (3.1%) | 2.32 |
| Non-family | 204 (33.5%) | 1.26 |
| Total Households | 609 (100.0%) | 2.28 |
Household Size by Marriage Status in Woodacre
Out of a total of 609 households in Woodacre, 405 (66.5%) are family households, while 204 (33.5%) are nonfamily households. The most numerous type of family households are 2-person households, comprising 218, and the most common type of nonfamily households are 1-person households, comprising 160.
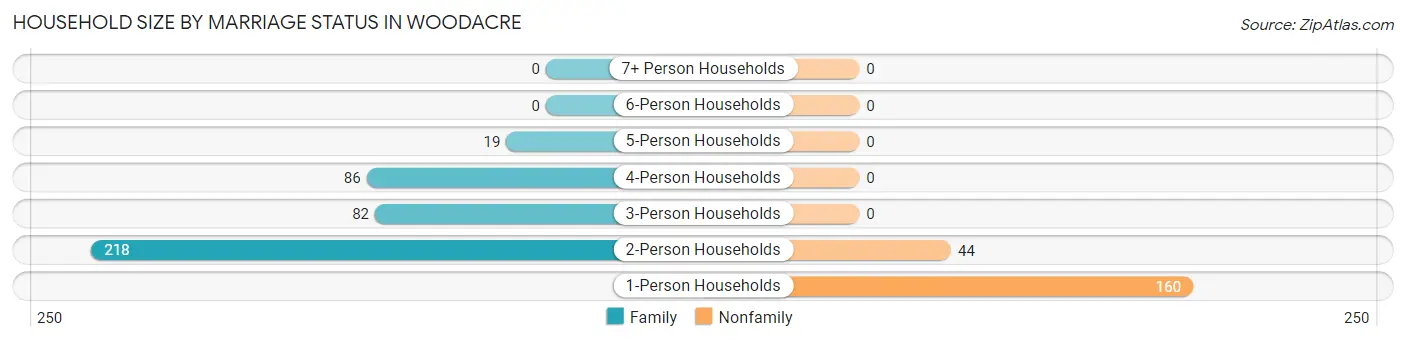
| Household Size | Family Households | Nonfamily Households |
| 1-Person Households | - | 160 (26.3%) |
| 2-Person Households | 218 (35.8%) | 44 (7.2%) |
| 3-Person Households | 82 (13.5%) | 0 (0.0%) |
| 4-Person Households | 86 (14.1%) | 0 (0.0%) |
| 5-Person Households | 19 (3.1%) | 0 (0.0%) |
| 6-Person Households | 0 (0.0%) | 0 (0.0%) |
| 7+ Person Households | 0 (0.0%) | 0 (0.0%) |
| Total | 405 (66.5%) | 204 (33.5%) |
Female Fertility in Woodacre
Fertility by Age in Woodacre
| Age Bracket | Women with Births | Births / 1,000 Women |
| 15 to 19 years | 0 (0.0%) | 0.0 |
| 20 to 34 years | 0 (0.0%) | 0.0 |
| 35 to 50 years | 0 (0.0%) | 0.0 |
| Total | 0 (0.0%) | 0.0 |
Fertility by Age by Marriage Status in Woodacre
| Age Bracket | Married | Unmarried |
| 15 to 19 years | 0 (0.0%) | 0 (0.0%) |
| 20 to 34 years | 0 (0.0%) | 0 (0.0%) |
| 35 to 50 years | 0 (0.0%) | 0 (0.0%) |
| Total | 0 (0.0%) | 0 (0.0%) |
Fertility by Education in Woodacre
| Educational Attainment | Women with Births | Births / 1,000 Women |
| Less than High School | 0 (0.0%) | 0.0 |
| High School Diploma | 0 (0.0%) | 0.0 |
| College or Associate's Degree | 0 (0.0%) | 0.0 |
| Bachelor's Degree | 0 (0.0%) | 0.0 |
| Graduate Degree | 0 (0.0%) | 0.0 |
| Total | 0 (0.0%) | 0.0 |
Fertility by Education by Marriage Status in Woodacre
| Educational Attainment | Married | Unmarried |
| Less than High School | 0 (0.0%) | 0 (0.0%) |
| High School Diploma | 0 (0.0%) | 0 (0.0%) |
| College or Associate's Degree | 0 (0.0%) | 0 (0.0%) |
| Bachelor's Degree | 0 (0.0%) | 0 (0.0%) |
| Graduate Degree | 0 (0.0%) | 0 (0.0%) |
| Total | 0 (0.0%) | 0 (0.0%) |
Employment Characteristics in Woodacre
Employment by Class of Employer in Woodacre
Among the 965 employed individuals in Woodacre, private company employees (485 | 50.3%), self-employed (not incorporated) (224 | 23.2%), and self-employed (incorporated) (103 | 10.7%) make up the most common classes of employment.
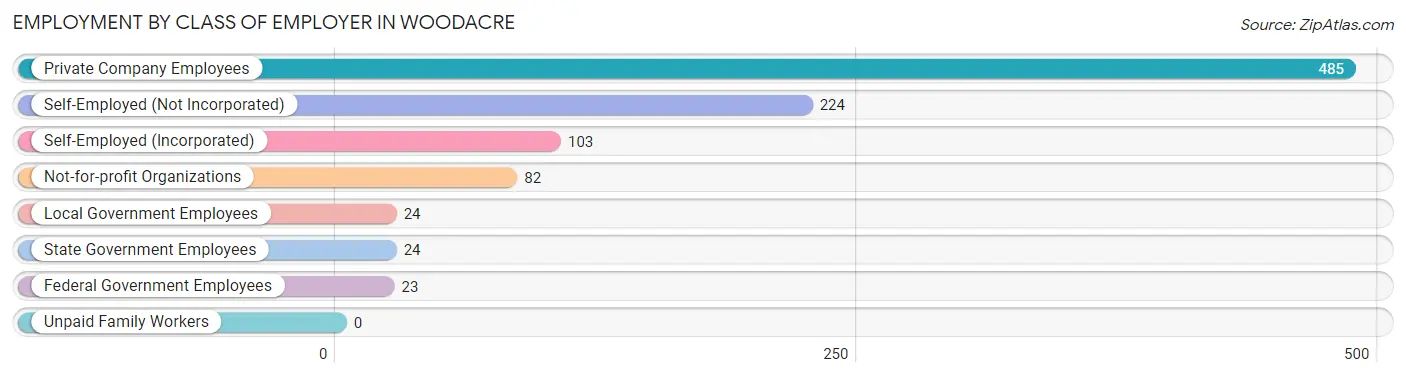
| Employer Class | # Employees | % Employees |
| Private Company Employees | 485 | 50.3% |
| Self-Employed (Incorporated) | 103 | 10.7% |
| Self-Employed (Not Incorporated) | 224 | 23.2% |
| Not-for-profit Organizations | 82 | 8.5% |
| Local Government Employees | 24 | 2.5% |
| State Government Employees | 24 | 2.5% |
| Federal Government Employees | 23 | 2.4% |
| Unpaid Family Workers | 0 | 0.0% |
| Total | 965 | 100.0% |
Employment Status by Age in Woodacre
According to the labor force statistics for Woodacre, out of the total population over 16 years of age (1,308), 78.7% or 1,029 individuals are in the labor force, with 6.2% or 64 of them unemployed. The age group with the highest labor force participation rate is 20 to 24 years, with 100.0% or 75 individuals in the labor force. Within the labor force, the 65 to 74 years age range has the highest percentage of unemployed individuals, with 16.9% or 36 of them being unemployed.
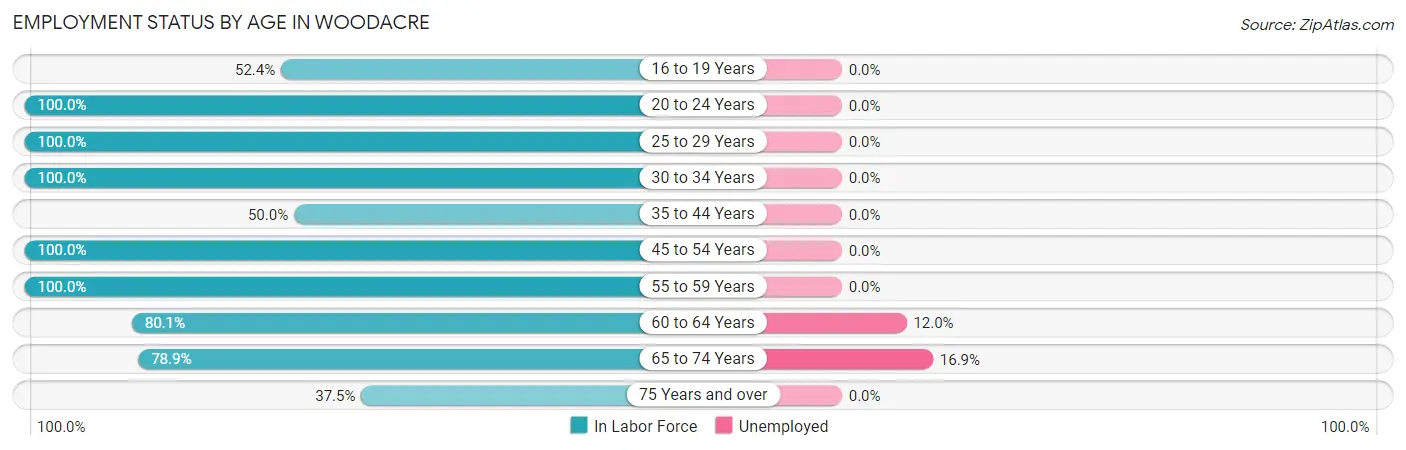
| Age Bracket | In Labor Force | Unemployed |
| 16 to 19 Years | 22 (52.4%) | 0 (0.0%) |
| 20 to 24 Years | 75 (100.0%) | 0 (0.0%) |
| 25 to 29 Years | 43 (100.0%) | 0 (0.0%) |
| 30 to 34 Years | 112 (100.0%) | 0 (0.0%) |
| 35 to 44 Years | 19 (50.0%) | 0 (0.0%) |
| 45 to 54 Years | 80 (100.0%) | 0 (0.0%) |
| 55 to 59 Years | 156 (100.0%) | 0 (0.0%) |
| 60 to 64 Years | 234 (80.1%) | 28 (12.0%) |
| 65 to 74 Years | 213 (78.9%) | 36 (16.9%) |
| 75 Years and over | 75 (37.5%) | 0 (0.0%) |
| Total | 1,029 (78.7%) | 64 (6.2%) |
Employment Status by Educational Attainment in Woodacre
According to labor force statistics for Woodacre, 89.3% of individuals (644) out of the total population between 25 and 64 years of age (721) are in the labor force, with 4.3% or 28 of them being unemployed. The group with the highest labor force participation rate are those with the educational attainment of less than high school, with 100.0% or 27 individuals in the labor force. Within the labor force, individuals with bachelor's degree or higher education have the highest percentage of unemployment, with 5.9% or 28 of them being unemployed.
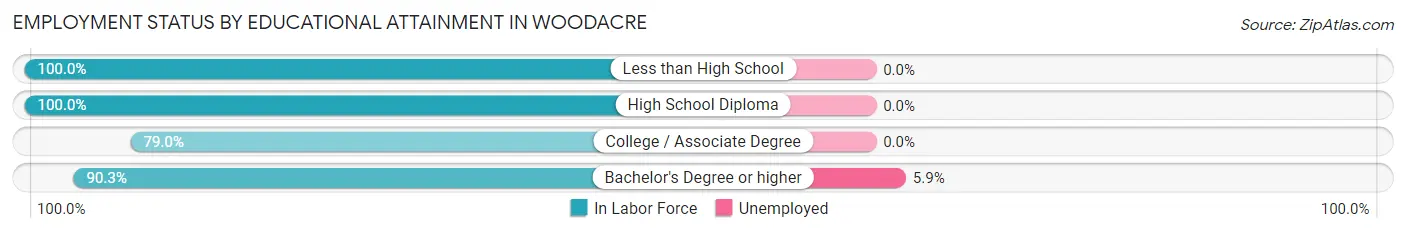
| Educational Attainment | In Labor Force | Unemployed |
| Less than High School | 27 (100.0%) | 0 (0.0%) |
| High School Diploma | 46 (100.0%) | 0 (0.0%) |
| College / Associate Degree | 98 (79.0%) | 0 (0.0%) |
| Bachelor's Degree or higher | 473 (90.3%) | 31 (5.9%) |
| Total | 644 (89.3%) | 31 (4.3%) |
Employment Occupations by Sex in Woodacre
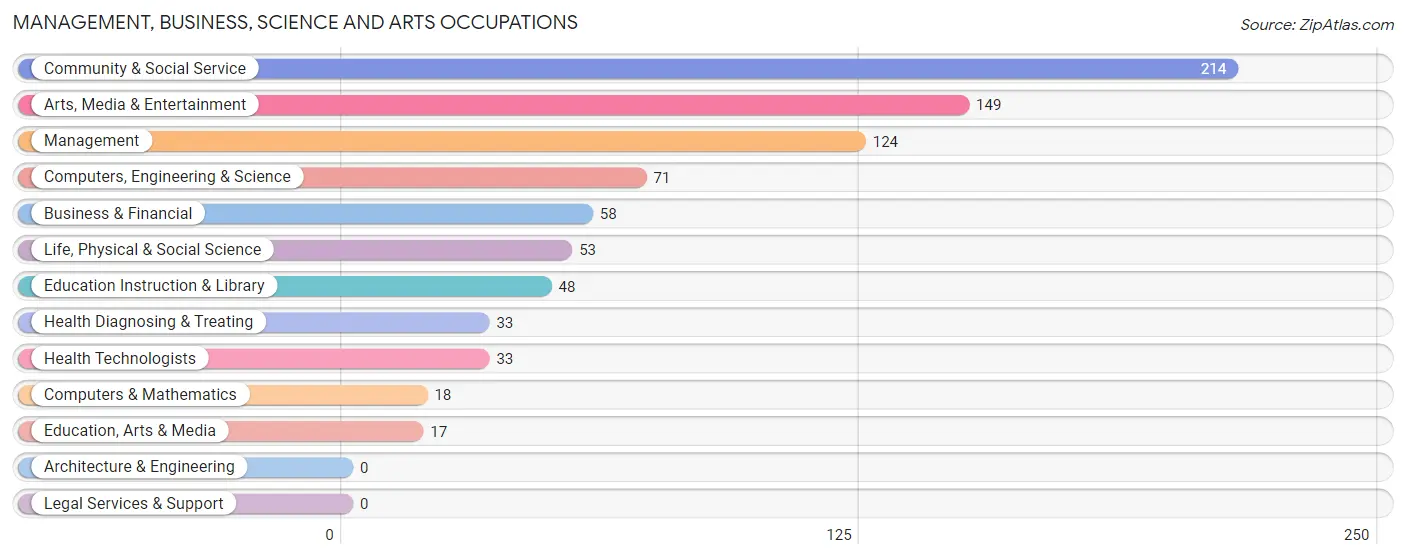
Management, Business, Science and Arts Occupations
The most common Management, Business, Science and Arts occupations in Woodacre are Community & Social Service (214 | 22.2%), Arts, Media & Entertainment (149 | 15.4%), Management (124 | 12.9%), Computers, Engineering & Science (71 | 7.4%), and Business & Financial (58 | 6.0%).
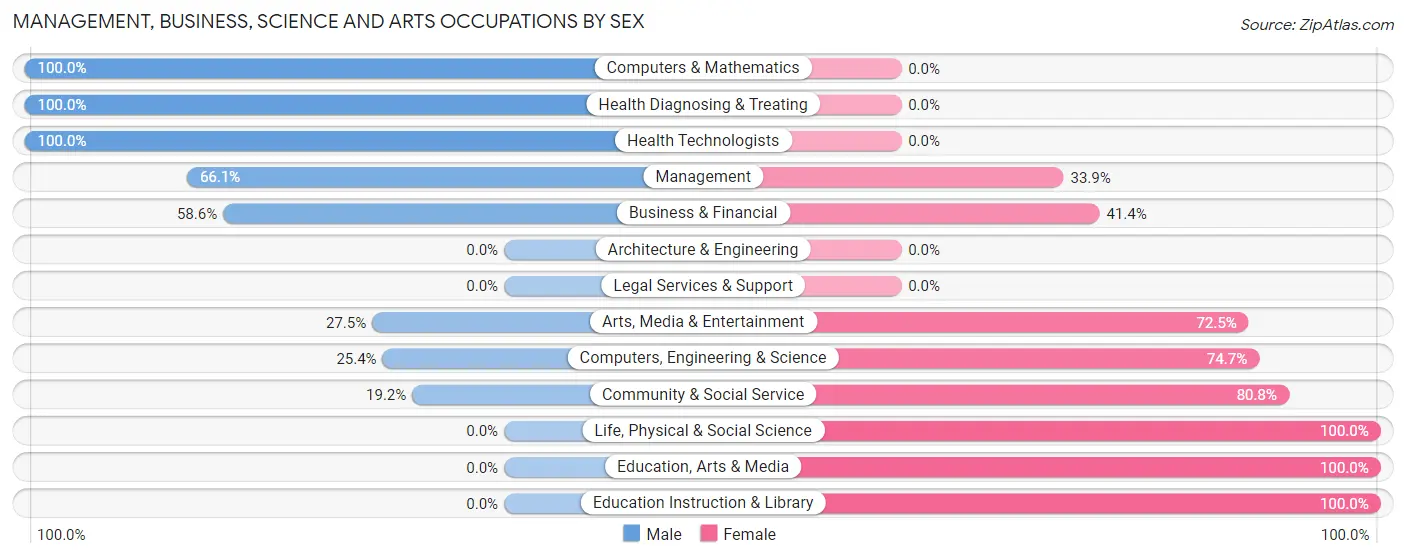
Management, Business, Science and Arts Occupations by Sex
Within the Management, Business, Science and Arts occupations in Woodacre, the most male-oriented occupations are Computers & Mathematics (100.0%), Health Diagnosing & Treating (100.0%), and Health Technologists (100.0%), while the most female-oriented occupations are Life, Physical & Social Science (100.0%), Education, Arts & Media (100.0%), and Education Instruction & Library (100.0%).
| Occupation | Male | Female |
| Management | 82 (66.1%) | 42 (33.9%) |
| Business & Financial | 34 (58.6%) | 24 (41.4%) |
| Computers, Engineering & Science | 18 (25.4%) | 53 (74.7%) |
| Computers & Mathematics | 18 (100.0%) | 0 (0.0%) |
| Architecture & Engineering | 0 (0.0%) | 0 (0.0%) |
| Life, Physical & Social Science | 0 (0.0%) | 53 (100.0%) |
| Community & Social Service | 41 (19.2%) | 173 (80.8%) |
| Education, Arts & Media | 0 (0.0%) | 17 (100.0%) |
| Legal Services & Support | 0 (0.0%) | 0 (0.0%) |
| Education Instruction & Library | 0 (0.0%) | 48 (100.0%) |
| Arts, Media & Entertainment | 41 (27.5%) | 108 (72.5%) |
| Health Diagnosing & Treating | 33 (100.0%) | 0 (0.0%) |
| Health Technologists | 33 (100.0%) | 0 (0.0%) |
| Total (Category) | 208 (41.6%) | 292 (58.4%) |
| Total (Overall) | 562 (58.2%) | 403 (41.8%) |
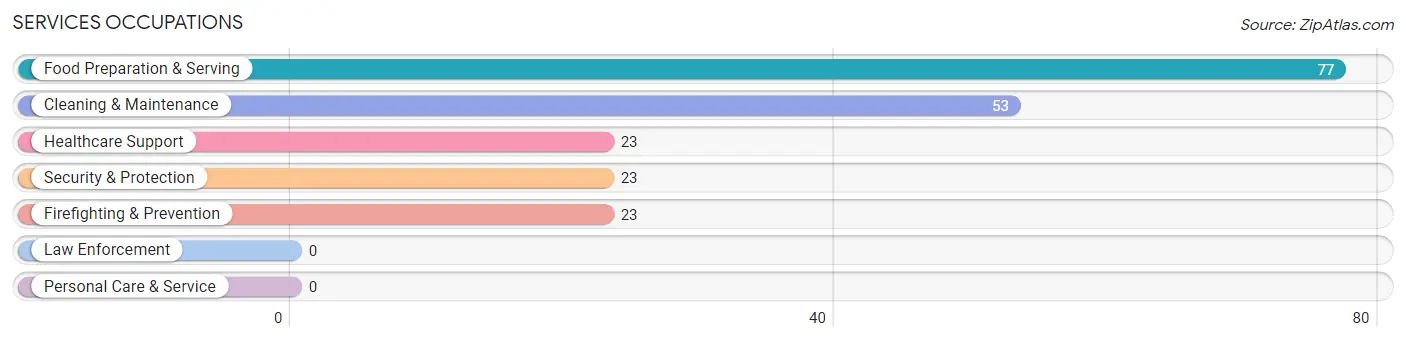
Services Occupations
The most common Services occupations in Woodacre are Food Preparation & Serving (77 | 8.0%), Cleaning & Maintenance (53 | 5.5%), Healthcare Support (23 | 2.4%), Security & Protection (23 | 2.4%), and Firefighting & Prevention (23 | 2.4%).
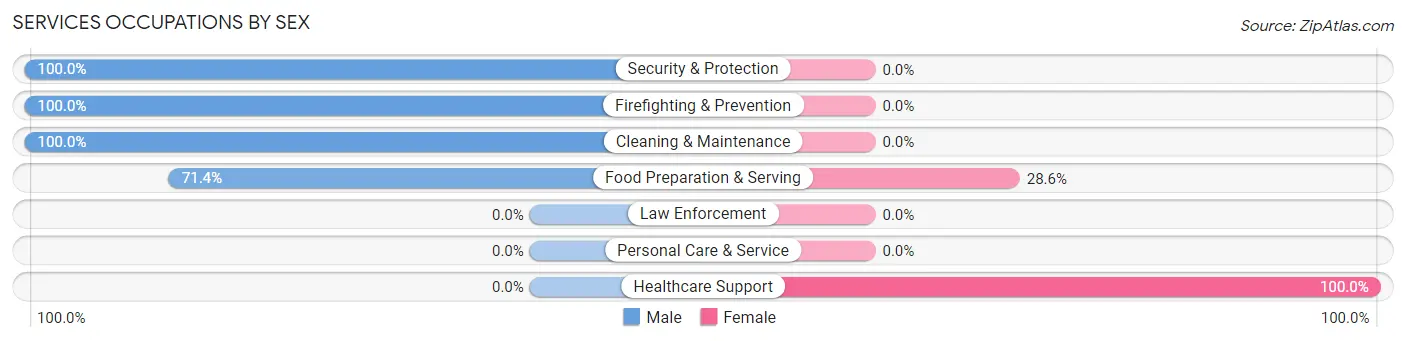
Services Occupations by Sex
Within the Services occupations in Woodacre, the most male-oriented occupations are Security & Protection (100.0%), Firefighting & Prevention (100.0%), and Cleaning & Maintenance (100.0%), while the most female-oriented occupations are Healthcare Support (100.0%), and Food Preparation & Serving (28.6%).
| Occupation | Male | Female |
| Healthcare Support | 0 (0.0%) | 23 (100.0%) |
| Security & Protection | 23 (100.0%) | 0 (0.0%) |
| Firefighting & Prevention | 23 (100.0%) | 0 (0.0%) |
| Law Enforcement | 0 (0.0%) | 0 (0.0%) |
| Food Preparation & Serving | 55 (71.4%) | 22 (28.6%) |
| Cleaning & Maintenance | 53 (100.0%) | 0 (0.0%) |
| Personal Care & Service | 0 (0.0%) | 0 (0.0%) |
| Total (Category) | 131 (74.4%) | 45 (25.6%) |
| Total (Overall) | 562 (58.2%) | 403 (41.8%) |
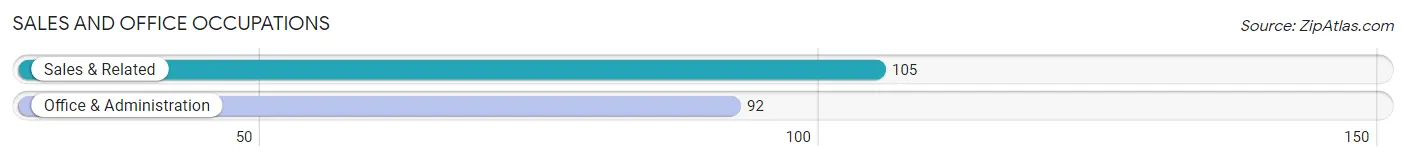
Sales and Office Occupations
The most common Sales and Office occupations in Woodacre are Sales & Related (105 | 10.9%), and Office & Administration (92 | 9.5%).
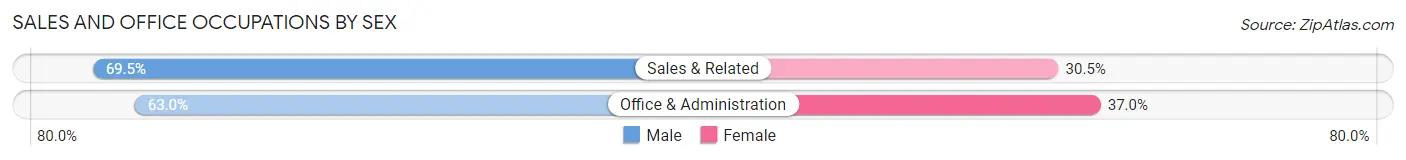
Sales and Office Occupations by Sex
| Occupation | Male | Female |
| Sales & Related | 73 (69.5%) | 32 (30.5%) |
| Office & Administration | 58 (63.0%) | 34 (37.0%) |
| Total (Category) | 131 (66.5%) | 66 (33.5%) |
| Total (Overall) | 562 (58.2%) | 403 (41.8%) |
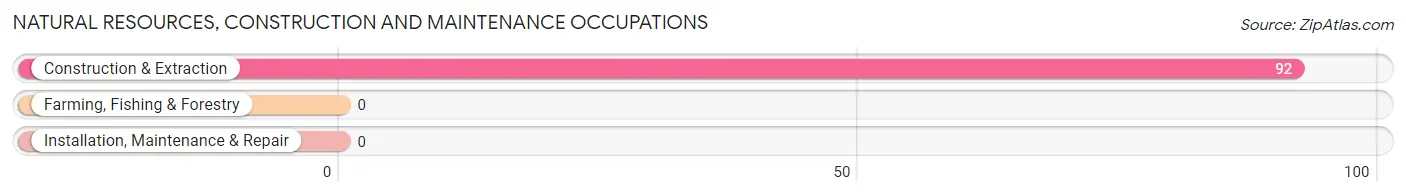
Natural Resources, Construction and Maintenance Occupations
The most common Natural Resources, Construction and Maintenance occupations in Woodacre are , and Construction & Extraction (92 | 9.5%).
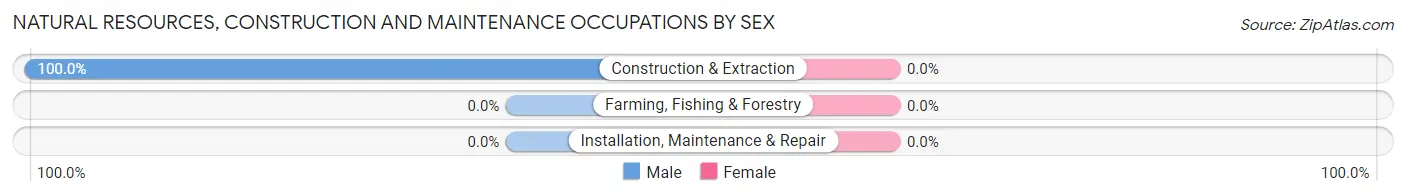
Natural Resources, Construction and Maintenance Occupations by Sex
| Occupation | Male | Female |
| Farming, Fishing & Forestry | 0 (0.0%) | 0 (0.0%) |
| Construction & Extraction | 92 (100.0%) | 0 (0.0%) |
| Installation, Maintenance & Repair | 0 (0.0%) | 0 (0.0%) |
| Total (Category) | 92 (100.0%) | 0 (0.0%) |
| Total (Overall) | 562 (58.2%) | 403 (41.8%) |
Production, Transportation and Moving Occupations
Production, Transportation and Moving Occupations by Sex
| Occupation | Male | Female |
| Production | 0 (0.0%) | 0 (0.0%) |
| Transportation | 0 (0.0%) | 0 (0.0%) |
| Material Moving | 0 (0.0%) | 0 (0.0%) |
| Total (Category) | 0 (0.0%) | 0 (0.0%) |
| Total (Overall) | 562 (58.2%) | 403 (41.8%) |
Employment Industries by Sex in Woodacre
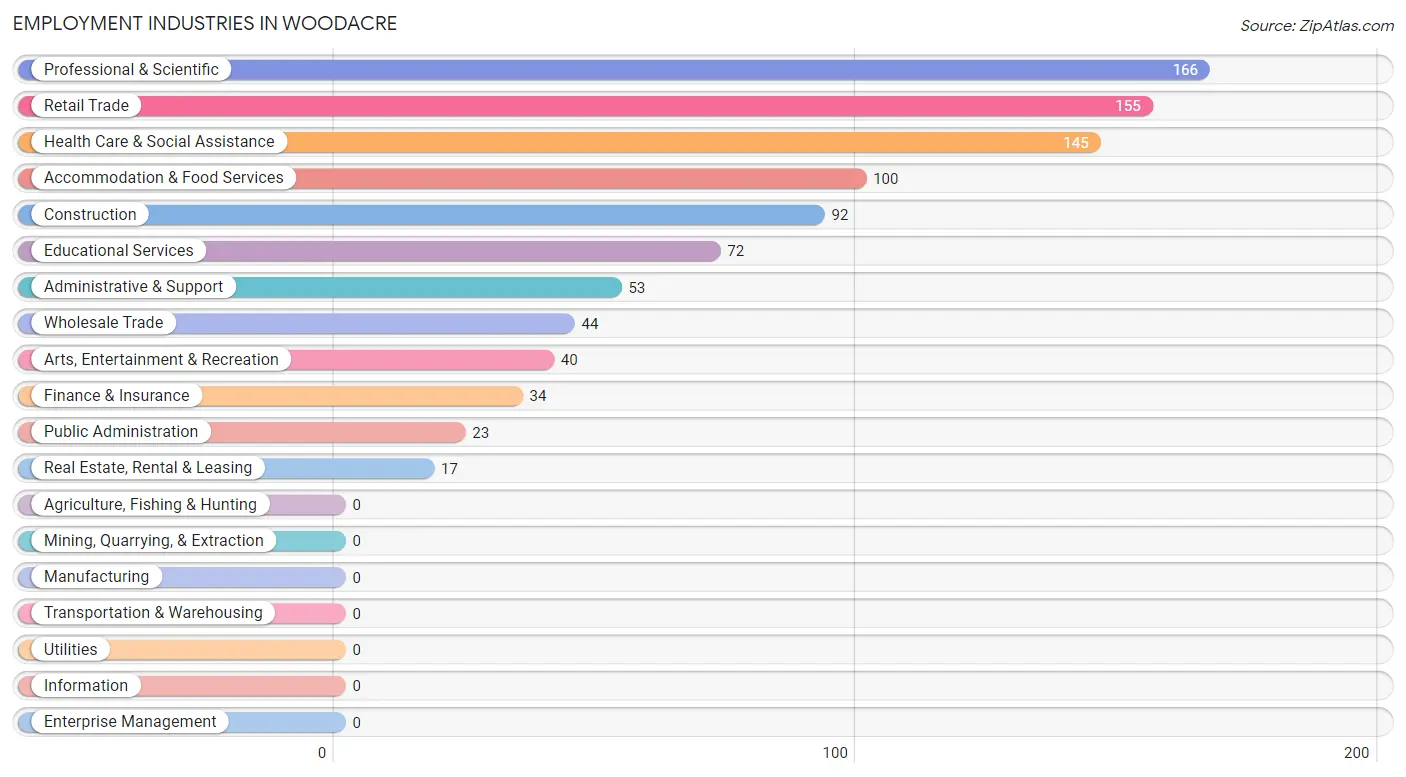
Employment Industries in Woodacre
The major employment industries in Woodacre include Professional & Scientific (166 | 17.2%), Retail Trade (155 | 16.1%), Health Care & Social Assistance (145 | 15.0%), Accommodation & Food Services (100 | 10.4%), and Construction (92 | 9.5%).
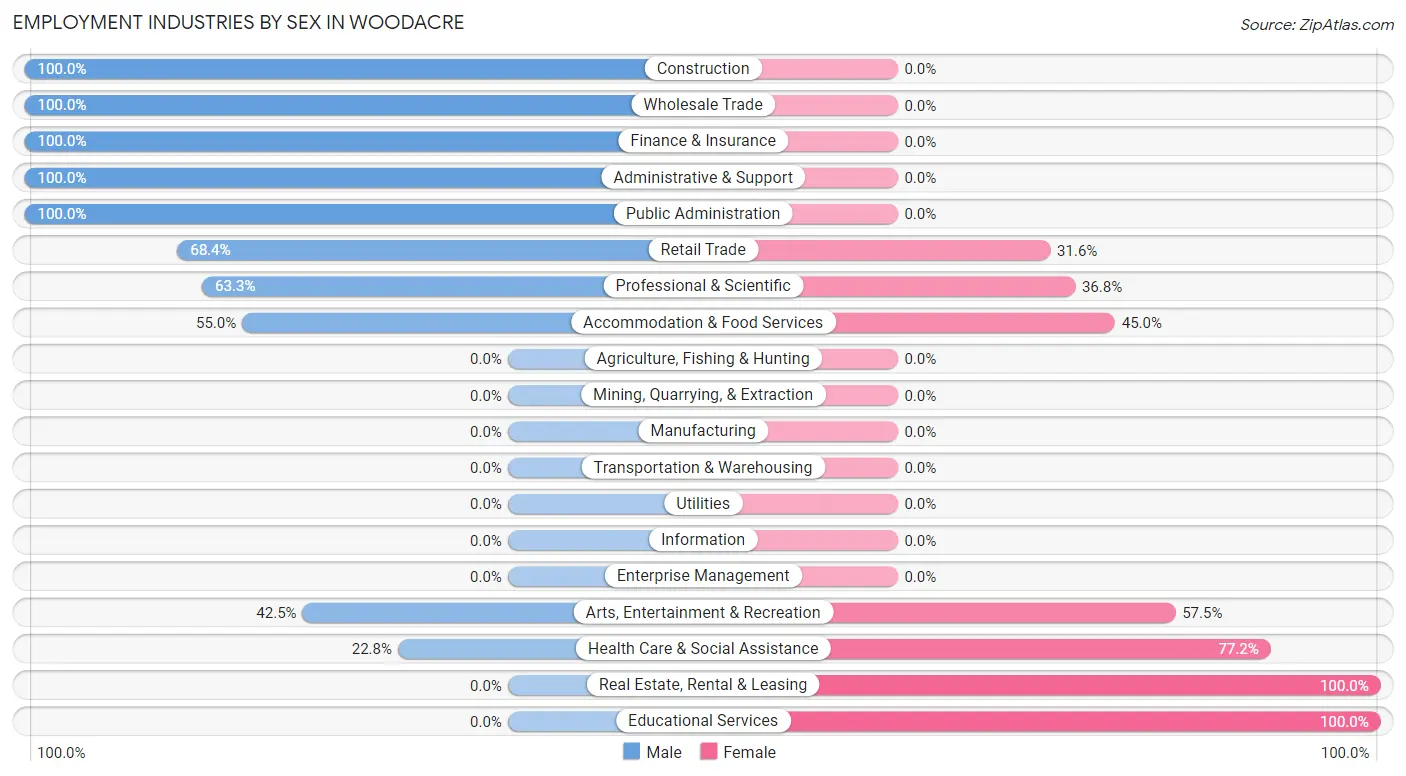
Employment Industries by Sex in Woodacre
The Woodacre industries that see more men than women are Construction (100.0%), Wholesale Trade (100.0%), and Finance & Insurance (100.0%), whereas the industries that tend to have a higher number of women are Real Estate, Rental & Leasing (100.0%), Educational Services (100.0%), and Health Care & Social Assistance (77.2%).
| Industry | Male | Female |
| Agriculture, Fishing & Hunting | 0 (0.0%) | 0 (0.0%) |
| Mining, Quarrying, & Extraction | 0 (0.0%) | 0 (0.0%) |
| Construction | 92 (100.0%) | 0 (0.0%) |
| Manufacturing | 0 (0.0%) | 0 (0.0%) |
| Wholesale Trade | 44 (100.0%) | 0 (0.0%) |
| Retail Trade | 106 (68.4%) | 49 (31.6%) |
| Transportation & Warehousing | 0 (0.0%) | 0 (0.0%) |
| Utilities | 0 (0.0%) | 0 (0.0%) |
| Information | 0 (0.0%) | 0 (0.0%) |
| Finance & Insurance | 34 (100.0%) | 0 (0.0%) |
| Real Estate, Rental & Leasing | 0 (0.0%) | 17 (100.0%) |
| Professional & Scientific | 105 (63.2%) | 61 (36.7%) |
| Enterprise Management | 0 (0.0%) | 0 (0.0%) |
| Administrative & Support | 53 (100.0%) | 0 (0.0%) |
| Educational Services | 0 (0.0%) | 72 (100.0%) |
| Health Care & Social Assistance | 33 (22.8%) | 112 (77.2%) |
| Arts, Entertainment & Recreation | 17 (42.5%) | 23 (57.5%) |
| Accommodation & Food Services | 55 (55.0%) | 45 (45.0%) |
| Public Administration | 23 (100.0%) | 0 (0.0%) |
| Total | 562 (58.2%) | 403 (41.8%) |
Education in Woodacre
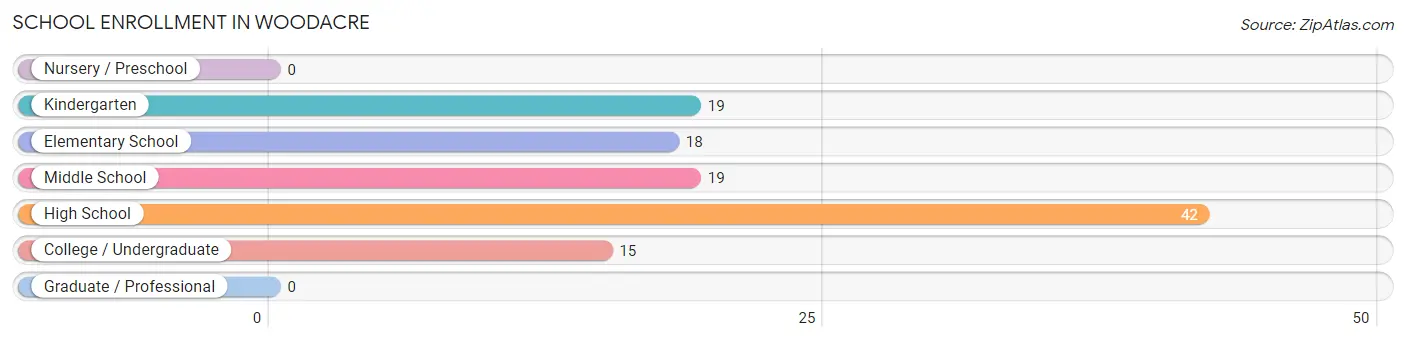
School Enrollment in Woodacre
The most common levels of schooling among the 113 students in Woodacre are high school (42 | 37.2%), kindergarten (19 | 16.8%), and middle school (19 | 16.8%).
| School Level | # Students | % Students |
| Nursery / Preschool | 0 | 0.0% |
| Kindergarten | 19 | 16.8% |
| Elementary School | 18 | 15.9% |
| Middle School | 19 | 16.8% |
| High School | 42 | 37.2% |
| College / Undergraduate | 15 | 13.3% |
| Graduate / Professional | 0 | 0.0% |
| Total | 113 | 100.0% |
School Enrollment by Age by Funding Source in Woodacre
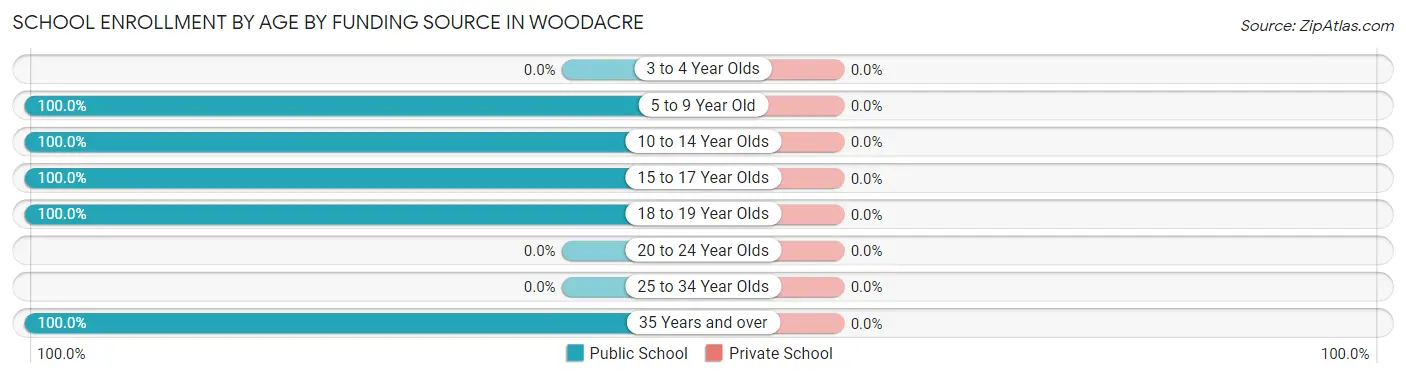
| Age Bracket | Public School | Private School |
| 3 to 4 Year Olds | 0 (0.0%) | 0 (0.0%) |
| 5 to 9 Year Old | 19 (100.0%) | 0 (0.0%) |
| 10 to 14 Year Olds | 37 (100.0%) | 0 (0.0%) |
| 15 to 17 Year Olds | 20 (100.0%) | 0 (0.0%) |
| 18 to 19 Year Olds | 22 (100.0%) | 0 (0.0%) |
| 20 to 24 Year Olds | 0 (0.0%) | 0 (0.0%) |
| 25 to 34 Year Olds | 0 (0.0%) | 0 (0.0%) |
| 35 Years and over | 15 (100.0%) | 0 (0.0%) |
| Total | 113 (100.0%) | 0 (0.0%) |
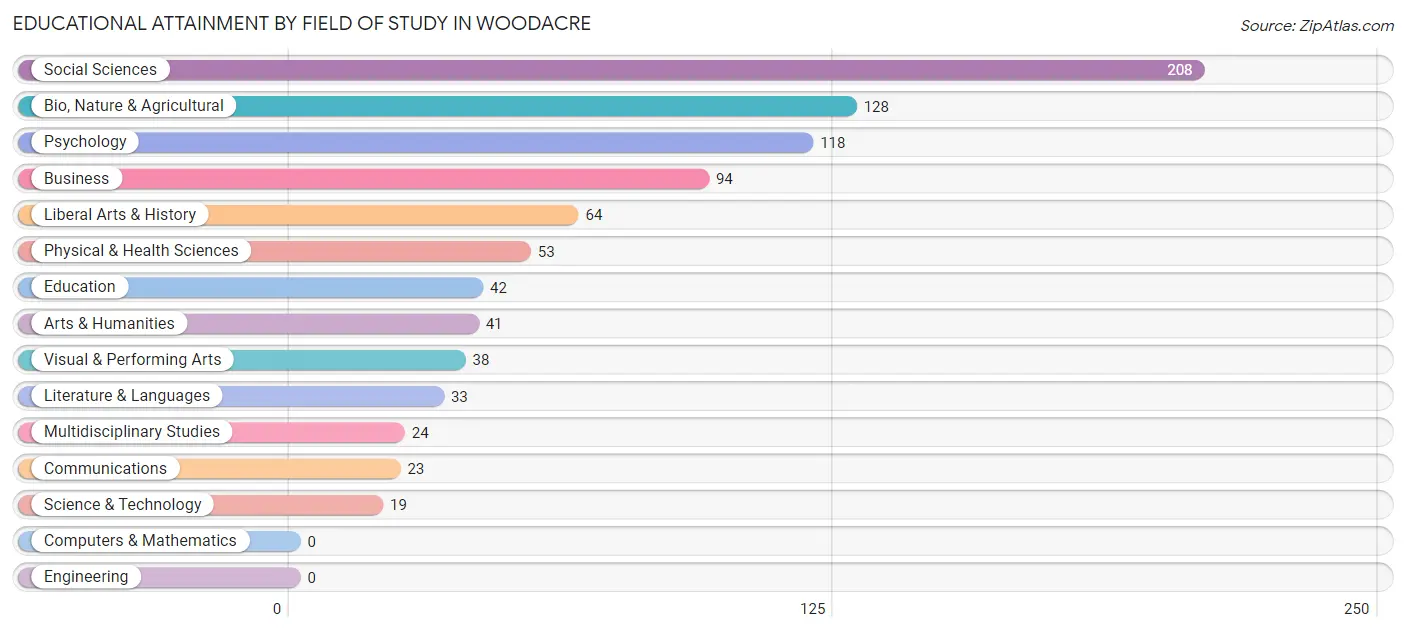
Educational Attainment by Field of Study in Woodacre
Social sciences (208 | 23.5%), bio, nature & agricultural (128 | 14.5%), psychology (118 | 13.3%), business (94 | 10.6%), and liberal arts & history (64 | 7.2%) are the most common fields of study among 885 individuals in Woodacre who have obtained a bachelor's degree or higher.
| Field of Study | # Graduates | % Graduates |
| Computers & Mathematics | 0 | 0.0% |
| Bio, Nature & Agricultural | 128 | 14.5% |
| Physical & Health Sciences | 53 | 6.0% |
| Psychology | 118 | 13.3% |
| Social Sciences | 208 | 23.5% |
| Engineering | 0 | 0.0% |
| Multidisciplinary Studies | 24 | 2.7% |
| Science & Technology | 19 | 2.1% |
| Business | 94 | 10.6% |
| Education | 42 | 4.8% |
| Literature & Languages | 33 | 3.7% |
| Liberal Arts & History | 64 | 7.2% |
| Visual & Performing Arts | 38 | 4.3% |
| Communications | 23 | 2.6% |
| Arts & Humanities | 41 | 4.6% |
| Total | 885 | 100.0% |
Transportation & Commute in Woodacre
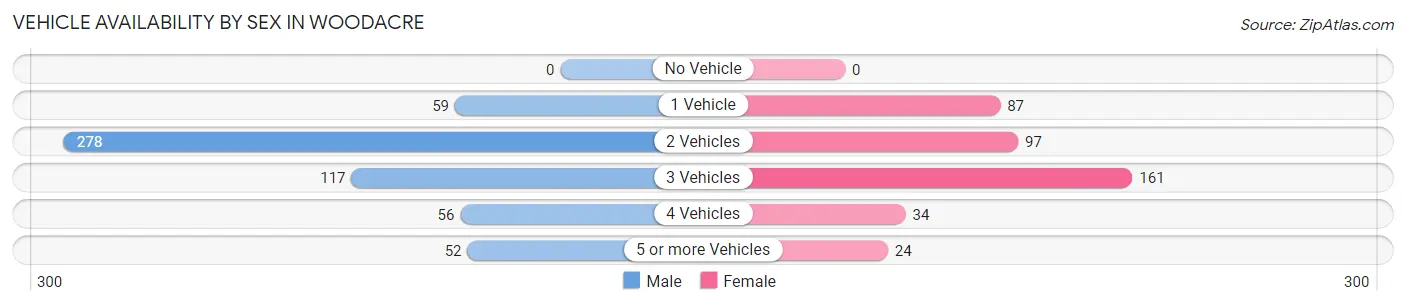
Vehicle Availability by Sex in Woodacre
The most prevalent vehicle ownership categories in Woodacre are males with 2 vehicles (278, accounting for 49.5%) and females with 2 vehicles (97, making up 69.0%).
| Vehicles Available | Male | Female |
| No Vehicle | 0 (0.0%) | 0 (0.0%) |
| 1 Vehicle | 59 (10.5%) | 87 (21.6%) |
| 2 Vehicles | 278 (49.5%) | 97 (24.1%) |
| 3 Vehicles | 117 (20.8%) | 161 (40.0%) |
| 4 Vehicles | 56 (10.0%) | 34 (8.4%) |
| 5 or more Vehicles | 52 (9.2%) | 24 (6.0%) |
| Total | 562 (100.0%) | 403 (100.0%) |
Commute Time in Woodacre
The most frequently occuring commute durations in Woodacre are 30 to 34 minutes (106 commuters, 15.2%), 5 to 9 minutes (99 commuters, 14.2%), and 60 to 89 minutes (90 commuters, 13.0%).
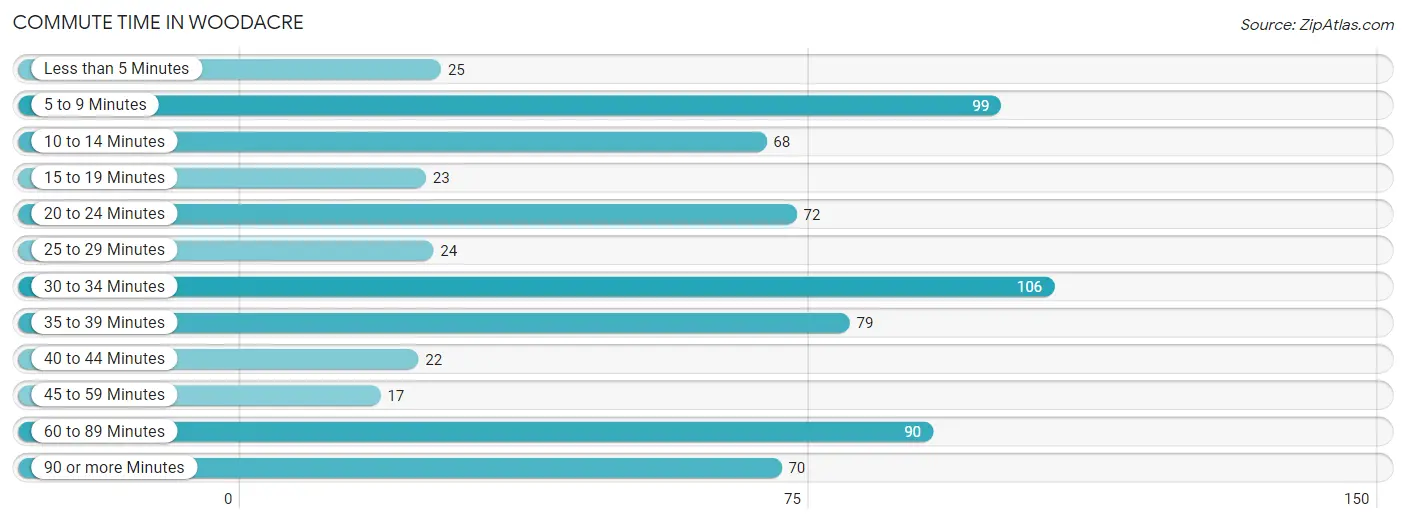
| Commute Time | # Commuters | % Commuters |
| Less than 5 Minutes | 25 | 3.6% |
| 5 to 9 Minutes | 99 | 14.2% |
| 10 to 14 Minutes | 68 | 9.8% |
| 15 to 19 Minutes | 23 | 3.3% |
| 20 to 24 Minutes | 72 | 10.4% |
| 25 to 29 Minutes | 24 | 3.5% |
| 30 to 34 Minutes | 106 | 15.2% |
| 35 to 39 Minutes | 79 | 11.4% |
| 40 to 44 Minutes | 22 | 3.2% |
| 45 to 59 Minutes | 17 | 2.5% |
| 60 to 89 Minutes | 90 | 13.0% |
| 90 or more Minutes | 70 | 10.1% |
Commute Time by Sex in Woodacre
The most common commute times in Woodacre are 60 to 89 minutes (90 commuters, 21.7%) for males and 35 to 39 minutes (53 commuters, 18.9%) for females.
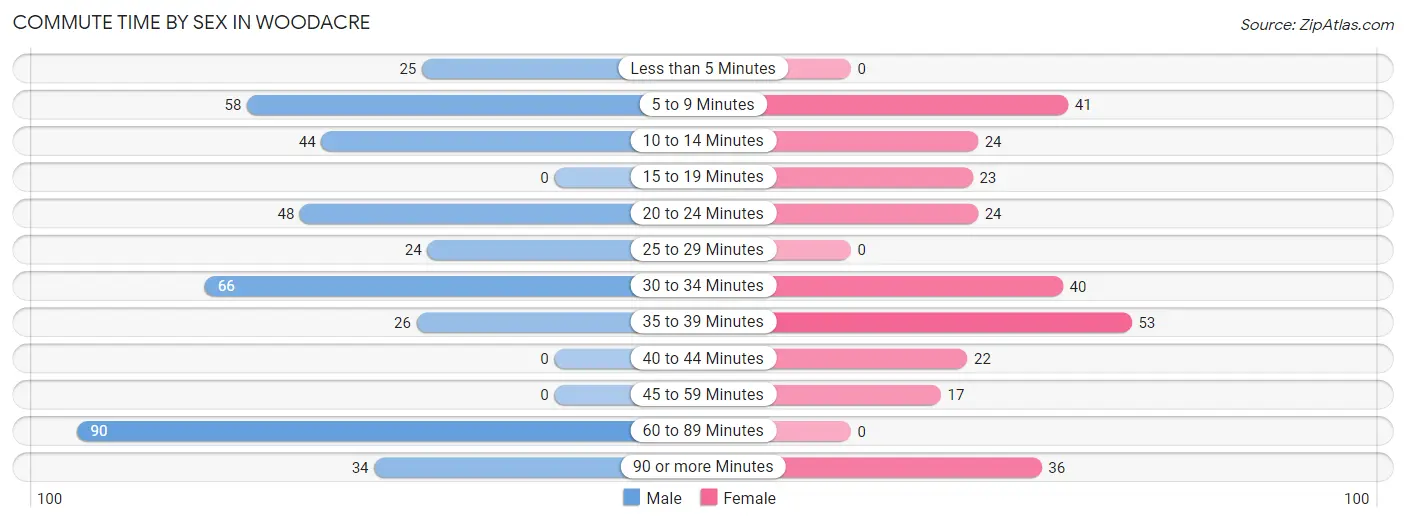
| Commute Time | Male | Female |
| Less than 5 Minutes | 25 (6.0%) | 0 (0.0%) |
| 5 to 9 Minutes | 58 (14.0%) | 41 (14.6%) |
| 10 to 14 Minutes | 44 (10.6%) | 24 (8.6%) |
| 15 to 19 Minutes | 0 (0.0%) | 23 (8.2%) |
| 20 to 24 Minutes | 48 (11.6%) | 24 (8.6%) |
| 25 to 29 Minutes | 24 (5.8%) | 0 (0.0%) |
| 30 to 34 Minutes | 66 (15.9%) | 40 (14.3%) |
| 35 to 39 Minutes | 26 (6.3%) | 53 (18.9%) |
| 40 to 44 Minutes | 0 (0.0%) | 22 (7.9%) |
| 45 to 59 Minutes | 0 (0.0%) | 17 (6.1%) |
| 60 to 89 Minutes | 90 (21.7%) | 0 (0.0%) |
| 90 or more Minutes | 34 (8.2%) | 36 (12.9%) |
Time of Departure to Work by Sex in Woodacre
The most frequent times of departure to work in Woodacre are 6:30 AM to 6:59 AM (100, 24.1%) for males and 9:00 AM to 9:59 AM (116, 41.4%) for females.
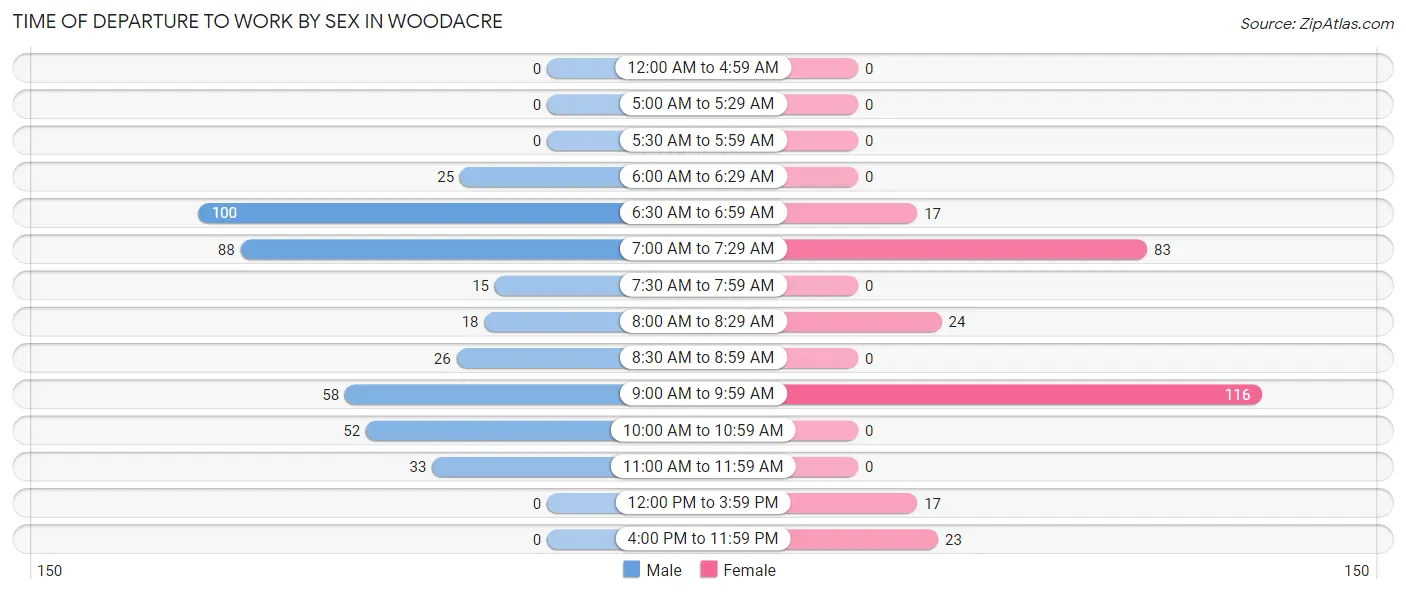
| Time of Departure | Male | Female |
| 12:00 AM to 4:59 AM | 0 (0.0%) | 0 (0.0%) |
| 5:00 AM to 5:29 AM | 0 (0.0%) | 0 (0.0%) |
| 5:30 AM to 5:59 AM | 0 (0.0%) | 0 (0.0%) |
| 6:00 AM to 6:29 AM | 25 (6.0%) | 0 (0.0%) |
| 6:30 AM to 6:59 AM | 100 (24.1%) | 17 (6.1%) |
| 7:00 AM to 7:29 AM | 88 (21.2%) | 83 (29.6%) |
| 7:30 AM to 7:59 AM | 15 (3.6%) | 0 (0.0%) |
| 8:00 AM to 8:29 AM | 18 (4.3%) | 24 (8.6%) |
| 8:30 AM to 8:59 AM | 26 (6.3%) | 0 (0.0%) |
| 9:00 AM to 9:59 AM | 58 (14.0%) | 116 (41.4%) |
| 10:00 AM to 10:59 AM | 52 (12.5%) | 0 (0.0%) |
| 11:00 AM to 11:59 AM | 33 (8.0%) | 0 (0.0%) |
| 12:00 PM to 3:59 PM | 0 (0.0%) | 17 (6.1%) |
| 4:00 PM to 11:59 PM | 0 (0.0%) | 23 (8.2%) |
| Total | 415 (100.0%) | 280 (100.0%) |
Housing Occupancy in Woodacre
Occupancy by Ownership in Woodacre
Of the total 609 dwellings in Woodacre, owner-occupied units account for 532 (87.4%), while renter-occupied units make up 77 (12.6%).
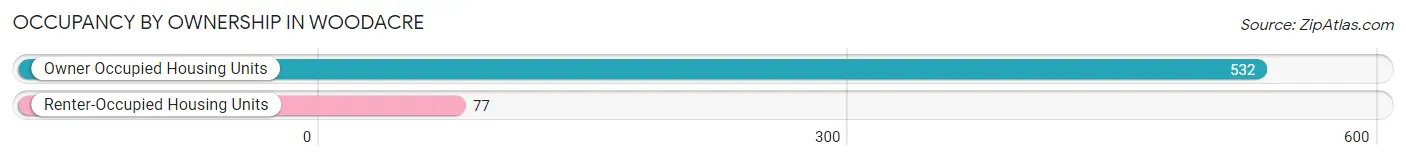
| Occupancy | # Housing Units | % Housing Units |
| Owner Occupied Housing Units | 532 | 87.4% |
| Renter-Occupied Housing Units | 77 | 12.6% |
| Total Occupied Housing Units | 609 | 100.0% |
Occupancy by Household Size in Woodacre
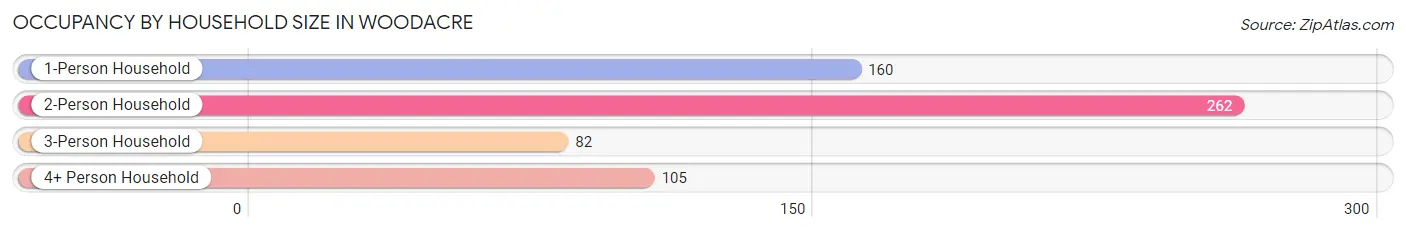
| Household Size | # Housing Units | % Housing Units |
| 1-Person Household | 160 | 26.3% |
| 2-Person Household | 262 | 43.0% |
| 3-Person Household | 82 | 13.5% |
| 4+ Person Household | 105 | 17.2% |
| Total Housing Units | 609 | 100.0% |
Occupancy by Ownership by Household Size in Woodacre
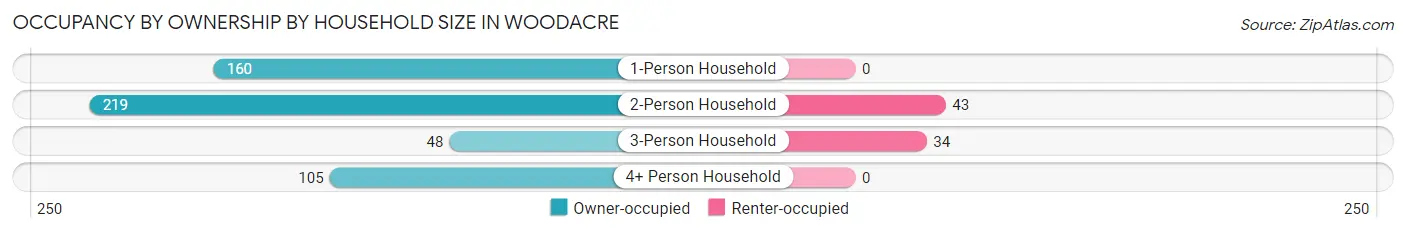
| Household Size | Owner-occupied | Renter-occupied |
| 1-Person Household | 160 (100.0%) | 0 (0.0%) |
| 2-Person Household | 219 (83.6%) | 43 (16.4%) |
| 3-Person Household | 48 (58.5%) | 34 (41.5%) |
| 4+ Person Household | 105 (100.0%) | 0 (0.0%) |
| Total Housing Units | 532 (87.4%) | 77 (12.6%) |
Occupancy by Educational Attainment in Woodacre
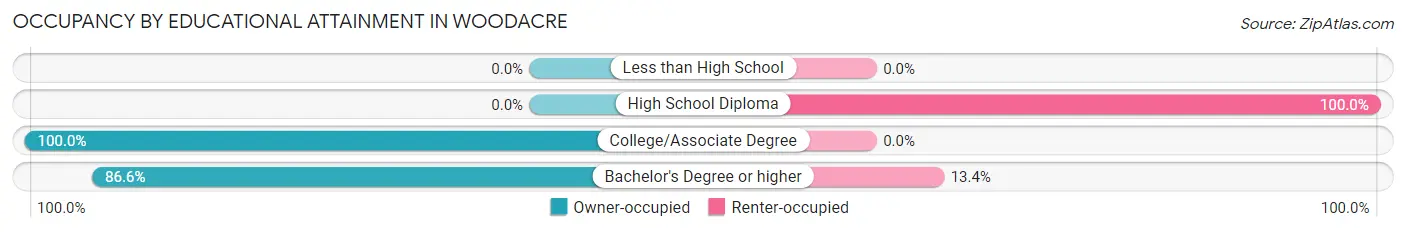
| Household Size | Owner-occupied | Renter-occupied |
| Less than High School | 0 (0.0%) | 0 (0.0%) |
| High School Diploma | 0 (0.0%) | 15 (100.0%) |
| College/Associate Degree | 131 (100.0%) | 0 (0.0%) |
| Bachelor's Degree or higher | 401 (86.6%) | 62 (13.4%) |
Occupancy by Age of Householder in Woodacre
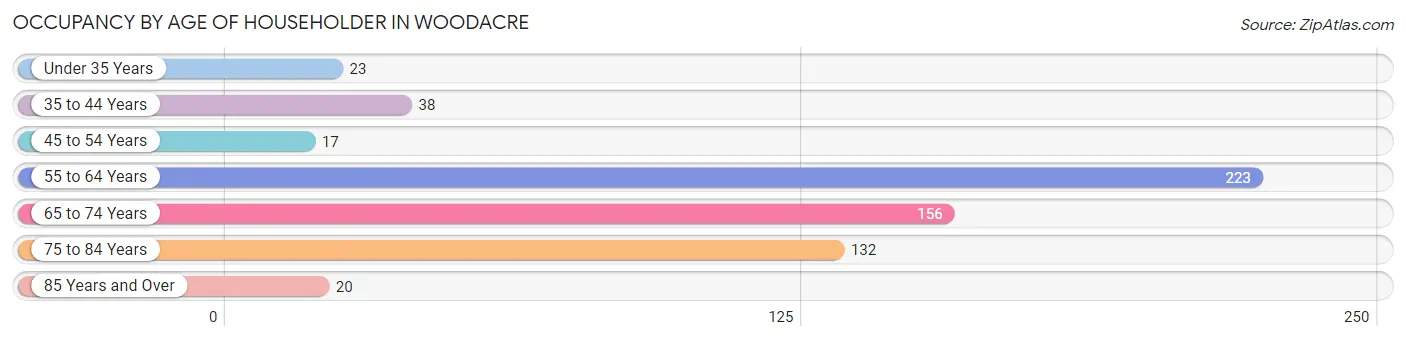
| Age Bracket | # Households | % Households |
| Under 35 Years | 23 | 3.8% |
| 35 to 44 Years | 38 | 6.2% |
| 45 to 54 Years | 17 | 2.8% |
| 55 to 64 Years | 223 | 36.6% |
| 65 to 74 Years | 156 | 25.6% |
| 75 to 84 Years | 132 | 21.7% |
| 85 Years and Over | 20 | 3.3% |
| Total | 609 | 100.0% |
Housing Finances in Woodacre
Median Income by Occupancy in Woodacre
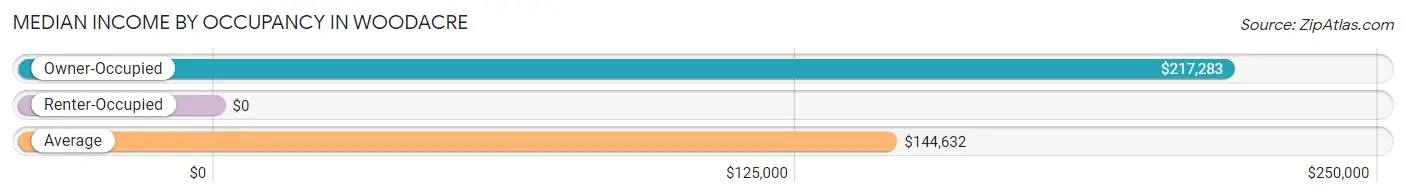
| Occupancy Type | # Households | Median Income |
| Owner-Occupied | 532 (87.4%) | $217,283 |
| Renter-Occupied | 77 (12.6%) | $0 |
| Average | 609 (100.0%) | $144,632 |
Occupancy by Householder Income Bracket in Woodacre
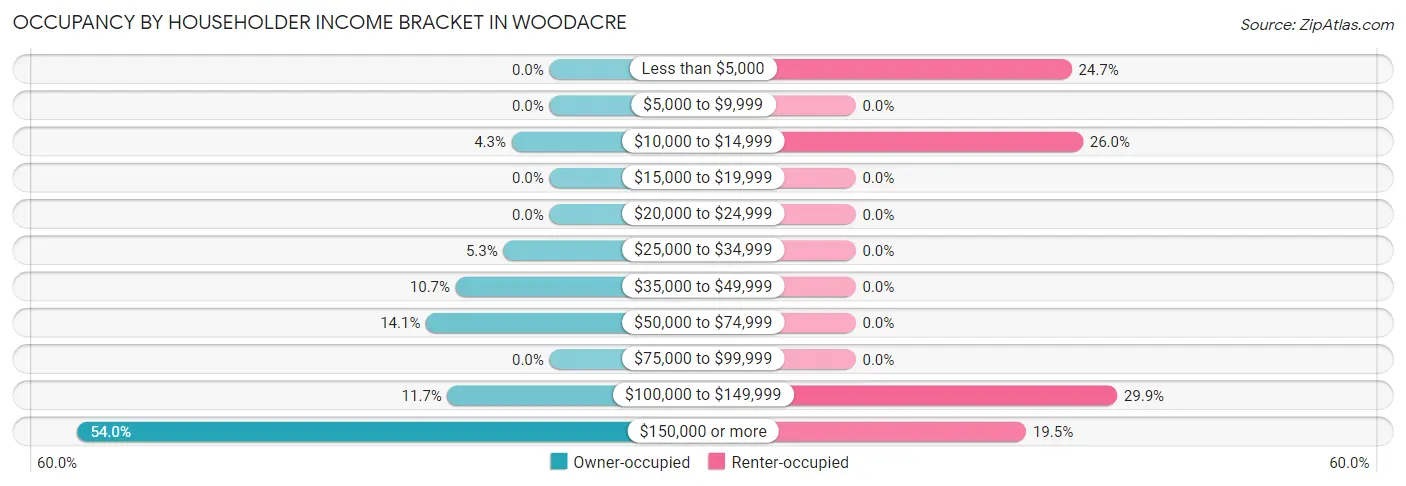
| Income Bracket | Owner-occupied | Renter-occupied |
| Less than $5,000 | 0 (0.0%) | 19 (24.7%) |
| $5,000 to $9,999 | 0 (0.0%) | 0 (0.0%) |
| $10,000 to $14,999 | 23 (4.3%) | 20 (26.0%) |
| $15,000 to $19,999 | 0 (0.0%) | 0 (0.0%) |
| $20,000 to $24,999 | 0 (0.0%) | 0 (0.0%) |
| $25,000 to $34,999 | 28 (5.3%) | 0 (0.0%) |
| $35,000 to $49,999 | 57 (10.7%) | 0 (0.0%) |
| $50,000 to $74,999 | 75 (14.1%) | 0 (0.0%) |
| $75,000 to $99,999 | 0 (0.0%) | 0 (0.0%) |
| $100,000 to $149,999 | 62 (11.7%) | 23 (29.9%) |
| $150,000 or more | 287 (53.9%) | 15 (19.5%) |
| Total | 532 (100.0%) | 77 (100.0%) |
Monthly Housing Cost Tiers in Woodacre
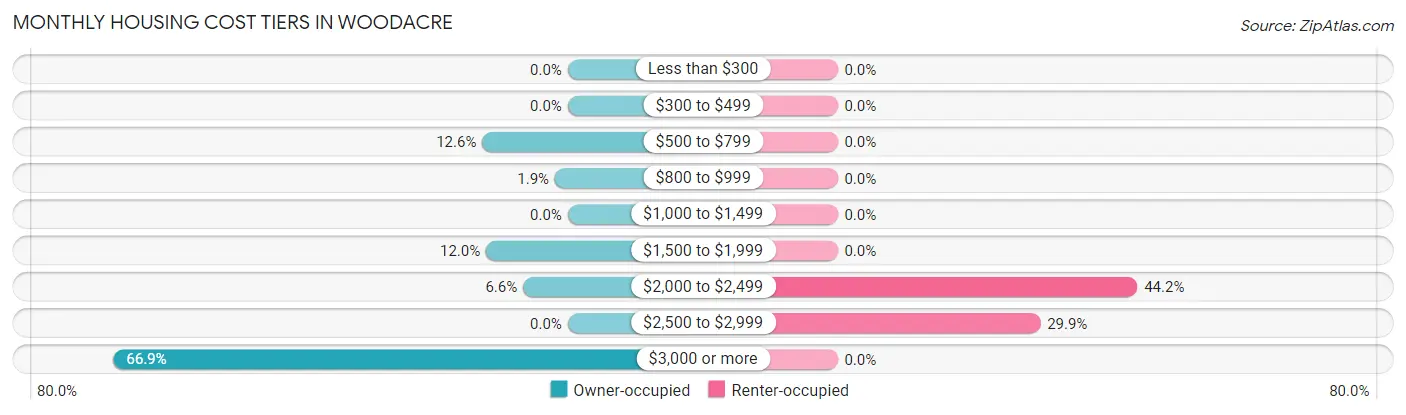
| Monthly Cost | Owner-occupied | Renter-occupied |
| Less than $300 | 0 (0.0%) | 0 (0.0%) |
| $300 to $499 | 0 (0.0%) | 0 (0.0%) |
| $500 to $799 | 67 (12.6%) | 0 (0.0%) |
| $800 to $999 | 10 (1.9%) | 0 (0.0%) |
| $1,000 to $1,499 | 0 (0.0%) | 0 (0.0%) |
| $1,500 to $1,999 | 64 (12.0%) | 0 (0.0%) |
| $2,000 to $2,499 | 35 (6.6%) | 34 (44.2%) |
| $2,500 to $2,999 | 0 (0.0%) | 23 (29.9%) |
| $3,000 or more | 356 (66.9%) | 0 (0.0%) |
| Total | 532 (100.0%) | 77 (100.0%) |
Physical Housing Characteristics in Woodacre
Housing Structures in Woodacre
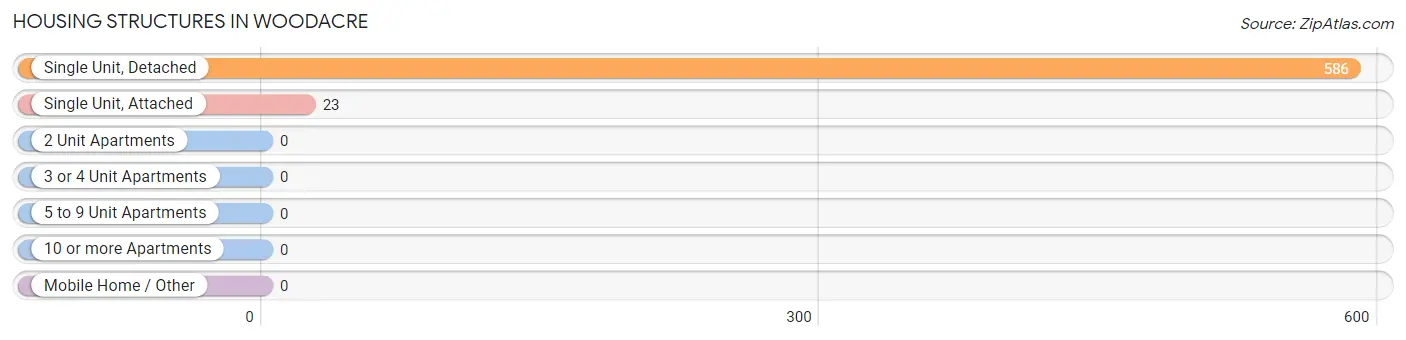
| Structure Type | # Housing Units | % Housing Units |
| Single Unit, Detached | 586 | 96.2% |
| Single Unit, Attached | 23 | 3.8% |
| 2 Unit Apartments | 0 | 0.0% |
| 3 or 4 Unit Apartments | 0 | 0.0% |
| 5 to 9 Unit Apartments | 0 | 0.0% |
| 10 or more Apartments | 0 | 0.0% |
| Mobile Home / Other | 0 | 0.0% |
| Total | 609 | 100.0% |
Housing Structures by Occupancy in Woodacre
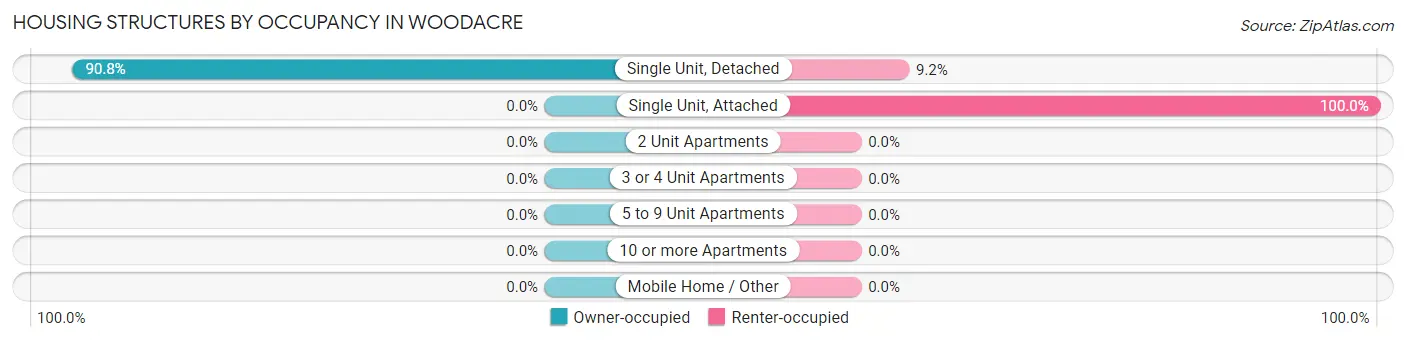
| Structure Type | Owner-occupied | Renter-occupied |
| Single Unit, Detached | 532 (90.8%) | 54 (9.2%) |
| Single Unit, Attached | 0 (0.0%) | 23 (100.0%) |
| 2 Unit Apartments | 0 (0.0%) | 0 (0.0%) |
| 3 or 4 Unit Apartments | 0 (0.0%) | 0 (0.0%) |
| 5 to 9 Unit Apartments | 0 (0.0%) | 0 (0.0%) |
| 10 or more Apartments | 0 (0.0%) | 0 (0.0%) |
| Mobile Home / Other | 0 (0.0%) | 0 (0.0%) |
| Total | 532 (87.4%) | 77 (12.6%) |
Housing Structures by Number of Rooms in Woodacre
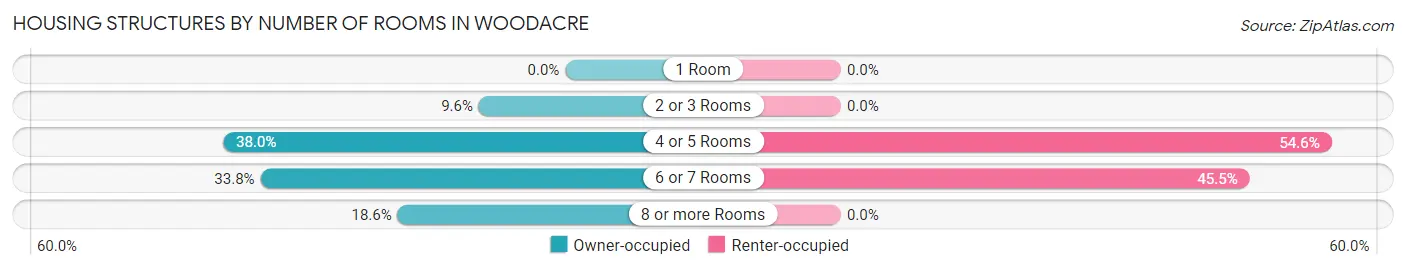
| Number of Rooms | Owner-occupied | Renter-occupied |
| 1 Room | 0 (0.0%) | 0 (0.0%) |
| 2 or 3 Rooms | 51 (9.6%) | 0 (0.0%) |
| 4 or 5 Rooms | 202 (38.0%) | 42 (54.5%) |
| 6 or 7 Rooms | 180 (33.8%) | 35 (45.5%) |
| 8 or more Rooms | 99 (18.6%) | 0 (0.0%) |
| Total | 532 (100.0%) | 77 (100.0%) |
Housing Structure by Heating Type in Woodacre
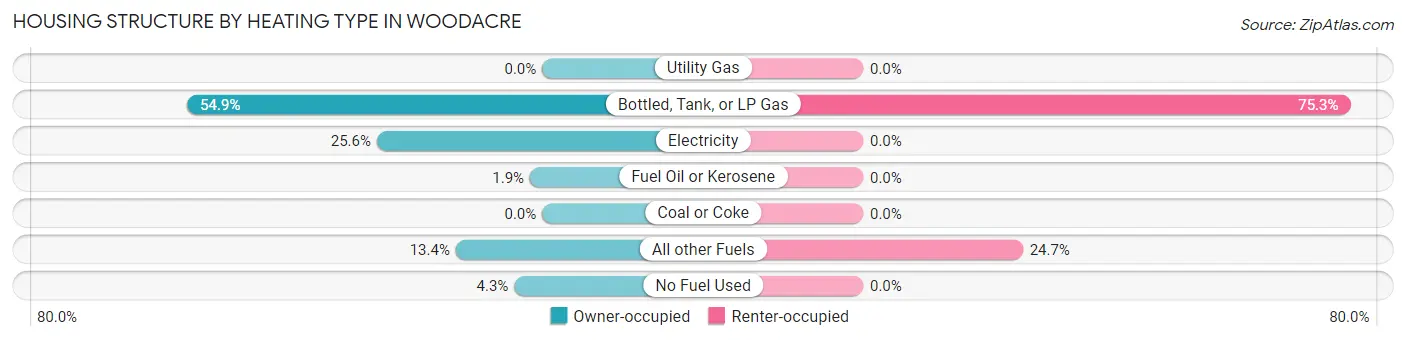
| Heating Type | Owner-occupied | Renter-occupied |
| Utility Gas | 0 (0.0%) | 0 (0.0%) |
| Bottled, Tank, or LP Gas | 292 (54.9%) | 58 (75.3%) |
| Electricity | 136 (25.6%) | 0 (0.0%) |
| Fuel Oil or Kerosene | 10 (1.9%) | 0 (0.0%) |
| Coal or Coke | 0 (0.0%) | 0 (0.0%) |
| All other Fuels | 71 (13.4%) | 19 (24.7%) |
| No Fuel Used | 23 (4.3%) | 0 (0.0%) |
| Total | 532 (100.0%) | 77 (100.0%) |
Household Vehicle Usage in Woodacre
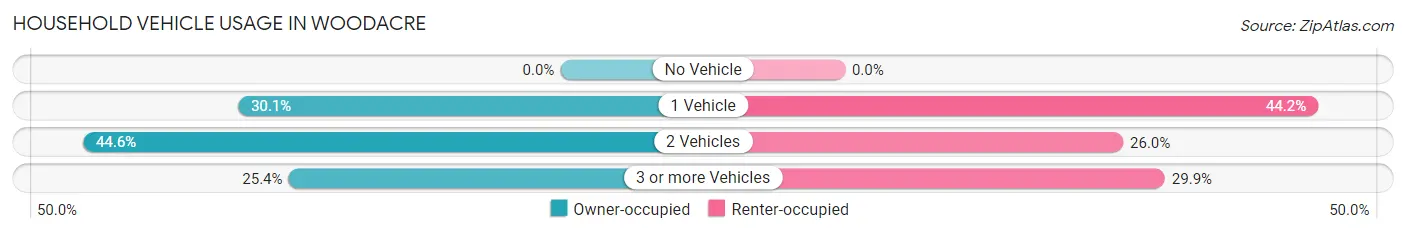
| Vehicles per Household | Owner-occupied | Renter-occupied |
| No Vehicle | 0 (0.0%) | 0 (0.0%) |
| 1 Vehicle | 160 (30.1%) | 34 (44.2%) |
| 2 Vehicles | 237 (44.6%) | 20 (26.0%) |
| 3 or more Vehicles | 135 (25.4%) | 23 (29.9%) |
| Total | 532 (100.0%) | 77 (100.0%) |
Real Estate & Mortgages in Woodacre
Real Estate and Mortgage Overview in Woodacre
| Characteristic | Without Mortgage | With Mortgage |
| Housing Units | 77 | 455 |
| Median Property Value | $1,165,700 | $1,068,300 |
| Median Household Income | - | - |
| Monthly Housing Costs | $590 | $356 |
| Real Estate Taxes | $2,804 | $0 |
Property Value by Mortgage Status in Woodacre
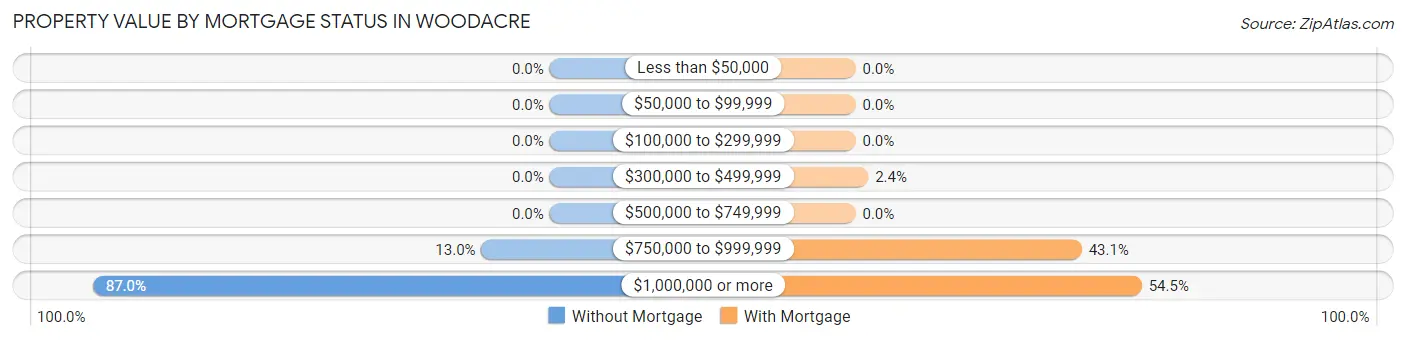
| Property Value | Without Mortgage | With Mortgage |
| Less than $50,000 | 0 (0.0%) | 0 (0.0%) |
| $50,000 to $99,999 | 0 (0.0%) | 0 (0.0%) |
| $100,000 to $299,999 | 0 (0.0%) | 0 (0.0%) |
| $300,000 to $499,999 | 0 (0.0%) | 11 (2.4%) |
| $500,000 to $749,999 | 0 (0.0%) | 0 (0.0%) |
| $750,000 to $999,999 | 10 (13.0%) | 196 (43.1%) |
| $1,000,000 or more | 67 (87.0%) | 248 (54.5%) |
| Total | 77 (100.0%) | 455 (100.0%) |
Household Income by Mortgage Status in Woodacre
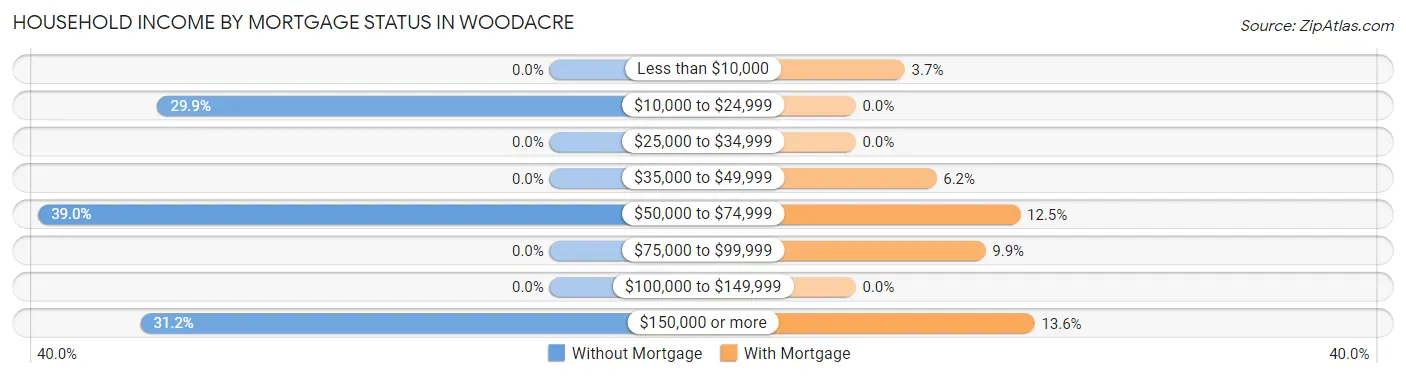
| Household Income | Without Mortgage | With Mortgage |
| Less than $10,000 | 0 (0.0%) | 17 (3.7%) |
| $10,000 to $24,999 | 23 (29.9%) | 0 (0.0%) |
| $25,000 to $34,999 | 0 (0.0%) | 0 (0.0%) |
| $35,000 to $49,999 | 0 (0.0%) | 28 (6.1%) |
| $50,000 to $74,999 | 30 (39.0%) | 57 (12.5%) |
| $75,000 to $99,999 | 0 (0.0%) | 45 (9.9%) |
| $100,000 to $149,999 | 0 (0.0%) | 0 (0.0%) |
| $150,000 or more | 24 (31.2%) | 62 (13.6%) |
| Total | 77 (100.0%) | 455 (100.0%) |
Property Value to Household Income Ratio in Woodacre
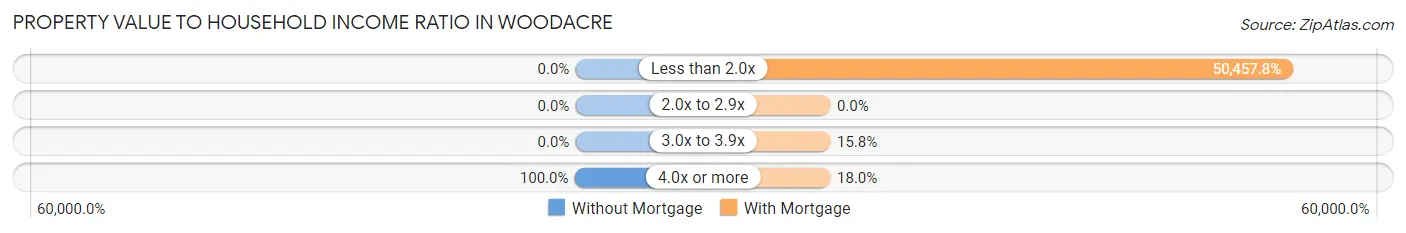
| Value-to-Income Ratio | Without Mortgage | With Mortgage |
| Less than 2.0x | 0 (0.0%) | 229,583 (50,457.8%) |
| 2.0x to 2.9x | 0 (0.0%) | 0 (0.0%) |
| 3.0x to 3.9x | 0 (0.0%) | 72 (15.8%) |
| 4.0x or more | 77 (100.0%) | 82 (18.0%) |
| Total | 77 (100.0%) | 455 (100.0%) |
Real Estate Taxes by Mortgage Status in Woodacre
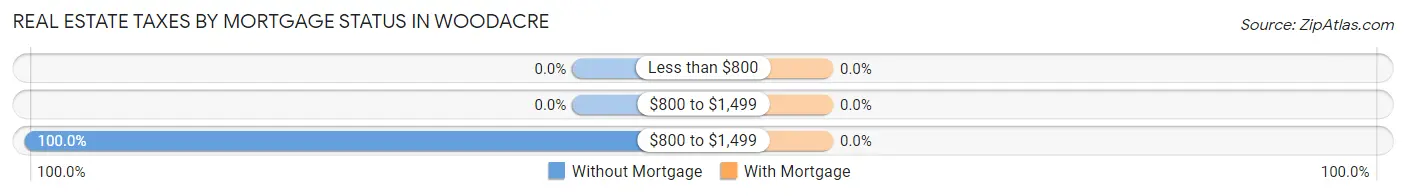
| Property Taxes | Without Mortgage | With Mortgage |
| Less than $800 | 0 (0.0%) | 0 (0.0%) |
| $800 to $1,499 | 0 (0.0%) | 0 (0.0%) |
| $800 to $1,499 | 77 (100.0%) | 0 (0.0%) |
| Total | 77 (100.0%) | 455 (100.0%) |
Health & Disability in Woodacre
Health Insurance Coverage by Age in Woodacre
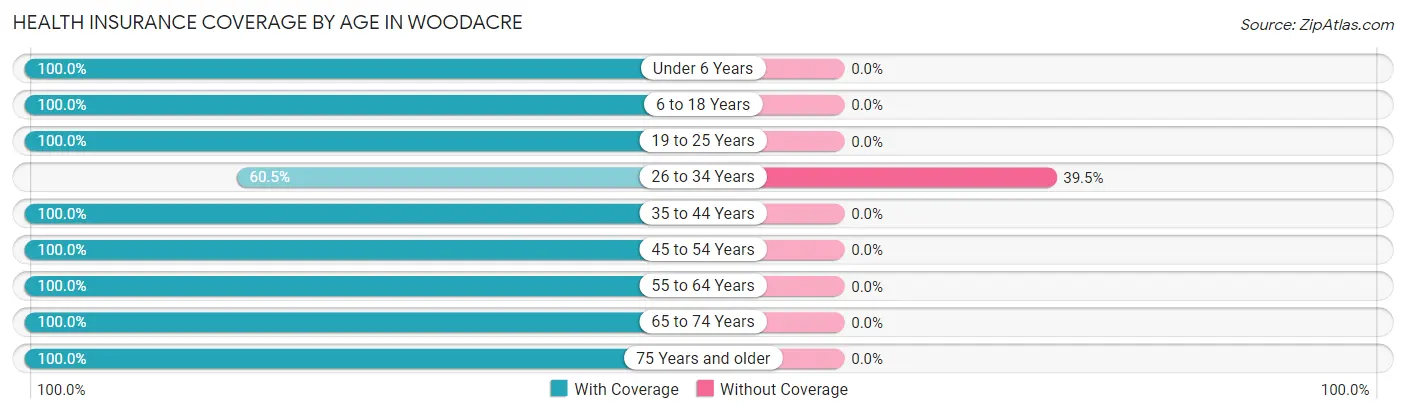
| Age Bracket | With Coverage | Without Coverage |
| Under 6 Years | 25 (100.0%) | 0 (0.0%) |
| 6 to 18 Years | 98 (100.0%) | 0 (0.0%) |
| 19 to 25 Years | 101 (100.0%) | 0 (0.0%) |
| 26 to 34 Years | 78 (60.5%) | 51 (39.5%) |
| 35 to 44 Years | 38 (100.0%) | 0 (0.0%) |
| 45 to 54 Years | 80 (100.0%) | 0 (0.0%) |
| 55 to 64 Years | 448 (100.0%) | 0 (0.0%) |
| 65 to 74 Years | 270 (100.0%) | 0 (0.0%) |
| 75 Years and older | 200 (100.0%) | 0 (0.0%) |
| Total | 1,338 (96.3%) | 51 (3.7%) |
Health Insurance Coverage by Citizenship Status in Woodacre

| Citizenship Status | With Coverage | Without Coverage |
| Native Born | 25 (100.0%) | 0 (0.0%) |
| Foreign Born, Citizen | 98 (100.0%) | 0 (0.0%) |
| Foreign Born, not a Citizen | 101 (100.0%) | 0 (0.0%) |
Health Insurance Coverage by Household Income in Woodacre
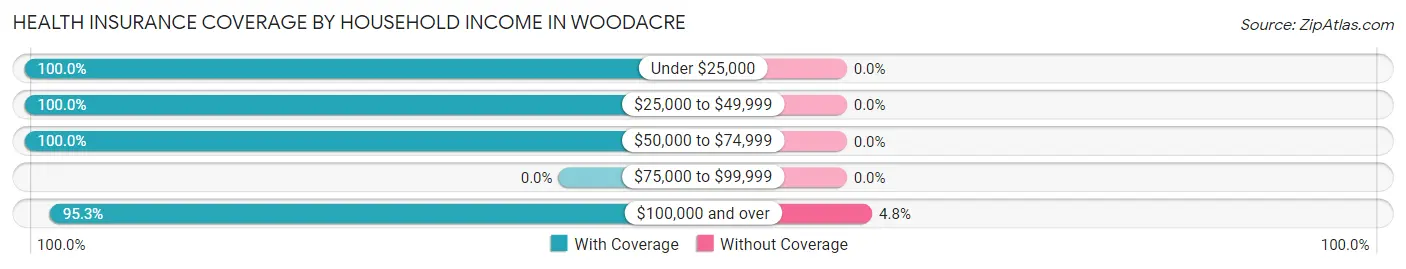
| Household Income | With Coverage | Without Coverage |
| Under $25,000 | 109 (100.0%) | 0 (0.0%) |
| $25,000 to $49,999 | 111 (100.0%) | 0 (0.0%) |
| $50,000 to $74,999 | 95 (100.0%) | 0 (0.0%) |
| $75,000 to $99,999 | 0 (0.0%) | 0 (0.0%) |
| $100,000 and over | 1,023 (95.3%) | 51 (4.8%) |
Public vs Private Health Insurance Coverage by Age in Woodacre
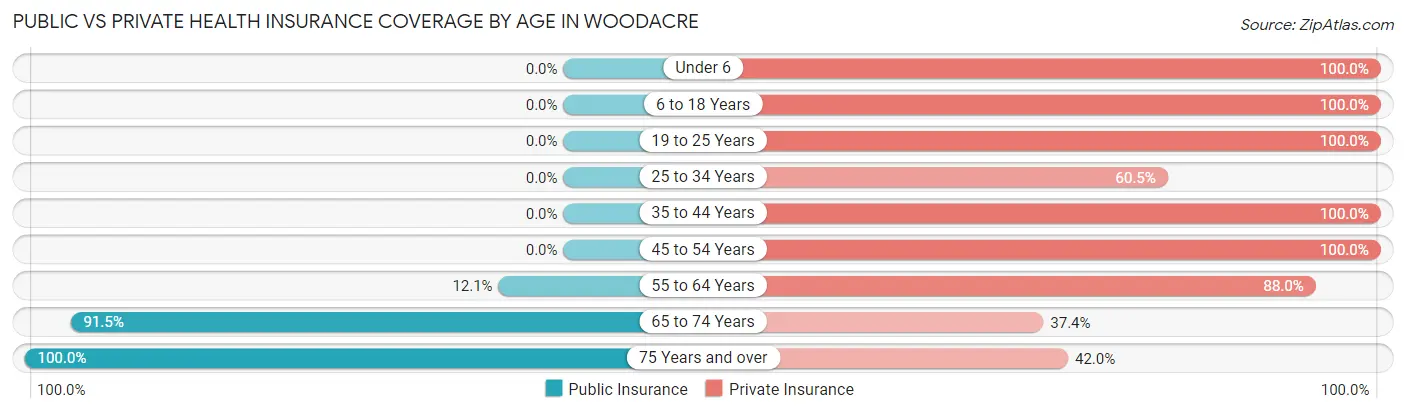
| Age Bracket | Public Insurance | Private Insurance |
| Under 6 | 0 (0.0%) | 25 (100.0%) |
| 6 to 18 Years | 0 (0.0%) | 98 (100.0%) |
| 19 to 25 Years | 0 (0.0%) | 101 (100.0%) |
| 25 to 34 Years | 0 (0.0%) | 78 (60.5%) |
| 35 to 44 Years | 0 (0.0%) | 38 (100.0%) |
| 45 to 54 Years | 0 (0.0%) | 80 (100.0%) |
| 55 to 64 Years | 54 (12.0%) | 394 (87.9%) |
| 65 to 74 Years | 247 (91.5%) | 101 (37.4%) |
| 75 Years and over | 200 (100.0%) | 84 (42.0%) |
| Total | 501 (36.1%) | 999 (71.9%) |
Disability Status by Sex by Age in Woodacre
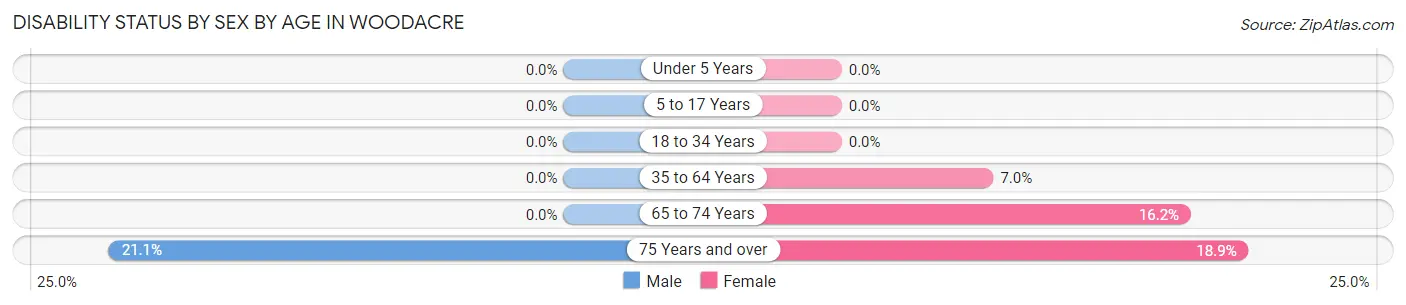
| Age Bracket | Male | Female |
| Under 5 Years | 0 (0.0%) | 0 (0.0%) |
| 5 to 17 Years | 0 (0.0%) | 0 (0.0%) |
| 18 to 34 Years | 0 (0.0%) | 0 (0.0%) |
| 35 to 64 Years | 0 (0.0%) | 19 (7.0%) |
| 65 to 74 Years | 0 (0.0%) | 23 (16.2%) |
| 75 Years and over | 31 (21.1%) | 10 (18.9%) |
Disability Class by Sex by Age in Woodacre
Disability Class: Hearing Difficulty
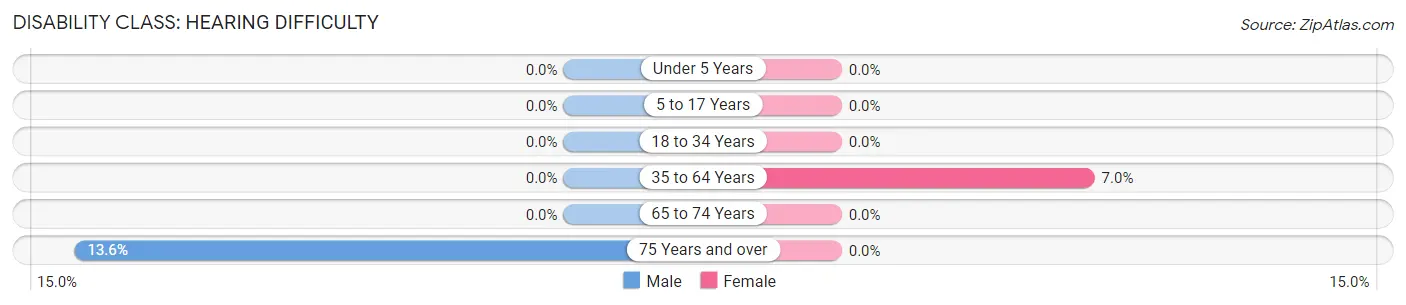
| Age Bracket | Male | Female |
| Under 5 Years | 0 (0.0%) | 0 (0.0%) |
| 5 to 17 Years | 0 (0.0%) | 0 (0.0%) |
| 18 to 34 Years | 0 (0.0%) | 0 (0.0%) |
| 35 to 64 Years | 0 (0.0%) | 19 (7.0%) |
| 65 to 74 Years | 0 (0.0%) | 0 (0.0%) |
| 75 Years and over | 20 (13.6%) | 0 (0.0%) |
Disability Class: Vision Difficulty
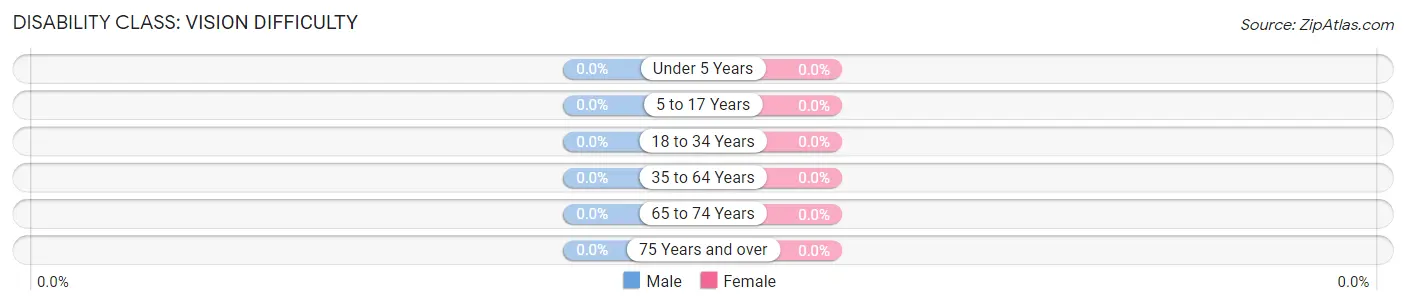
| Age Bracket | Male | Female |
| Under 5 Years | 0 (0.0%) | 0 (0.0%) |
| 5 to 17 Years | 0 (0.0%) | 0 (0.0%) |
| 18 to 34 Years | 0 (0.0%) | 0 (0.0%) |
| 35 to 64 Years | 0 (0.0%) | 0 (0.0%) |
| 65 to 74 Years | 0 (0.0%) | 0 (0.0%) |
| 75 Years and over | 0 (0.0%) | 0 (0.0%) |
Disability Class: Cognitive Difficulty
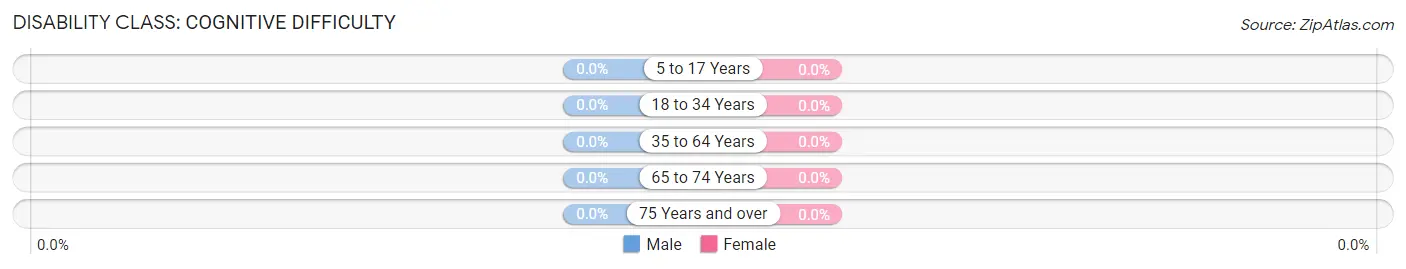
| Age Bracket | Male | Female |
| 5 to 17 Years | 0 (0.0%) | 0 (0.0%) |
| 18 to 34 Years | 0 (0.0%) | 0 (0.0%) |
| 35 to 64 Years | 0 (0.0%) | 0 (0.0%) |
| 65 to 74 Years | 0 (0.0%) | 0 (0.0%) |
| 75 Years and over | 0 (0.0%) | 0 (0.0%) |
Disability Class: Ambulatory Difficulty
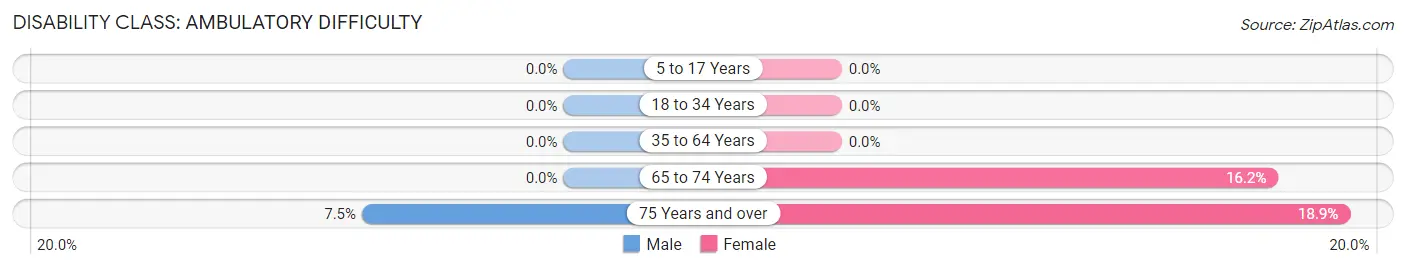
| Age Bracket | Male | Female |
| 5 to 17 Years | 0 (0.0%) | 0 (0.0%) |
| 18 to 34 Years | 0 (0.0%) | 0 (0.0%) |
| 35 to 64 Years | 0 (0.0%) | 0 (0.0%) |
| 65 to 74 Years | 0 (0.0%) | 23 (16.2%) |
| 75 Years and over | 11 (7.5%) | 10 (18.9%) |
Disability Class: Self-Care Difficulty
| Age Bracket | Male | Female |
| 5 to 17 Years | 0 (0.0%) | 0 (0.0%) |
| 18 to 34 Years | 0 (0.0%) | 0 (0.0%) |
| 35 to 64 Years | 0 (0.0%) | 0 (0.0%) |
| 65 to 74 Years | 0 (0.0%) | 0 (0.0%) |
| 75 Years and over | 0 (0.0%) | 0 (0.0%) |
Technology Access in Woodacre
Computing Device Access in Woodacre
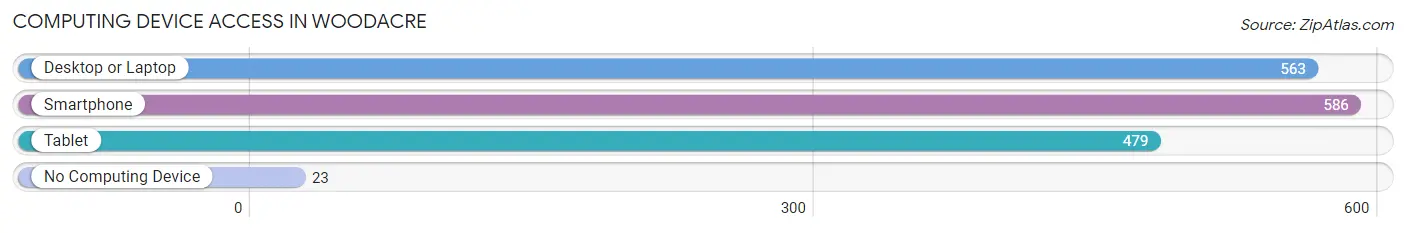
| Device Type | # Households | % Households |
| Desktop or Laptop | 563 | 92.4% |
| Smartphone | 586 | 96.2% |
| Tablet | 479 | 78.6% |
| No Computing Device | 23 | 3.8% |
| Total | 609 | 100.0% |
Internet Access in Woodacre
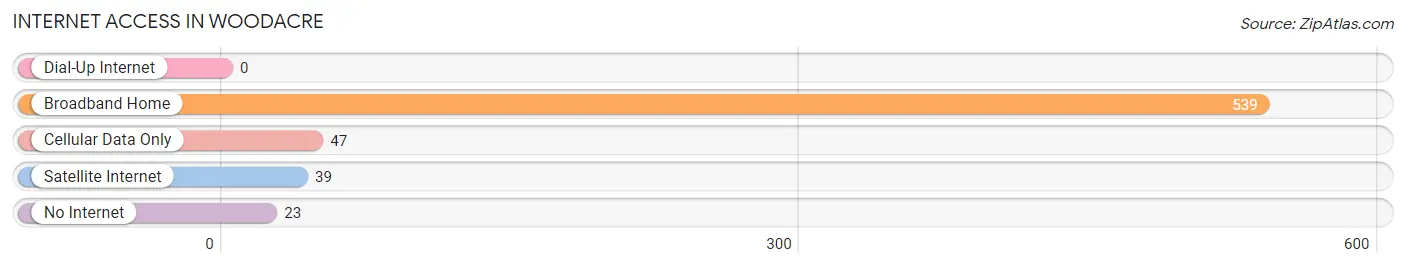
| Internet Type | # Households | % Households |
| Dial-Up Internet | 0 | 0.0% |
| Broadband Home | 539 | 88.5% |
| Cellular Data Only | 47 | 7.7% |
| Satellite Internet | 39 | 6.4% |
| No Internet | 23 | 3.8% |
| Total | 609 | 100.0% |
Woodacre Summary
Woodacre is a small unincorporated community located in Marin County, California. It is situated in the San Geronimo Valley, approximately 15 miles northwest of San Rafael and 25 miles north of San Francisco. The population of Woodacre was estimated to be 1,845 in 2019.
History
The area now known as Woodacre was originally inhabited by the Coast Miwok Native American tribe. The first European settlers arrived in the area in the mid-1800s, and the town was officially founded in 1867. The town was named after the Woodacre family, who were among the first settlers in the area.
The town was initially a small farming community, with the main crops being wheat, oats, and hay. In the early 1900s, the town began to grow as more people moved to the area. The town was home to a number of small businesses, including a general store, a blacksmith shop, and a post office.
In the 1950s, the town began to experience a period of rapid growth as more people moved to the area. This growth was largely due to the development of the nearby San Geronimo Valley Golf Course, which attracted many new residents to the area.
Geography
Woodacre is located in the San Geronimo Valley, which is surrounded by rolling hills and redwood forests. The town is situated at an elevation of approximately 500 feet above sea level. The climate in Woodacre is mild, with temperatures rarely dropping below freezing in the winter and rarely exceeding 90 degrees in the summer.
The town is located approximately 15 miles northwest of San Rafael and 25 miles north of San Francisco. It is also located near the Point Reyes National Seashore, which is a popular destination for outdoor activities such as hiking, camping, and fishing.
Economy
The economy of Woodacre is largely based on tourism and agriculture. The town is home to a number of small businesses, including restaurants, cafes, and shops. The nearby San Geronimo Valley Golf Course is a popular destination for golfers, and the town is also home to a number of wineries and vineyards.
The town is also home to a number of small farms, which produce a variety of fruits and vegetables. The town is also home to a number of artists and craftspeople, who sell their wares at local markets and festivals.
Demographics
The population of Woodacre was estimated to be 1,845 in 2019. The town is predominantly white, with approximately 75% of the population identifying as Caucasian. The remaining 25% of the population is made up of a variety of other ethnicities, including Hispanic, Asian, and African American.
The median household income in Woodacre is approximately $90,000, which is higher than the national average. The town has a low unemployment rate, and the majority of residents are employed in the tourism and agriculture industries.
Conclusion
Woodacre is a small unincorporated community located in Marin County, California. It is situated in the San Geronimo Valley, approximately 15 miles northwest of San Rafael and 25 miles north of San Francisco. The population of Woodacre was estimated to be 1,845 in 2019. The town is predominantly white, with approximately 75% of the population identifying as Caucasian. The economy of Woodacre is largely based on tourism and agriculture, and the town is home to a number of small businesses, farms, and artists.
Common Questions
What is Per Capita Income in Woodacre?
Per Capita income in Woodacre is $87,145.
What is the Median Family Income in Woodacre?
Median Family Income in Woodacre is $229,750.
What is the Median Household income in Woodacre?
Median Household Income in Woodacre is $144,632.
What is Inequality or Gini Index in Woodacre?
Inequality or Gini Index in Woodacre is 0.44.
What is the Total Population of Woodacre?
Total Population of Woodacre is 1,389.
What is the Total Male Population of Woodacre?
Total Male Population of Woodacre is 789.
What is the Total Female Population of Woodacre?
Total Female Population of Woodacre is 600.
What is the Ratio of Males per 100 Females in Woodacre?
There are 131.50 Males per 100 Females in Woodacre.
What is the Ratio of Females per 100 Males in Woodacre?
There are 76.05 Females per 100 Males in Woodacre.
What is the Median Population Age in Woodacre?
Median Population Age in Woodacre is 61.2 Years.
What is the Average Family Size in Woodacre
Average Family Size in Woodacre is 2.7 People.
What is the Average Household Size in Woodacre
Average Household Size in Woodacre is 2.3 People.
How Large is the Labor Force in Woodacre?
There are 1,029 People in the Labor Forcein in Woodacre.
What is the Percentage of People in the Labor Force in Woodacre?
78.7% of People are in the Labor Force in Woodacre.
What is the Unemployment Rate in Woodacre?
Unemployment Rate in Woodacre is 6.2%.