Cities with the Highest Percentage of Families with Income Above $200,000 in New York
RELATED REPORTS & OPTIONS
Family Income | $200k+
New York
Compare Cities
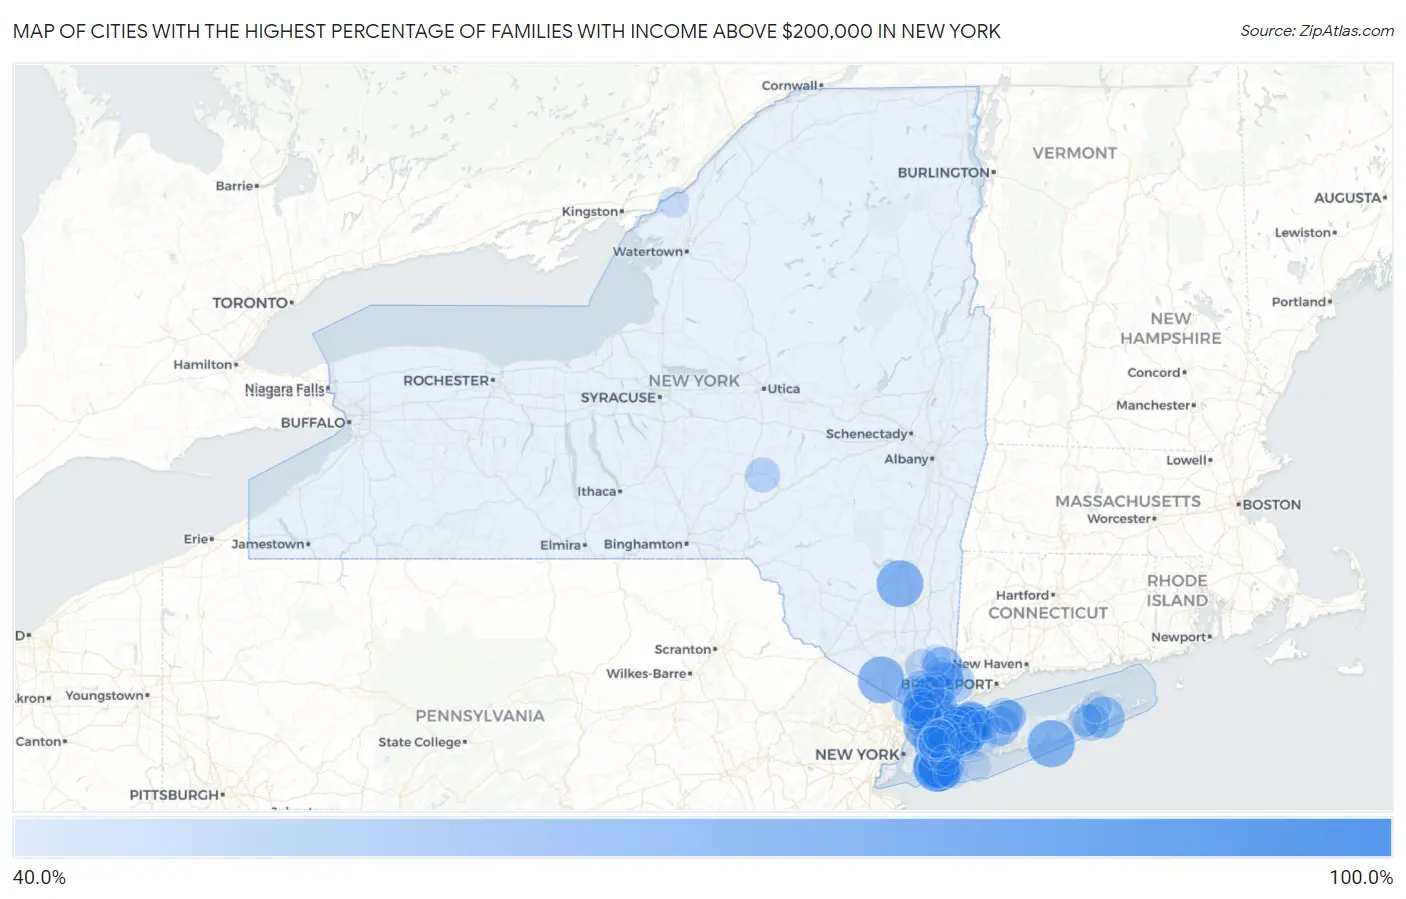
Map of Cities with the Highest Percentage of Families with Income Above $200,000 in New York
0.0%
100.0%
Cities with the Highest Percentage of Families with Income Above $200,000 in New York
| City | Families with Income > $200k | vs State | vs National | |
| 1. | Oak Beach | 100.0% | 19.2%(+80.8)#1 | 14.8%(+85.2)#10 |
| 2. | White Lake | 100.0% | 19.2%(+80.8)#2 | 14.8%(+85.2)#21 |
| 3. | Bard College | 85.5% | 19.2%(+66.3)#3 | 14.8%(+70.7)#64 |
| 4. | Hewlett Bay Park | 81.4% | 19.2%(+62.2)#4 | 14.8%(+66.6)#77 |
| 5. | Plandome Heights | 80.4% | 19.2%(+61.2)#5 | 14.8%(+65.6)#81 |
| 6. | Woodsburgh | 80.2% | 19.2%(+61.0)#6 | 14.8%(+65.4)#85 |
| 7. | Cove Neck | 79.2% | 19.2%(+60.0)#7 | 14.8%(+64.4)#93 |
| 8. | Plandome | 78.1% | 19.2%(+58.9)#8 | 14.8%(+63.3)#96 |
| 9. | West Hampton Dunes | 77.8% | 19.2%(+58.6)#9 | 14.8%(+63.0)#97 |
| 10. | Scarsdale | 77.4% | 19.2%(+58.2)#10 | 14.8%(+62.6)#99 |
| 11. | Rifton | 77.2% | 19.2%(+58.0)#11 | 14.8%(+62.4)#101 |
| 12. | Tuxedo Park | 77.0% | 19.2%(+57.8)#12 | 14.8%(+62.2)#103 |
| 13. | Laurel Hollow | 76.3% | 19.2%(+57.1)#13 | 14.8%(+61.5)#105 |
| 14. | Pelham Manor | 74.6% | 19.2%(+55.4)#14 | 14.8%(+59.8)#121 |
| 15. | Munsey Park | 73.0% | 19.2%(+53.8)#15 | 14.8%(+58.2)#140 |
| 16. | Huntington Bay | 72.6% | 19.2%(+53.4)#16 | 14.8%(+57.8)#144 |
| 17. | Brookville | 71.3% | 19.2%(+52.1)#17 | 14.8%(+56.5)#163 |
| 18. | East Hills | 71.0% | 19.2%(+51.8)#18 | 14.8%(+56.2)#167 |
| 19. | Sands Point | 70.7% | 19.2%(+51.5)#19 | 14.8%(+55.9)#173 |
| 20. | Hewlett Harbor | 70.5% | 19.2%(+51.3)#20 | 14.8%(+55.7)#174 |
| 21. | Lattingtown | 69.9% | 19.2%(+50.7)#21 | 14.8%(+55.1)#183 |
| 22. | Halesite | 69.7% | 19.2%(+50.5)#22 | 14.8%(+54.9)#184 |
| 23. | Cold Spring Harbor | 69.1% | 19.2%(+49.9)#23 | 14.8%(+54.3)#192 |
| 24. | Wainscott | 69.0% | 19.2%(+49.8)#24 | 14.8%(+54.2)#195 |
| 25. | Hewlett Neck | 68.6% | 19.2%(+49.4)#25 | 14.8%(+53.8)#198 |
| 26. | Rye | 68.3% | 19.2%(+49.1)#26 | 14.8%(+53.5)#202 |
| 27. | Setauket | 68.3% | 19.2%(+49.1)#27 | 14.8%(+53.5)#203 |
| 28. | Golden S Bridge | 67.9% | 19.2%(+48.7)#28 | 14.8%(+53.1)#214 |
| 29. | Ardsley | 66.8% | 19.2%(+47.6)#29 | 14.8%(+52.0)#227 |
| 30. | Oyster Bay Cove | 66.4% | 19.2%(+47.2)#30 | 14.8%(+51.6)#237 |
| 31. | Eatons Neck | 66.2% | 19.2%(+47.0)#31 | 14.8%(+51.4)#243 |
| 32. | Flower Hill | 65.9% | 19.2%(+46.7)#32 | 14.8%(+51.1)#248 |
| 33. | Head Of The Harbor | 65.1% | 19.2%(+45.9)#33 | 14.8%(+50.3)#263 |
| 34. | Scotts Corners | 64.9% | 19.2%(+45.7)#34 | 14.8%(+50.1)#267 |
| 35. | Larchmont | 64.6% | 19.2%(+45.4)#35 | 14.8%(+49.8)#275 |
| 36. | Roslyn Estates | 64.6% | 19.2%(+45.4)#36 | 14.8%(+49.8)#276 |
| 37. | Bedford | 64.2% | 19.2%(+45.0)#37 | 14.8%(+49.4)#285 |
| 38. | Lake Success | 64.1% | 19.2%(+44.9)#38 | 14.8%(+49.3)#287 |
| 39. | Old Westbury | 63.4% | 19.2%(+44.2)#39 | 14.8%(+48.6)#303 |
| 40. | Lawrence | 63.3% | 19.2%(+44.1)#40 | 14.8%(+48.5)#305 |
| 41. | Armonk | 63.0% | 19.2%(+43.8)#41 | 14.8%(+48.2)#312 |
| 42. | Plandome Manor | 63.0% | 19.2%(+43.8)#42 | 14.8%(+48.2)#313 |
| 43. | East Williston | 62.2% | 19.2%(+43.0)#43 | 14.8%(+47.4)#336 |
| 44. | Kensington | 62.1% | 19.2%(+42.9)#44 | 14.8%(+47.3)#341 |
| 45. | Garden City | 61.6% | 19.2%(+42.4)#45 | 14.8%(+46.8)#352 |
| 46. | Bronxville | 61.4% | 19.2%(+42.2)#46 | 14.8%(+46.6)#364 |
| 47. | Sparkill | 61.3% | 19.2%(+42.1)#47 | 14.8%(+46.5)#372 |
| 48. | Centre Island | 61.3% | 19.2%(+42.1)#48 | 14.8%(+46.5)#373 |
| 49. | Old Field | 61.0% | 19.2%(+41.8)#49 | 14.8%(+46.2)#382 |
| 50. | Water Mill | 60.8% | 19.2%(+41.6)#50 | 14.8%(+46.0)#386 |
| 51. | Upper Brookville | 60.4% | 19.2%(+41.2)#51 | 14.8%(+45.6)#397 |
| 52. | Briarcliff Manor | 60.3% | 19.2%(+41.1)#52 | 14.8%(+45.5)#399 |
| 53. | Lloyd Harbor | 59.7% | 19.2%(+40.5)#53 | 14.8%(+44.9)#416 |
| 54. | Roslyn Harbor | 59.2% | 19.2%(+40.0)#54 | 14.8%(+44.4)#427 |
| 55. | Greenville Cdp Westchester County | 58.6% | 19.2%(+39.4)#55 | 14.8%(+43.8)#442 |
| 56. | Muttontown | 58.6% | 19.2%(+39.4)#56 | 14.8%(+43.8)#444 |
| 57. | East Norwich | 58.4% | 19.2%(+39.2)#57 | 14.8%(+43.6)#456 |
| 58. | Upper Nyack | 58.4% | 19.2%(+39.2)#58 | 14.8%(+43.6)#457 |
| 59. | Poquott | 58.4% | 19.2%(+39.2)#59 | 14.8%(+43.6)#459 |
| 60. | Morris | 58.0% | 19.2%(+38.8)#60 | 14.8%(+43.2)#471 |
| 61. | Mill Neck | 57.9% | 19.2%(+38.7)#61 | 14.8%(+43.1)#474 |
| 62. | North Hills | 57.5% | 19.2%(+38.3)#62 | 14.8%(+42.7)#488 |
| 63. | Crompond | 57.3% | 19.2%(+38.1)#63 | 14.8%(+42.5)#497 |
| 64. | Pleasantville | 57.1% | 19.2%(+37.9)#64 | 14.8%(+42.3)#502 |
| 65. | Hartsdale | 57.1% | 19.2%(+37.9)#65 | 14.8%(+42.3)#503 |
| 66. | Bellerose | 56.6% | 19.2%(+37.4)#66 | 14.8%(+41.8)#525 |
| 67. | Rye Brook | 56.4% | 19.2%(+37.2)#67 | 14.8%(+41.6)#534 |
| 68. | Russell Gardens | 56.1% | 19.2%(+36.9)#68 | 14.8%(+41.3)#547 |
| 69. | Dix Hills | 55.8% | 19.2%(+36.6)#69 | 14.8%(+41.0)#551 |
| 70. | Irvington | 55.4% | 19.2%(+36.2)#70 | 14.8%(+40.6)#564 |
| 71. | Hastings On Hudson | 55.0% | 19.2%(+35.8)#71 | 14.8%(+40.2)#578 |
| 72. | North Sea | 55.0% | 19.2%(+35.8)#72 | 14.8%(+40.2)#579 |
| 73. | Matinecock | 55.0% | 19.2%(+35.8)#73 | 14.8%(+40.2)#581 |
| 74. | Baxter Estates | 54.6% | 19.2%(+35.4)#74 | 14.8%(+39.8)#596 |
| 75. | Bridgeville | 54.5% | 19.2%(+35.3)#75 | 14.8%(+39.7)#600 |
| 76. | Great Neck Gardens | 54.1% | 19.2%(+34.9)#76 | 14.8%(+39.3)#615 |
| 77. | Belle Terre | 53.7% | 19.2%(+34.5)#77 | 14.8%(+38.9)#635 |
| 78. | Eastchester | 53.6% | 19.2%(+34.4)#78 | 14.8%(+38.8)#636 |
| 79. | Manhasset | 53.6% | 19.2%(+34.4)#79 | 14.8%(+38.8)#637 |
| 80. | Sea Cliff | 53.6% | 19.2%(+34.4)#80 | 14.8%(+38.8)#638 |
| 81. | Searingtown | 53.4% | 19.2%(+34.2)#81 | 14.8%(+38.6)#645 |
| 82. | Port Washington | 53.3% | 19.2%(+34.1)#82 | 14.8%(+38.5)#648 |
| 83. | Point Lookout | 53.2% | 19.2%(+34.0)#83 | 14.8%(+38.4)#656 |
| 84. | Katonah | 53.1% | 19.2%(+33.9)#84 | 14.8%(+38.3)#658 |
| 85. | Port Washington North | 53.0% | 19.2%(+33.8)#85 | 14.8%(+38.2)#662 |
| 86. | Plainview | 52.7% | 19.2%(+33.5)#86 | 14.8%(+37.9)#676 |
| 87. | Old Bethpage | 52.7% | 19.2%(+33.5)#87 | 14.8%(+37.9)#678 |
| 88. | Thornwood | 52.7% | 19.2%(+33.5)#88 | 14.8%(+37.9)#679 |
| 89. | Great Neck Estates | 51.8% | 19.2%(+32.6)#89 | 14.8%(+37.0)#714 |
| 90. | Syosset | 51.6% | 19.2%(+32.4)#90 | 14.8%(+36.8)#722 |
| 91. | Centerport | 51.6% | 19.2%(+32.4)#91 | 14.8%(+36.8)#724 |
| 92. | North Haven | 51.5% | 19.2%(+32.3)#92 | 14.8%(+36.7)#733 |
| 93. | Thousand Island Park | 51.4% | 19.2%(+32.2)#93 | 14.8%(+36.6)#737 |
| 94. | Village Of The Branch | 51.3% | 19.2%(+32.1)#94 | 14.8%(+36.5)#740 |
| 95. | Gilgo | 50.9% | 19.2%(+31.7)#95 | 14.8%(+36.1)#753 |
| 96. | Lincolndale | 50.7% | 19.2%(+31.5)#96 | 14.8%(+35.9)#760 |
| 97. | Rockville Centre | 50.3% | 19.2%(+31.1)#97 | 14.8%(+35.5)#768 |
| 98. | Fort Salonga | 50.0% | 19.2%(+30.8)#98 | 14.8%(+35.2)#781 |
| 99. | North Blenheim | 50.0% | 19.2%(+30.8)#99 | 14.8%(+35.2)#792 |
| 100. | Lido Beach | 49.9% | 19.2%(+30.7)#100 | 14.8%(+35.1)#801 |
Common Questions
What are the Top 10 Cities with the Highest Percentage of Families with Income Above $200,000 in New York?
Top 10 Cities with the Highest Percentage of Families with Income Above $200,000 in New York are:
#1
81.4%
#2
80.4%
#3
80.2%
#4
79.2%
#5
78.1%
#6
77.8%
#7
77.4%
#8
77.2%
#9
77.0%
#10
76.3%
What city has the Highest Percentage of Families with Income Above $200,000 in New York?
Hewlett Bay Park has the Highest Percentage of Families with Income Above $200,000 in New York with 81.4%.
What is the Percentage of Families with Income Above $200,000 in the State of New York?
Percentage of Families with Income Above $200,000 in New York is 19.2%.
What is the Percentage of Families with Income Above $200,000 in the United States?
Percentage of Families with Income Above $200,000 in the United States is 14.8%.