Cities with the Highest Percentage of Families with Income Above $200,000 in Colorado
RELATED REPORTS & OPTIONS
Family Income | $200k+
Colorado
Compare Cities
Map of Cities with the Highest Percentage of Families with Income Above $200,000 in Colorado
0.0%
100.0%
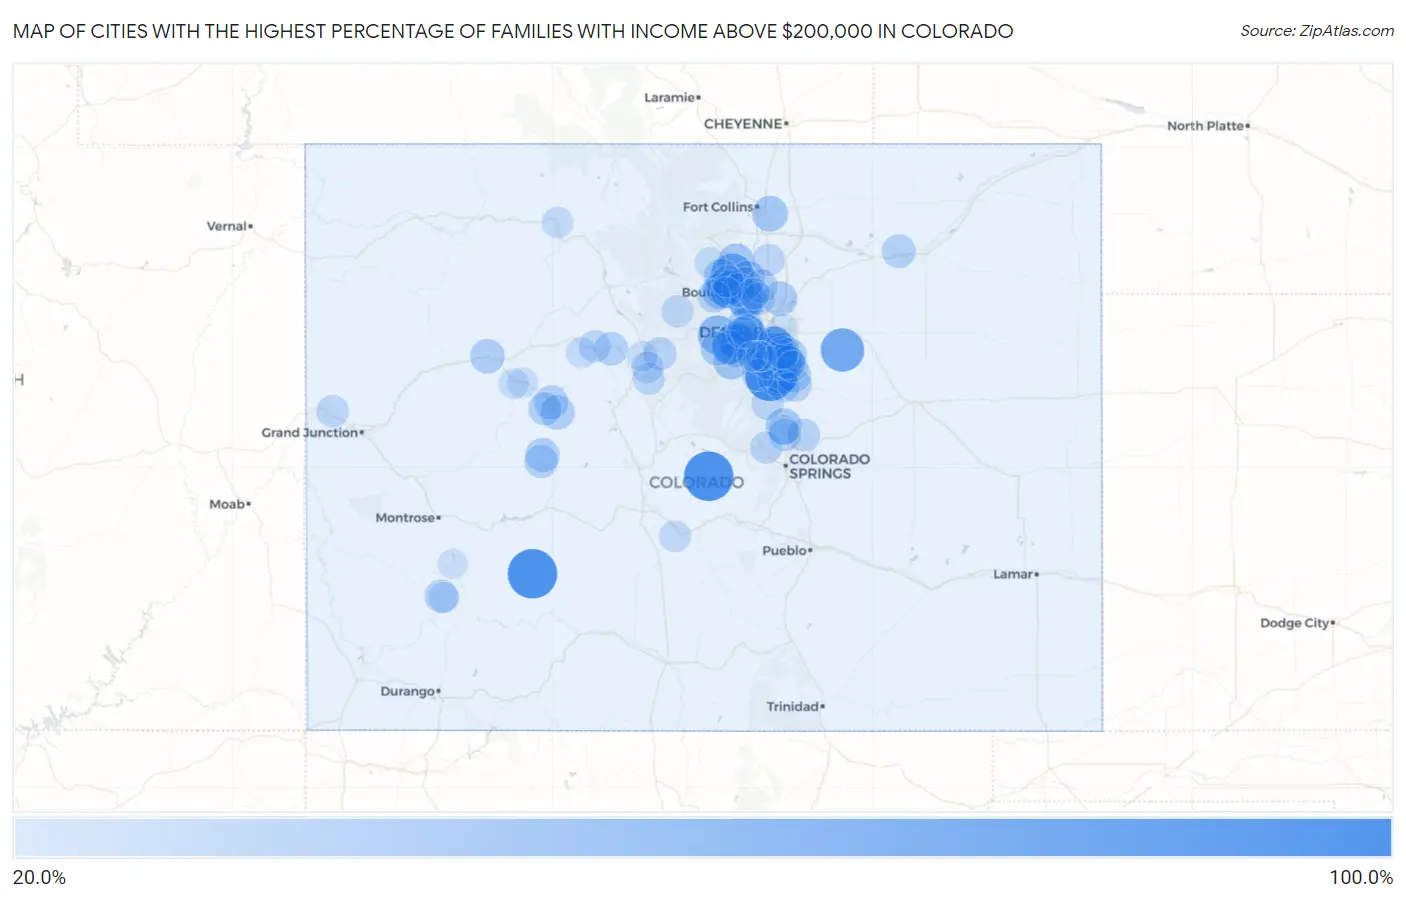
Cities with the Highest Percentage of Families with Income Above $200,000 in Colorado
| City | Families with Income > $200k | vs State | vs National | |
| 1. | Sedalia | 100.0% | 18.4%(+81.6)#1 | 14.8%(+85.2)#34 |
| 2. | Guffey | 100.0% | 18.4%(+81.6)#2 | 14.8%(+85.2)#38 |
| 3. | Cathedral | 100.0% | 18.4%(+81.6)#3 | 14.8%(+85.2)#48 |
| 4. | Comanche Creek | 75.0% | 18.4%(+56.6)#4 | 14.8%(+60.2)#115 |
| 5. | Altona | 72.8% | 18.4%(+54.4)#5 | 14.8%(+58.0)#142 |
| 6. | Upper Witter Gulch | 68.9% | 18.4%(+50.5)#6 | 14.8%(+54.1)#197 |
| 7. | Columbine Valley | 68.1% | 18.4%(+49.7)#7 | 14.8%(+53.3)#207 |
| 8. | Cherry Hills Village | 68.0% | 18.4%(+49.6)#8 | 14.8%(+53.2)#210 |
| 9. | Echo Hills | 62.3% | 18.4%(+43.9)#9 | 14.8%(+47.5)#334 |
| 10. | Seven Hills | 60.0% | 18.4%(+41.6)#10 | 14.8%(+45.2)#408 |
| 11. | Castle Pines Village | 59.1% | 18.4%(+40.7)#11 | 14.8%(+44.3)#429 |
| 12. | Floyd Hill | 57.8% | 18.4%(+39.4)#12 | 14.8%(+43.0)#477 |
| 13. | Kittredge | 55.8% | 18.4%(+37.4)#13 | 14.8%(+41.0)#554 |
| 14. | Stepping Stone | 55.2% | 18.4%(+36.8)#14 | 14.8%(+40.4)#571 |
| 15. | Bow Mar | 53.1% | 18.4%(+34.7)#15 | 14.8%(+38.3)#660 |
| 16. | Greenwood Village | 52.9% | 18.4%(+34.5)#16 | 14.8%(+38.1)#666 |
| 17. | East Pleasant View | 52.9% | 18.4%(+34.5)#17 | 14.8%(+38.1)#671 |
| 18. | Paragon Estates | 52.8% | 18.4%(+34.4)#18 | 14.8%(+38.0)#675 |
| 19. | Meridian | 51.5% | 18.4%(+33.1)#19 | 14.8%(+36.7)#732 |
| 20. | Cherry Creek | 49.2% | 18.4%(+30.8)#20 | 14.8%(+34.4)#827 |
| 21. | Idledale | 49.1% | 18.4%(+30.7)#21 | 14.8%(+34.3)#838 |
| 22. | Castle Pines | 48.4% | 18.4%(+30.0)#22 | 14.8%(+33.6)#866 |
| 23. | Indian Hills | 47.5% | 18.4%(+29.1)#23 | 14.8%(+32.7)#902 |
| 24. | Sterling Ranch | 46.9% | 18.4%(+28.5)#24 | 14.8%(+32.1)#938 |
| 25. | Genesee | 46.4% | 18.4%(+28.0)#25 | 14.8%(+31.6)#976 |
| 26. | Crisman | 46.0% | 18.4%(+27.6)#26 | 14.8%(+31.2)#995 |
| 27. | Aspen Park | 45.2% | 18.4%(+26.8)#27 | 14.8%(+30.4)#1,042 |
| 28. | Woodmoor | 44.9% | 18.4%(+26.5)#28 | 14.8%(+30.1)#1,057 |
| 29. | Grand View Estates | 44.2% | 18.4%(+25.8)#29 | 14.8%(+29.4)#1,088 |
| 30. | Timnath | 43.8% | 18.4%(+25.4)#30 | 14.8%(+29.0)#1,112 |
| 31. | Sugarloaf | 43.8% | 18.4%(+25.4)#31 | 14.8%(+29.0)#1,115 |
| 32. | Lyons | 43.7% | 18.4%(+25.3)#32 | 14.8%(+28.9)#1,126 |
| 33. | Niwot | 43.6% | 18.4%(+25.2)#33 | 14.8%(+28.8)#1,131 |
| 34. | Louisville | 42.8% | 18.4%(+24.4)#34 | 14.8%(+28.0)#1,186 |
| 35. | Lone Tree | 41.6% | 18.4%(+23.2)#35 | 14.8%(+26.8)#1,288 |
| 36. | Fairmount | 41.3% | 18.4%(+22.9)#36 | 14.8%(+26.5)#1,306 |
| 37. | Holly Hills | 40.9% | 18.4%(+22.5)#37 | 14.8%(+26.1)#1,333 |
| 38. | Jamestown | 40.3% | 18.4%(+21.9)#38 | 14.8%(+25.5)#1,385 |
| 39. | Todd Creek | 39.5% | 18.4%(+21.1)#39 | 14.8%(+24.7)#1,460 |
| 40. | Chacra | 39.1% | 18.4%(+20.7)#40 | 14.8%(+24.3)#1,496 |
| 41. | Evergreen | 38.6% | 18.4%(+20.2)#41 | 14.8%(+23.8)#1,525 |
| 42. | Aspen | 38.6% | 18.4%(+20.2)#42 | 14.8%(+23.8)#1,526 |
| 43. | The Pinery | 38.5% | 18.4%(+20.1)#43 | 14.8%(+23.7)#1,540 |
| 44. | Placerville | 38.4% | 18.4%(+20.0)#44 | 14.8%(+23.6)#1,553 |
| 45. | Pine Brook Hill | 37.9% | 18.4%(+19.5)#45 | 14.8%(+23.1)#1,588 |
| 46. | Mount Crested Butte | 37.8% | 18.4%(+19.4)#46 | 14.8%(+23.0)#1,597 |
| 47. | Superior | 37.3% | 18.4%(+18.9)#47 | 14.8%(+22.5)#1,629 |
| 48. | Woody Creek | 37.3% | 18.4%(+18.9)#48 | 14.8%(+22.5)#1,635 |
| 49. | Applewood | 36.6% | 18.4%(+18.2)#49 | 14.8%(+21.8)#1,696 |
| 50. | Foxfield | 36.6% | 18.4%(+18.2)#50 | 14.8%(+21.8)#1,700 |
| 51. | Morgan Heights | 36.6% | 18.4%(+18.2)#51 | 14.8%(+21.8)#1,701 |
| 52. | Upper Bear Creek | 36.2% | 18.4%(+17.8)#52 | 14.8%(+21.4)#1,729 |
| 53. | Gunbarrel | 35.9% | 18.4%(+17.5)#53 | 14.8%(+21.1)#1,752 |
| 54. | Vail | 35.9% | 18.4%(+17.5)#54 | 14.8%(+21.1)#1,755 |
| 55. | Highlands Ranch | 35.6% | 18.4%(+17.2)#55 | 14.8%(+20.8)#1,777 |
| 56. | Crested Butte | 35.3% | 18.4%(+16.9)#56 | 14.8%(+20.5)#1,812 |
| 57. | Snowmass Village | 35.2% | 18.4%(+16.8)#57 | 14.8%(+20.4)#1,822 |
| 58. | Franktown | 35.2% | 18.4%(+16.8)#58 | 14.8%(+20.4)#1,825 |
| 59. | Boulder | 35.1% | 18.4%(+16.7)#59 | 14.8%(+20.3)#1,827 |
| 60. | Erie | 34.6% | 18.4%(+16.2)#60 | 14.8%(+19.8)#1,872 |
| 61. | Mountain Village | 34.5% | 18.4%(+16.1)#61 | 14.8%(+19.7)#1,892 |
| 62. | Stonegate | 34.4% | 18.4%(+16.0)#62 | 14.8%(+19.6)#1,900 |
| 63. | Keystone | 34.0% | 18.4%(+15.6)#63 | 14.8%(+19.2)#1,940 |
| 64. | Inverness | 33.8% | 18.4%(+15.4)#64 | 14.8%(+19.0)#1,957 |
| 65. | Black Forest | 32.6% | 18.4%(+14.2)#65 | 14.8%(+17.8)#2,076 |
| 66. | St Ann Highlands | 32.2% | 18.4%(+13.8)#66 | 14.8%(+17.4)#2,135 |
| 67. | Gleneagle | 31.5% | 18.4%(+13.1)#67 | 14.8%(+16.7)#2,201 |
| 68. | Mead | 31.1% | 18.4%(+12.7)#68 | 14.8%(+16.3)#2,246 |
| 69. | Centennial | 30.9% | 18.4%(+12.5)#69 | 14.8%(+16.1)#2,256 |
| 70. | Broomfield | 30.8% | 18.4%(+12.4)#70 | 14.8%(+16.0)#2,266 |
| 71. | Cascade Chipita Park | 30.8% | 18.4%(+12.4)#71 | 14.8%(+16.0)#2,275 |
| 72. | Perry Park | 30.4% | 18.4%(+12.0)#72 | 14.8%(+15.6)#2,323 |
| 73. | Loma | 30.4% | 18.4%(+12.0)#73 | 14.8%(+15.6)#2,324 |
| 74. | Castle Rock | 30.1% | 18.4%(+11.7)#74 | 14.8%(+15.3)#2,353 |
| 75. | Lazy Acres | 30.1% | 18.4%(+11.7)#75 | 14.8%(+15.3)#2,362 |
| 76. | Winter Park | 30.0% | 18.4%(+11.6)#76 | 14.8%(+15.2)#2,372 |
| 77. | Avon | 29.9% | 18.4%(+11.5)#77 | 14.8%(+15.1)#2,379 |
| 78. | Golden | 29.8% | 18.4%(+11.4)#78 | 14.8%(+15.0)#2,388 |
| 79. | Blue River | 29.8% | 18.4%(+11.4)#79 | 14.8%(+15.0)#2,394 |
| 80. | Breckenridge | 29.7% | 18.4%(+11.3)#80 | 14.8%(+14.9)#2,406 |
| 81. | Coaldale | 28.8% | 18.4%(+10.4)#81 | 14.8%(+14.0)#2,537 |
| 82. | Roxborough Park | 28.5% | 18.4%(+10.1)#82 | 14.8%(+13.7)#2,583 |
| 83. | Lafayette | 28.1% | 18.4%(+9.70)#83 | 14.8%(+13.3)#2,633 |
| 84. | Steamboat Springs | 27.5% | 18.4%(+9.10)#84 | 14.8%(+12.7)#2,730 |
| 85. | Allenspark | 26.1% | 18.4%(+7.70)#85 | 14.8%(+11.3)#2,932 |
| 86. | Edwards | 26.0% | 18.4%(+7.60)#86 | 14.8%(+11.2)#2,945 |
| 87. | Parker | 25.9% | 18.4%(+7.50)#87 | 14.8%(+11.1)#2,957 |
| 88. | Telluride | 25.0% | 18.4%(+6.60)#88 | 14.8%(+10.2)#3,105 |
| 89. | Tall Timber | 24.4% | 18.4%(+6.00)#89 | 14.8%(+9.60)#3,224 |
| 90. | Frisco | 24.3% | 18.4%(+5.90)#90 | 14.8%(+9.50)#3,237 |
| 91. | Catherine | 24.0% | 18.4%(+5.60)#91 | 14.8%(+9.20)#3,289 |
| 92. | Monument | 23.8% | 18.4%(+5.40)#92 | 14.8%(+9.00)#3,317 |
| 93. | Carbondale | 23.8% | 18.4%(+5.40)#93 | 14.8%(+9.00)#3,321 |
| 94. | Columbine | 23.4% | 18.4%(+5.00)#94 | 14.8%(+8.60)#3,388 |
| 95. | Sierra Ridge | 22.8% | 18.4%(+4.40)#95 | 14.8%(+8.00)#3,500 |
| 96. | Denver | 22.5% | 18.4%(+4.10)#96 | 14.8%(+7.70)#3,557 |
| 97. | Ridgway | 22.3% | 18.4%(+3.90)#97 | 14.8%(+7.50)#3,614 |
| 98. | Marvel | 22.2% | 18.4%(+3.80)#98 | 14.8%(+7.40)#3,639 |
| 99. | Littleton | 22.1% | 18.4%(+3.70)#99 | 14.8%(+7.30)#3,646 |
| 100. | Ken Caryl | 21.8% | 18.4%(+3.40)#100 | 14.8%(+7.00)#3,715 |
Common Questions
What are the Top 10 Cities with the Highest Percentage of Families with Income Above $200,000 in Colorado?
Top 10 Cities with the Highest Percentage of Families with Income Above $200,000 in Colorado are:
#1
100.0%
#2
100.0%
#3
100.0%
#4
75.0%
#5
72.8%
#6
68.1%
#7
68.0%
#8
60.0%
#9
59.1%
#10
57.8%
What city has the Highest Percentage of Families with Income Above $200,000 in Colorado?
Sedalia has the Highest Percentage of Families with Income Above $200,000 in Colorado with 100.0%.
What is the Percentage of Families with Income Above $200,000 in the State of Colorado?
Percentage of Families with Income Above $200,000 in Colorado is 18.4%.
What is the Percentage of Families with Income Above $200,000 in the United States?
Percentage of Families with Income Above $200,000 in the United States is 14.8%.