Zip Codes with the Highest Percentage of Families with Income Above $200,000 in San Jose, CA
RELATED REPORTS & OPTIONS
Family Income | $200k+
San Jose
Compare Zip Codes
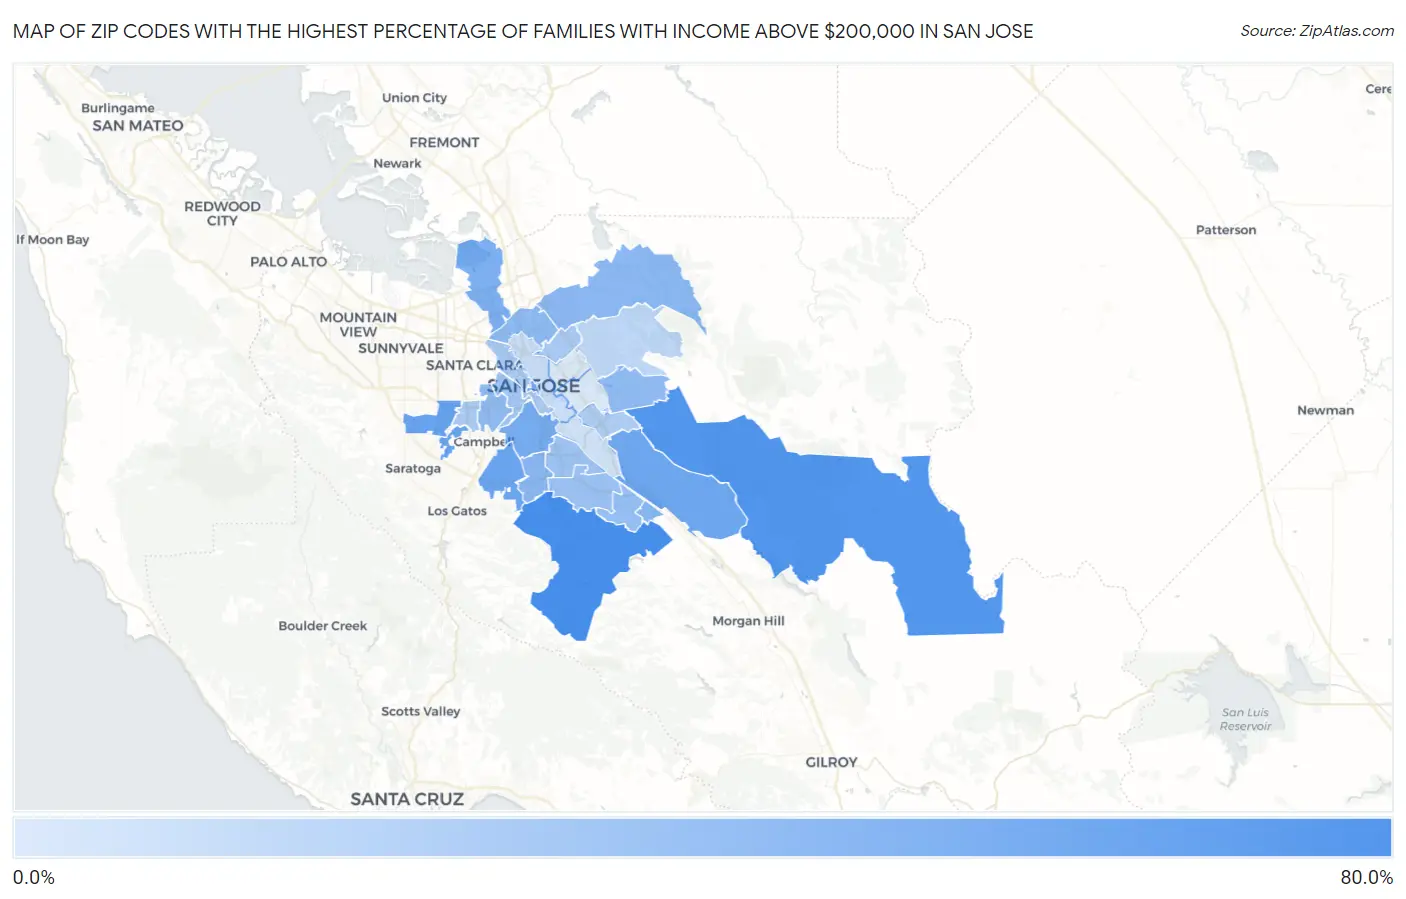
Map of Zip Codes with the Highest Percentage of Families with Income Above $200,000 in San Jose
15.3%
65.8%
Zip Codes with the Highest Percentage of Families with Income Above $200,000 in San Jose, CA
| Zip Code | Families with Income > $200k | vs State | vs National | |
| 1. | 95120 | 65.8% | 21.1%(+44.7)#27 | 14.8%(+51.0)#175 |
| 2. | 95135 | 61.1% | 21.1%(+40.0)#46 | 14.8%(+46.3)#265 |
| 3. | 95129 | 52.7% | 21.1%(+31.6)#104 | 14.8%(+37.9)#546 |
| 4. | 95130 | 52.6% | 21.1%(+31.5)#106 | 14.8%(+37.8)#550 |
| 5. | 95124 | 51.4% | 21.1%(+30.3)#114 | 14.8%(+36.6)#594 |
| 6. | 95138 | 50.7% | 21.1%(+29.6)#124 | 14.8%(+35.9)#635 |
| 7. | 95113 | 50.3% | 21.1%(+29.2)#127 | 14.8%(+35.5)#649 |
| 8. | 95125 | 47.8% | 21.1%(+26.7)#138 | 14.8%(+33.0)#772 |
| 9. | 95134 | 45.4% | 21.1%(+24.3)#156 | 14.8%(+30.6)#912 |
| 10. | 95139 | 41.1% | 21.1%(+20.0)#201 | 14.8%(+26.3)#1,218 |
| 11. | 95118 | 40.9% | 21.1%(+19.8)#205 | 14.8%(+26.1)#1,233 |
| 12. | 95132 | 40.2% | 21.1%(+19.1)#214 | 14.8%(+25.4)#1,285 |
| 13. | 95131 | 39.8% | 21.1%(+18.7)#226 | 14.8%(+25.0)#1,331 |
| 14. | 95148 | 38.5% | 21.1%(+17.4)#253 | 14.8%(+23.7)#1,456 |
| 15. | 95128 | 38.4% | 21.1%(+17.3)#256 | 14.8%(+23.6)#1,470 |
| 16. | 95119 | 37.1% | 21.1%(+16.0)#275 | 14.8%(+22.3)#1,594 |
| 17. | 95123 | 34.7% | 21.1%(+13.6)#313 | 14.8%(+19.9)#1,871 |
| 18. | 95136 | 33.9% | 21.1%(+12.8)#333 | 14.8%(+19.1)#1,968 |
| 19. | 95126 | 32.7% | 21.1%(+11.6)#354 | 14.8%(+17.9)#2,136 |
| 20. | 95133 | 30.3% | 21.1%(+9.20)#399 | 14.8%(+15.5)#2,477 |
| 21. | 95117 | 30.0% | 21.1%(+8.90)#404 | 14.8%(+15.2)#2,512 |
| 22. | 95110 | 29.3% | 21.1%(+8.20)#422 | 14.8%(+14.5)#2,623 |
| 23. | 95121 | 28.9% | 21.1%(+7.80)#431 | 14.8%(+14.1)#2,686 |
| 24. | 95127 | 23.9% | 21.1%(+2.80)#551 | 14.8%(+9.10)#3,716 |
| 25. | 95112 | 21.3% | 21.1%(+0.200)#617 | 14.8%(+6.50)#4,398 |
| 26. | 95111 | 18.9% | 21.1%(-2.20)#691 | 14.8%(+4.10)#5,173 |
| 27. | 95116 | 15.4% | 21.1%(-5.70)#807 | 14.8%(+0.600)#6,728 |
| 28. | 95122 | 15.3% | 21.1%(-5.80)#810 | 14.8%(+0.500)#6,785 |
1
Common Questions
What are the Top 10 Zip Codes with the Highest Percentage of Families with Income Above $200,000 in San Jose, CA?
Top 10 Zip Codes with the Highest Percentage of Families with Income Above $200,000 in San Jose, CA are:
What zip code has the Highest Percentage of Families with Income Above $200,000 in San Jose, CA?
95120 has the Highest Percentage of Families with Income Above $200,000 in San Jose, CA with 65.8%.
What is the Percentage of Families with Income Above $200,000 in San Jose, CA?
Percentage of Families with Income Above $200,000 in San Jose is 36.8%.
What is the Percentage of Families with Income Above $200,000 in California?
Percentage of Families with Income Above $200,000 in California is 21.1%.
What is the Percentage of Families with Income Above $200,000 in the United States?
Percentage of Families with Income Above $200,000 in the United States is 14.8%.