Cities with the Highest Percentage of Families with Income Above $200,000 in Missouri
RELATED REPORTS & OPTIONS
Family Income | $200k+
Missouri
Compare Cities
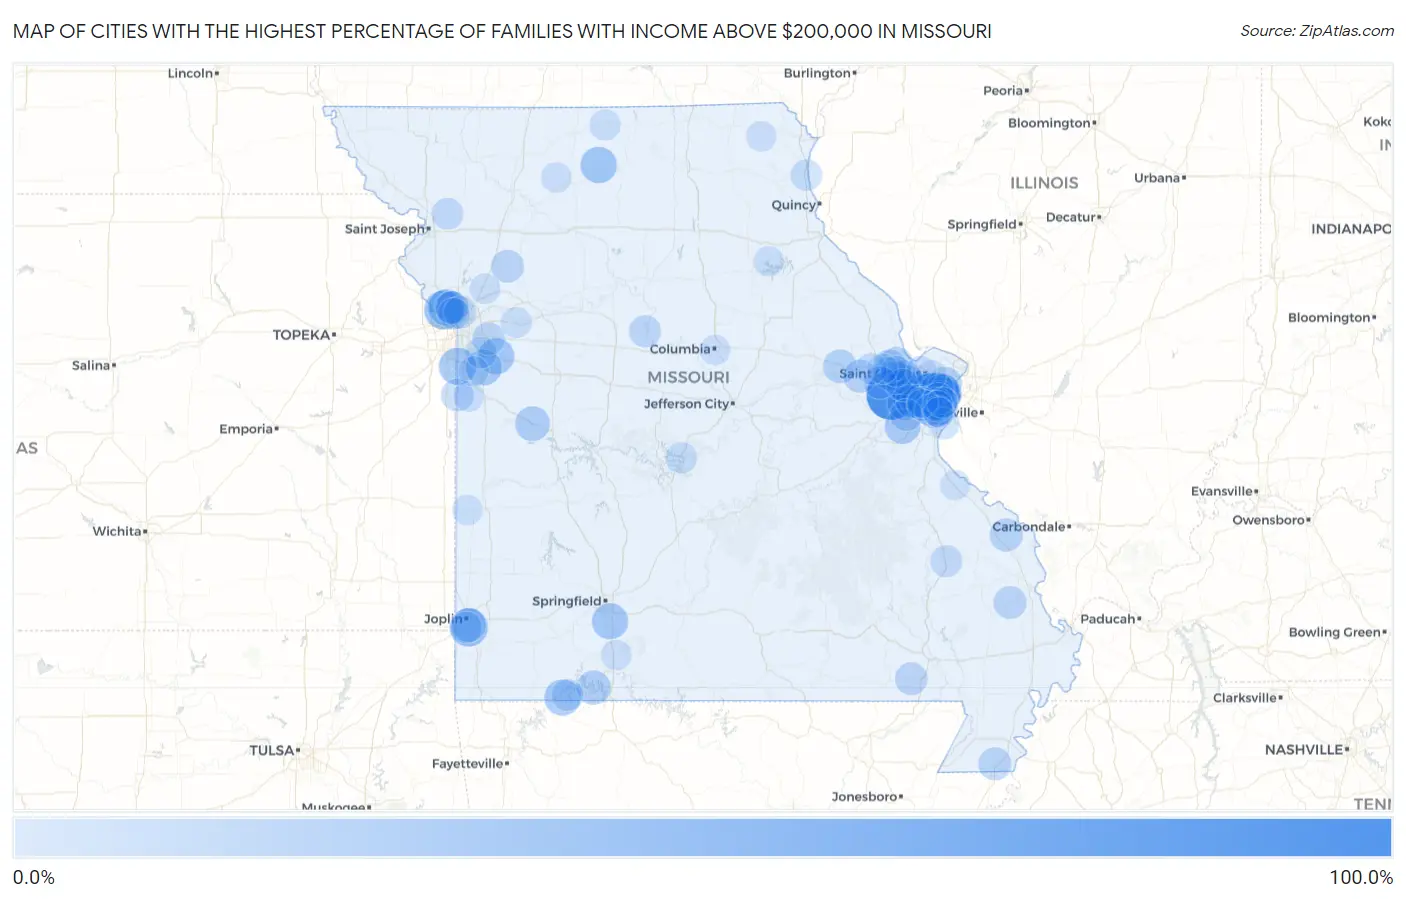
Map of Cities with the Highest Percentage of Families with Income Above $200,000 in Missouri
0.0%
100.0%
Cities with the Highest Percentage of Families with Income Above $200,000 in Missouri
| City | Families with Income > $200k | vs State | vs National | |
| 1. | Defiance | 100.0% | 10.1%(+89.9)#1 | 14.8%(+85.2)#24 |
| 2. | Country Life Acres | 75.8% | 10.1%(+65.7)#2 | 14.8%(+61.0)#110 |
| 3. | Ladue | 68.5% | 10.1%(+58.4)#3 | 14.8%(+53.7)#199 |
| 4. | Westwood | 64.6% | 10.1%(+54.5)#4 | 14.8%(+49.8)#277 |
| 5. | Town And Country | 63.5% | 10.1%(+53.4)#5 | 14.8%(+48.7)#298 |
| 6. | Frontenac | 63.5% | 10.1%(+53.4)#6 | 14.8%(+48.7)#300 |
| 7. | Huntleigh | 61.2% | 10.1%(+51.1)#7 | 14.8%(+46.4)#377 |
| 8. | Des Peres | 58.2% | 10.1%(+48.1)#8 | 14.8%(+43.4)#465 |
| 9. | Clarkson Valley | 57.5% | 10.1%(+47.4)#9 | 14.8%(+42.7)#489 |
| 10. | New Market | 52.6% | 10.1%(+42.5)#10 | 14.8%(+37.8)#687 |
| 11. | Parkville | 52.1% | 10.1%(+42.0)#11 | 14.8%(+37.3)#702 |
| 12. | Warson Woods | 52.0% | 10.1%(+41.9)#12 | 14.8%(+37.2)#706 |
| 13. | Clayton | 48.2% | 10.1%(+38.1)#13 | 14.8%(+33.4)#872 |
| 14. | Shoal Creek Estates | 47.8% | 10.1%(+37.7)#14 | 14.8%(+33.0)#894 |
| 15. | Glendale | 45.4% | 10.1%(+35.3)#15 | 14.8%(+30.6)#1,029 |
| 16. | Loch Lloyd | 42.9% | 10.1%(+32.8)#16 | 14.8%(+28.1)#1,180 |
| 17. | Chesterfield | 42.4% | 10.1%(+32.3)#17 | 14.8%(+27.6)#1,218 |
| 18. | Weldon Spring | 42.2% | 10.1%(+32.1)#18 | 14.8%(+27.4)#1,242 |
| 19. | Crystal Lake Park | 40.3% | 10.1%(+30.2)#19 | 14.8%(+25.5)#1,384 |
| 20. | Weatherby Lake | 40.2% | 10.1%(+30.1)#20 | 14.8%(+25.4)#1,393 |
| 21. | Osgood | 40.0% | 10.1%(+29.9)#21 | 14.8%(+25.2)#1,420 |
| 22. | Lake Lotawana | 38.8% | 10.1%(+28.7)#22 | 14.8%(+24.0)#1,518 |
| 23. | Golden | 38.8% | 10.1%(+28.7)#23 | 14.8%(+24.0)#1,520 |
| 24. | Fremont Hills | 38.6% | 10.1%(+28.5)#24 | 14.8%(+23.8)#1,530 |
| 25. | Richmond Heights | 38.4% | 10.1%(+28.3)#25 | 14.8%(+23.6)#1,549 |
| 26. | Creve Coeur | 38.3% | 10.1%(+28.2)#26 | 14.8%(+23.5)#1,557 |
| 27. | Lake Winnebago | 37.8% | 10.1%(+27.7)#27 | 14.8%(+23.0)#1,595 |
| 28. | Sunset Hills | 36.9% | 10.1%(+26.8)#28 | 14.8%(+22.1)#1,662 |
| 29. | Labarque Creek | 36.7% | 10.1%(+26.6)#29 | 14.8%(+21.9)#1,690 |
| 30. | Wildwood | 36.5% | 10.1%(+26.4)#30 | 14.8%(+21.7)#1,702 |
| 31. | Grantwood Village | 34.9% | 10.1%(+24.8)#31 | 14.8%(+20.1)#1,856 |
| 32. | Webster Groves | 33.7% | 10.1%(+23.6)#32 | 14.8%(+18.9)#1,967 |
| 33. | Hartwell | 33.3% | 10.1%(+23.2)#33 | 14.8%(+18.5)#2,014 |
| 34. | Coney Island | 30.8% | 10.1%(+20.7)#34 | 14.8%(+16.0)#2,284 |
| 35. | Leawood | 29.9% | 10.1%(+19.8)#35 | 14.8%(+15.1)#2,385 |
| 36. | Kirkwood | 29.7% | 10.1%(+19.6)#36 | 14.8%(+14.9)#2,401 |
| 37. | Bellerive Acres | 29.3% | 10.1%(+19.2)#37 | 14.8%(+14.5)#2,474 |
| 38. | Cottleville | 29.2% | 10.1%(+19.1)#38 | 14.8%(+14.4)#2,478 |
| 39. | Pendleton | 28.6% | 10.1%(+18.5)#39 | 14.8%(+13.8)#2,576 |
| 40. | Ballwin | 28.3% | 10.1%(+18.2)#40 | 14.8%(+13.5)#2,604 |
| 41. | Ellisville | 28.0% | 10.1%(+17.9)#41 | 14.8%(+13.2)#2,655 |
| 42. | Lake St Louis | 27.8% | 10.1%(+17.7)#42 | 14.8%(+13.0)#2,685 |
| 43. | St Paul | 27.5% | 10.1%(+17.4)#43 | 14.8%(+12.7)#2,738 |
| 44. | Brentwood | 27.1% | 10.1%(+17.0)#44 | 14.8%(+12.3)#2,797 |
| 45. | Dardenne Prairie | 26.9% | 10.1%(+16.8)#45 | 14.8%(+12.1)#2,825 |
| 46. | Innsbrook | 26.7% | 10.1%(+16.6)#46 | 14.8%(+11.9)#2,862 |
| 47. | Josephville | 26.2% | 10.1%(+16.1)#47 | 14.8%(+11.4)#2,922 |
| 48. | University City | 25.9% | 10.1%(+15.8)#48 | 14.8%(+11.1)#2,960 |
| 49. | Longtown | 25.9% | 10.1%(+15.8)#49 | 14.8%(+11.1)#2,981 |
| 50. | Holland | 25.9% | 10.1%(+15.8)#50 | 14.8%(+11.1)#2,982 |
| 51. | Delta | 25.2% | 10.1%(+15.1)#51 | 14.8%(+10.4)#3,082 |
| 52. | Elmira | 25.0% | 10.1%(+14.9)#52 | 14.8%(+10.2)#3,131 |
| 53. | Lake Waukomis | 24.9% | 10.1%(+14.8)#53 | 14.8%(+10.1)#3,144 |
| 54. | Olivette | 24.5% | 10.1%(+14.4)#54 | 14.8%(+9.70)#3,203 |
| 55. | Fairdealing | 24.5% | 10.1%(+14.4)#55 | 14.8%(+9.70)#3,210 |
| 56. | Platte Woods | 24.4% | 10.1%(+14.3)#56 | 14.8%(+9.60)#3,223 |
| 57. | Weldon Spring Heights | 24.3% | 10.1%(+14.2)#57 | 14.8%(+9.50)#3,244 |
| 58. | New Melle | 24.2% | 10.1%(+14.1)#58 | 14.8%(+9.40)#3,257 |
| 59. | West Line | 24.0% | 10.1%(+13.9)#59 | 14.8%(+9.20)#3,291 |
| 60. | Lake Tapawingo | 23.9% | 10.1%(+13.8)#60 | 14.8%(+9.10)#3,307 |
| 61. | Oakland | 23.4% | 10.1%(+13.3)#61 | 14.8%(+8.60)#3,397 |
| 62. | Oakwood | 22.2% | 10.1%(+12.1)#62 | 14.8%(+7.40)#3,631 |
| 63. | Eureka | 21.8% | 10.1%(+11.7)#63 | 14.8%(+7.00)#3,720 |
| 64. | Arrow Rock | 21.4% | 10.1%(+11.3)#64 | 14.8%(+6.60)#3,810 |
| 65. | Stanton | 21.2% | 10.1%(+11.1)#65 | 14.8%(+6.40)#3,851 |
| 66. | Cherokee Pass | 20.8% | 10.1%(+10.7)#66 | 14.8%(+6.00)#3,937 |
| 67. | Arrow Point | 20.8% | 10.1%(+10.7)#67 | 14.8%(+6.00)#3,938 |
| 68. | Cosby | 20.0% | 10.1%(+9.90)#68 | 14.8%(+5.20)#4,129 |
| 69. | Rock Hill | 19.7% | 10.1%(+9.60)#69 | 14.8%(+4.90)#4,194 |
| 70. | Lee S Summit | 19.5% | 10.1%(+9.40)#70 | 14.8%(+4.70)#4,219 |
| 71. | Redings Mill | 19.4% | 10.1%(+9.30)#71 | 14.8%(+4.60)#4,270 |
| 72. | Houston Lake | 19.2% | 10.1%(+9.10)#72 | 14.8%(+4.40)#4,312 |
| 73. | Canton | 19.1% | 10.1%(+9.00)#73 | 14.8%(+4.30)#4,329 |
| 74. | Foristell | 19.1% | 10.1%(+9.00)#74 | 14.8%(+4.30)#4,340 |
| 75. | Twin Oaks | 19.0% | 10.1%(+8.90)#75 | 14.8%(+4.20)#4,370 |
| 76. | Fenton | 18.0% | 10.1%(+7.90)#76 | 14.8%(+3.20)#4,640 |
| 77. | Oakville | 17.9% | 10.1%(+7.80)#77 | 14.8%(+3.10)#4,658 |
| 78. | Lake Ozark | 17.3% | 10.1%(+7.20)#78 | 14.8%(+2.50)#4,872 |
| 79. | Lucerne | 16.7% | 10.1%(+6.60)#79 | 14.8%(+1.90)#5,063 |
| 80. | Sappington | 16.6% | 10.1%(+6.50)#80 | 14.8%(+1.80)#5,082 |
| 81. | O Fallon | 16.3% | 10.1%(+6.20)#81 | 14.8%(+1.50)#5,158 |
| 82. | Crestwood | 16.3% | 10.1%(+6.20)#82 | 14.8%(+1.50)#5,166 |
| 83. | Kearney | 15.8% | 10.1%(+5.70)#83 | 14.8%(+1.000)#5,344 |
| 84. | Napoleon | 15.8% | 10.1%(+5.70)#84 | 14.8%(+1.000)#5,371 |
| 85. | Manchester | 15.4% | 10.1%(+5.30)#85 | 14.8%(+0.600)#5,472 |
| 86. | Freeman | 14.9% | 10.1%(+4.80)#86 | 14.8%(+0.100)#5,688 |
| 87. | Leisure Lake | 14.7% | 10.1%(+4.60)#87 | 14.8%(-0.100)#5,764 |
| 88. | Columbia | 14.4% | 10.1%(+4.30)#88 | 14.8%(-0.400)#5,853 |
| 89. | Shrewsbury | 14.4% | 10.1%(+4.30)#89 | 14.8%(-0.400)#5,871 |
| 90. | Saddlebrooke | 14.4% | 10.1%(+4.30)#90 | 14.8%(-0.400)#5,888 |
| 91. | St Charles | 14.3% | 10.1%(+4.20)#91 | 14.8%(-0.500)#5,892 |
| 92. | Wyaconda | 14.3% | 10.1%(+4.20)#92 | 14.8%(-0.500)#5,929 |
| 93. | Deerfield | 14.3% | 10.1%(+4.20)#93 | 14.8%(-0.500)#5,944 |
| 94. | Stoutsville | 14.3% | 10.1%(+4.20)#94 | 14.8%(-0.500)#5,946 |
| 95. | Wentzville | 14.1% | 10.1%(+4.00)#95 | 14.8%(-0.700)#5,987 |
| 96. | Raintree Plantation | 14.1% | 10.1%(+4.00)#96 | 14.8%(-0.700)#6,002 |
| 97. | Concord | 14.0% | 10.1%(+3.90)#97 | 14.8%(-0.800)#6,029 |
| 98. | Bloomsdale | 13.8% | 10.1%(+3.70)#98 | 14.8%(-1.00)#6,160 |
| 99. | Raymore | 13.4% | 10.1%(+3.30)#99 | 14.8%(-1.40)#6,311 |
| 100. | Bridgeton | 13.2% | 10.1%(+3.10)#100 | 14.8%(-1.60)#6,412 |
Common Questions
What are the Top 10 Cities with the Highest Percentage of Families with Income Above $200,000 in Missouri?
Top 10 Cities with the Highest Percentage of Families with Income Above $200,000 in Missouri are:
#1
100.0%
#2
75.8%
#3
68.5%
#4
64.6%
#5
63.5%
#6
63.5%
#7
61.2%
#8
58.2%
#9
57.5%
#10
52.1%
What city has the Highest Percentage of Families with Income Above $200,000 in Missouri?
Defiance has the Highest Percentage of Families with Income Above $200,000 in Missouri with 100.0%.
What is the Percentage of Families with Income Above $200,000 in the State of Missouri?
Percentage of Families with Income Above $200,000 in Missouri is 10.1%.
What is the Percentage of Families with Income Above $200,000 in the United States?
Percentage of Families with Income Above $200,000 in the United States is 14.8%.