Cities with the Highest Percentage of Families with Income Above $200,000 in Mississippi
RELATED REPORTS & OPTIONS
Family Income | $200k+
Mississippi
Compare Cities
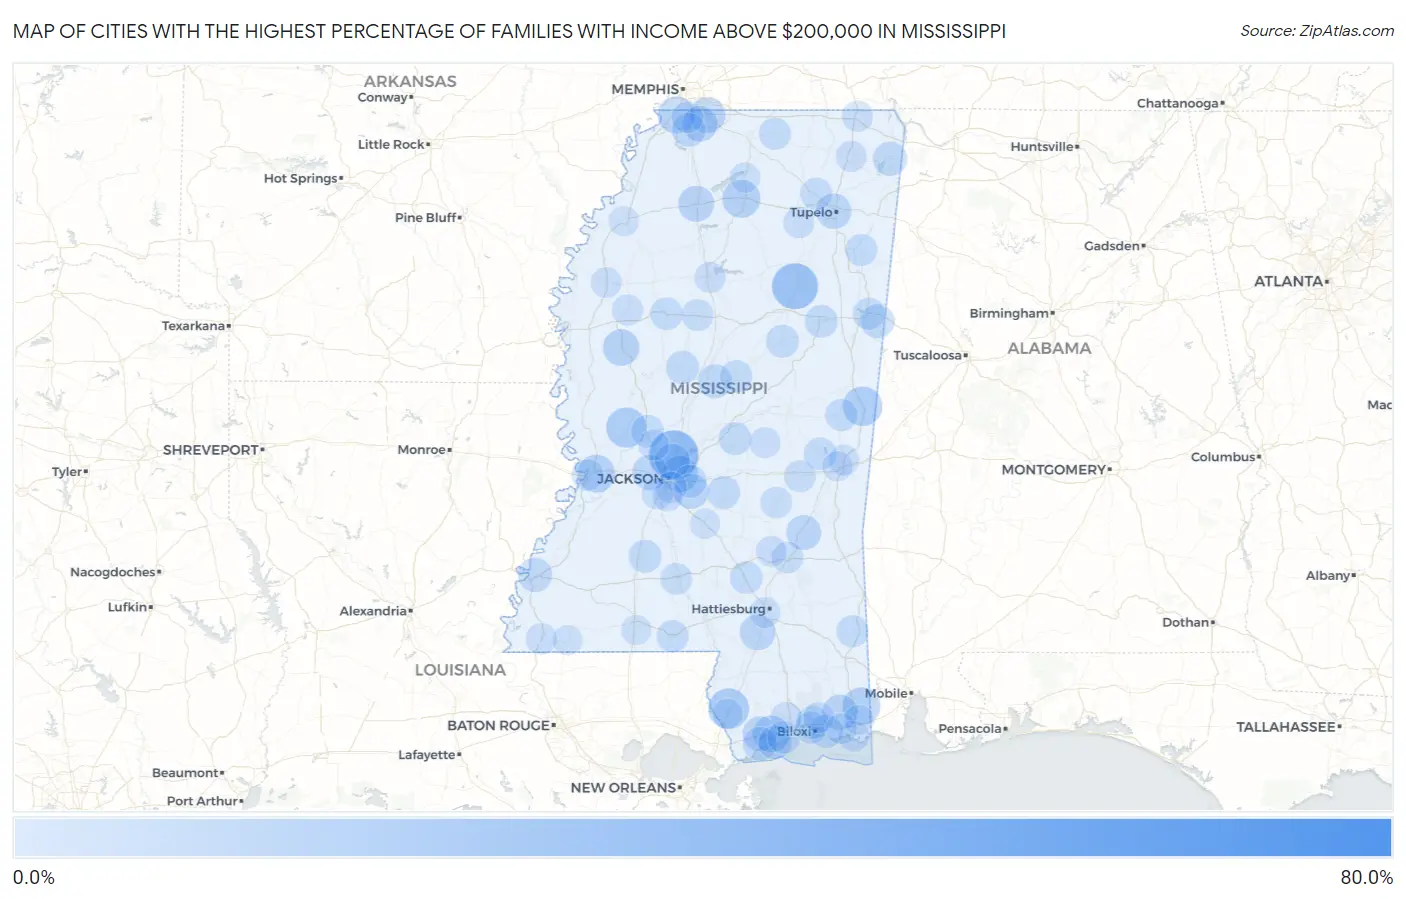
Map of Cities with the Highest Percentage of Families with Income Above $200,000 in Mississippi
0.0%
80.0%
Cities with the Highest Percentage of Families with Income Above $200,000 in Mississippi
| City | Families with Income > $200k | vs State | vs National | |
| 1. | Bogue Chitto Cdp Kemper And Neshoba Counties | 66.7% | 6.3%(+60.4)#1 | 14.8%(+51.9)#230 |
| 2. | Independence | 47.3% | 6.3%(+41.0)#2 | 14.8%(+32.5)#920 |
| 3. | Elizabeth | 46.4% | 6.3%(+40.1)#3 | 14.8%(+31.6)#978 |
| 4. | Red Banks | 45.0% | 6.3%(+38.7)#4 | 14.8%(+30.2)#1,056 |
| 5. | Bolivar | 43.5% | 6.3%(+37.2)#5 | 14.8%(+28.7)#1,145 |
| 6. | Victoria | 42.8% | 6.3%(+36.5)#6 | 14.8%(+28.0)#1,191 |
| 7. | Bond | 36.0% | 6.3%(+29.7)#7 | 14.8%(+21.2)#1,746 |
| 8. | Madison | 32.0% | 6.3%(+25.7)#8 | 14.8%(+17.2)#2,150 |
| 9. | Mantee | 27.1% | 6.3%(+20.8)#9 | 14.8%(+12.3)#2,806 |
| 10. | Oak Grove | 25.9% | 6.3%(+19.6)#10 | 14.8%(+11.1)#2,975 |
| 11. | Hide A Way Lake | 19.5% | 6.3%(+13.2)#11 | 14.8%(+4.70)#4,233 |
| 12. | Satartia | 18.8% | 6.3%(+12.5)#12 | 14.8%(+4.00)#4,429 |
| 13. | Scooba | 17.8% | 6.3%(+11.5)#13 | 14.8%(+3.00)#4,708 |
| 14. | Oxford | 15.8% | 6.3%(+9.50)#14 | 14.8%(+1.000)#5,340 |
| 15. | Big Point | 15.7% | 6.3%(+9.40)#15 | 14.8%(+0.900)#5,400 |
| 16. | Beechwood | 15.4% | 6.3%(+9.10)#16 | 14.8%(+0.600)#5,489 |
| 17. | Glen Allan | 15.0% | 6.3%(+8.70)#17 | 14.8%(+0.200)#5,660 |
| 18. | Lynchburg | 14.5% | 6.3%(+8.20)#18 | 14.8%(-0.300)#5,833 |
| 19. | Delisle | 13.8% | 6.3%(+7.50)#19 | 14.8%(-1.00)#6,151 |
| 20. | Isola | 13.8% | 6.3%(+7.50)#20 | 14.8%(-1.00)#6,162 |
| 21. | Flowood | 13.6% | 6.3%(+7.30)#21 | 14.8%(-1.20)#6,235 |
| 22. | Batesville | 12.9% | 6.3%(+6.60)#22 | 14.8%(-1.90)#6,558 |
| 23. | Olive Branch | 12.8% | 6.3%(+6.50)#23 | 14.8%(-2.00)#6,601 |
| 24. | Vancleave | 12.7% | 6.3%(+6.40)#24 | 14.8%(-2.10)#6,657 |
| 25. | Purvis | 12.3% | 6.3%(+6.00)#25 | 14.8%(-2.50)#6,860 |
| 26. | Tupelo | 12.2% | 6.3%(+5.90)#26 | 14.8%(-2.60)#6,886 |
| 27. | Bridgetown | 12.2% | 6.3%(+5.90)#27 | 14.8%(-2.60)#6,903 |
| 28. | Clinton | 12.1% | 6.3%(+5.80)#28 | 14.8%(-2.70)#6,941 |
| 29. | Ridgeland | 12.1% | 6.3%(+5.80)#29 | 14.8%(-2.70)#6,944 |
| 30. | Robinhood | 11.7% | 6.3%(+5.40)#30 | 14.8%(-3.10)#7,177 |
| 31. | Diamondhead | 11.4% | 6.3%(+5.10)#31 | 14.8%(-3.40)#7,353 |
| 32. | Heidelberg | 11.4% | 6.3%(+5.10)#32 | 14.8%(-3.40)#7,388 |
| 33. | Bovina | 11.4% | 6.3%(+5.10)#33 | 14.8%(-3.40)#7,397 |
| 34. | Morgantown | 10.6% | 6.3%(+4.30)#34 | 14.8%(-4.20)#7,868 |
| 35. | Tishomingo | 10.4% | 6.3%(+4.10)#35 | 14.8%(-4.40)#8,003 |
| 36. | Sallis | 10.3% | 6.3%(+4.00)#36 | 14.8%(-4.50)#8,078 |
| 37. | Bay St Louis | 10.2% | 6.3%(+3.90)#37 | 14.8%(-4.60)#8,100 |
| 38. | New Hope | 10.0% | 6.3%(+3.70)#38 | 14.8%(-4.80)#8,261 |
| 39. | Hernando | 9.7% | 6.3%(+3.40)#39 | 14.8%(-5.10)#8,476 |
| 40. | Pass Christian | 9.7% | 6.3%(+3.40)#40 | 14.8%(-5.10)#8,488 |
| 41. | Gluckstadt | 9.4% | 6.3%(+3.10)#41 | 14.8%(-5.40)#8,699 |
| 42. | Ocean Springs | 9.2% | 6.3%(+2.90)#42 | 14.8%(-5.60)#8,839 |
| 43. | Lexington | 9.2% | 6.3%(+2.90)#43 | 14.8%(-5.60)#8,877 |
| 44. | Beauregard | 8.9% | 6.3%(+2.60)#44 | 14.8%(-5.90)#9,108 |
| 45. | Brandon | 8.8% | 6.3%(+2.50)#45 | 14.8%(-6.00)#9,132 |
| 46. | Polkville | 8.8% | 6.3%(+2.50)#46 | 14.8%(-6.00)#9,189 |
| 47. | Starkville | 8.7% | 6.3%(+2.40)#47 | 14.8%(-6.10)#9,222 |
| 48. | D Iberville | 8.7% | 6.3%(+2.40)#48 | 14.8%(-6.10)#9,230 |
| 49. | Ackerman | 8.7% | 6.3%(+2.40)#49 | 14.8%(-6.10)#9,263 |
| 50. | Lena | 8.7% | 6.3%(+2.40)#50 | 14.8%(-6.10)#9,302 |
| 51. | Agricola | 8.6% | 6.3%(+2.30)#51 | 14.8%(-6.20)#9,397 |
| 52. | Seminary | 8.6% | 6.3%(+2.30)#52 | 14.8%(-6.20)#9,400 |
| 53. | Bentonia | 8.6% | 6.3%(+2.30)#53 | 14.8%(-6.20)#9,401 |
| 54. | Long Beach | 8.4% | 6.3%(+2.10)#54 | 14.8%(-6.40)#9,512 |
| 55. | Collinsville | 8.4% | 6.3%(+2.10)#55 | 14.8%(-6.40)#9,539 |
| 56. | Greenwood | 8.3% | 6.3%(+2.00)#56 | 14.8%(-6.50)#9,584 |
| 57. | Kosciusko | 8.1% | 6.3%(+1.80)#57 | 14.8%(-6.70)#9,796 |
| 58. | Biloxi | 7.9% | 6.3%(+1.60)#58 | 14.8%(-6.90)#9,970 |
| 59. | Blue Springs | 7.9% | 6.3%(+1.60)#59 | 14.8%(-6.90)#10,061 |
| 60. | De Kalb | 7.8% | 6.3%(+1.50)#60 | 14.8%(-7.00)#10,135 |
| 61. | Leakesville | 7.7% | 6.3%(+1.40)#61 | 14.8%(-7.10)#10,187 |
| 62. | Tylertown | 7.7% | 6.3%(+1.40)#62 | 14.8%(-7.10)#10,203 |
| 63. | Snow Lake Shores | 7.7% | 6.3%(+1.40)#63 | 14.8%(-7.10)#10,229 |
| 64. | Columbus | 7.6% | 6.3%(+1.30)#64 | 14.8%(-7.20)#10,263 |
| 65. | Amory | 7.6% | 6.3%(+1.30)#65 | 14.8%(-7.20)#10,281 |
| 66. | Hickory | 7.5% | 6.3%(+1.20)#66 | 14.8%(-7.30)#10,430 |
| 67. | Carrollton | 7.4% | 6.3%(+1.10)#67 | 14.8%(-7.40)#10,542 |
| 68. | Monticello | 7.2% | 6.3%(+0.900)#68 | 14.8%(-7.60)#10,740 |
| 69. | Laurel | 7.1% | 6.3%(+0.800)#69 | 14.8%(-7.70)#10,784 |
| 70. | Vicksburg | 6.9% | 6.3%(+0.600)#70 | 14.8%(-7.90)#11,014 |
| 71. | Richland | 6.9% | 6.3%(+0.600)#71 | 14.8%(-7.90)#11,025 |
| 72. | Montrose | 6.9% | 6.3%(+0.600)#72 | 14.8%(-7.90)#11,096 |
| 73. | Southaven | 6.6% | 6.3%(+0.300)#73 | 14.8%(-8.20)#11,362 |
| 74. | Lyman | 6.5% | 6.3%(+0.200)#74 | 14.8%(-8.30)#11,525 |
| 75. | Woodville | 6.5% | 6.3%(+0.200)#75 | 14.8%(-8.30)#11,532 |
| 76. | Corinth | 6.4% | 6.3%(+0.100)#76 | 14.8%(-8.40)#11,613 |
| 77. | Byram | 6.4% | 6.3%(+0.100)#77 | 14.8%(-8.40)#11,616 |
| 78. | Booneville | 6.4% | 6.3%(+0.100)#78 | 14.8%(-8.40)#11,625 |
| 79. | Sunflower | 6.4% | 6.3%(+0.100)#79 | 14.8%(-8.40)#11,659 |
| 80. | Algoma | 6.4% | 6.3%(+0.100)#80 | 14.8%(-8.40)#11,665 |
| 81. | Grenada | 6.2% | 6.3%(-0.100)#81 | 14.8%(-8.60)#11,856 |
| 82. | Flora | 6.1% | 6.3%(-0.200)#82 | 14.8%(-8.70)#11,999 |
| 83. | Eudora | 6.1% | 6.3%(-0.200)#83 | 14.8%(-8.70)#12,047 |
| 84. | Sebastopol | 6.0% | 6.3%(-0.300)#84 | 14.8%(-8.80)#12,191 |
| 85. | Hattiesburg | 5.9% | 6.3%(-0.400)#85 | 14.8%(-8.90)#12,204 |
| 86. | Pascagoula | 5.9% | 6.3%(-0.400)#86 | 14.8%(-8.90)#12,210 |
| 87. | Latimer | 5.9% | 6.3%(-0.400)#87 | 14.8%(-8.90)#12,235 |
| 88. | Marion | 5.9% | 6.3%(-0.400)#88 | 14.8%(-8.90)#12,264 |
| 89. | Gautier | 5.8% | 6.3%(-0.500)#89 | 14.8%(-9.00)#12,352 |
| 90. | Cleveland | 5.7% | 6.3%(-0.600)#90 | 14.8%(-9.10)#12,492 |
| 91. | Soso | 5.6% | 6.3%(-0.700)#91 | 14.8%(-9.20)#12,711 |
| 92. | Mendenhall | 5.3% | 6.3%(-1.00)#92 | 14.8%(-9.50)#13,032 |
| 93. | Cleary | 5.3% | 6.3%(-1.00)#93 | 14.8%(-9.50)#13,046 |
| 94. | Meridian | 5.1% | 6.3%(-1.20)#94 | 14.8%(-9.70)#13,256 |
| 95. | Helena | 5.1% | 6.3%(-1.20)#95 | 14.8%(-9.70)#13,358 |
| 96. | Abbeville | 5.1% | 6.3%(-1.20)#96 | 14.8%(-9.70)#13,371 |
| 97. | Clarksdale | 5.0% | 6.3%(-1.30)#97 | 14.8%(-9.80)#13,408 |
| 98. | Picayune | 5.0% | 6.3%(-1.30)#98 | 14.8%(-9.80)#13,410 |
| 99. | Magnolia | 5.0% | 6.3%(-1.30)#99 | 14.8%(-9.80)#13,448 |
| 100. | Centreville | 5.0% | 6.3%(-1.30)#100 | 14.8%(-9.80)#13,457 |
Common Questions
What are the Top 10 Cities with the Highest Percentage of Families with Income Above $200,000 in Mississippi?
Top 10 Cities with the Highest Percentage of Families with Income Above $200,000 in Mississippi are:
What city has the Highest Percentage of Families with Income Above $200,000 in Mississippi?
Madison has the Highest Percentage of Families with Income Above $200,000 in Mississippi with 32.0%.
What is the Percentage of Families with Income Above $200,000 in the State of Mississippi?
Percentage of Families with Income Above $200,000 in Mississippi is 6.3%.
What is the Percentage of Families with Income Above $200,000 in the United States?
Percentage of Families with Income Above $200,000 in the United States is 14.8%.