Cities with the Highest Percentage of Families with Income Above $200,000 in Wyoming
RELATED REPORTS & OPTIONS
Family Income | $200k+
Wyoming
Compare Cities
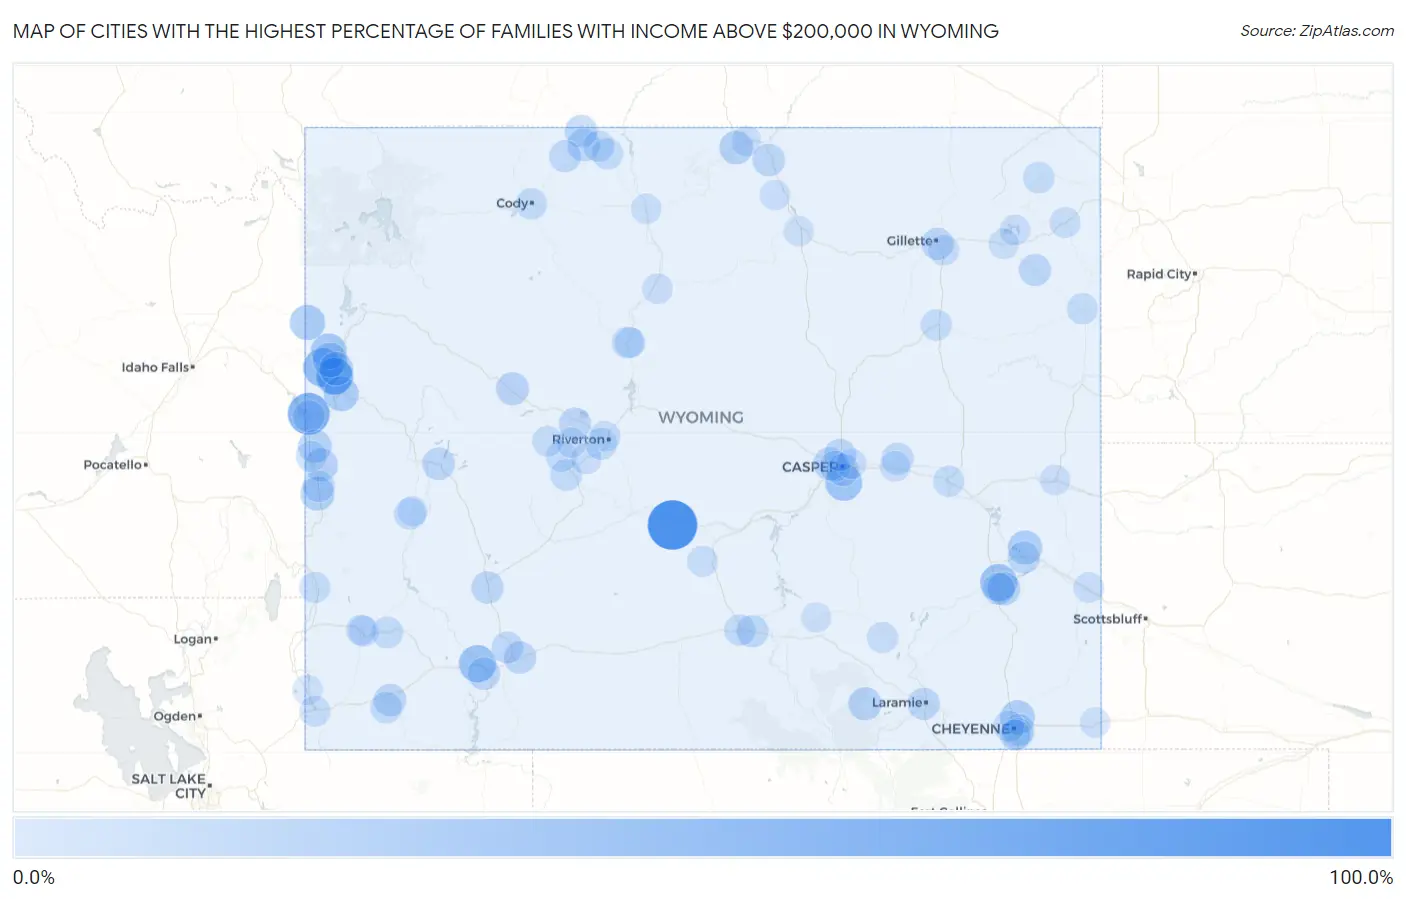
Map of Cities with the Highest Percentage of Families with Income Above $200,000 in Wyoming
0.0%
100.0%
Cities with the Highest Percentage of Families with Income Above $200,000 in Wyoming
| City | Families with Income > $200k | vs State | vs National | |
| 1. | Jeffrey City | 100.0% | 9.5%(+90.5)#1 | 14.8%(+85.2)#36 |
| 2. | Alpine Northeast | 59.0% | 9.5%(+49.5)#2 | 14.8%(+44.2)#435 |
| 3. | Wilson | 42.3% | 9.5%(+32.8)#3 | 14.8%(+27.5)#1,233 |
| 4. | James Town | 35.6% | 9.5%(+26.1)#4 | 14.8%(+20.8)#1,785 |
| 5. | Lakeview North | 35.3% | 9.5%(+25.8)#5 | 14.8%(+20.5)#1,815 |
| 6. | South Park | 34.4% | 9.5%(+24.9)#6 | 14.8%(+19.6)#1,907 |
| 7. | Casper Mountain | 33.5% | 9.5%(+24.0)#7 | 14.8%(+18.7)#1,990 |
| 8. | Rafter J Ranch | 31.2% | 9.5%(+21.7)#8 | 14.8%(+16.4)#2,238 |
| 9. | Teton Village | 26.8% | 9.5%(+17.3)#9 | 14.8%(+12.0)#2,845 |
| 10. | Alta | 25.2% | 9.5%(+15.7)#10 | 14.8%(+10.4)#3,081 |
| 11. | Hoback | 23.3% | 9.5%(+13.8)#11 | 14.8%(+8.50)#3,412 |
| 12. | Moose Wilson Road | 22.4% | 9.5%(+12.9)#12 | 14.8%(+7.60)#3,596 |
| 13. | Ranchettes | 21.6% | 9.5%(+12.1)#13 | 14.8%(+6.80)#3,756 |
| 14. | Hartville | 20.0% | 9.5%(+10.5)#14 | 14.8%(+5.20)#4,140 |
| 15. | Osmond | 18.8% | 9.5%(+9.30)#15 | 14.8%(+4.00)#4,418 |
| 16. | Dayton | 17.7% | 9.5%(+8.20)#16 | 14.8%(+2.90)#4,731 |
| 17. | Jackson | 17.5% | 9.5%(+8.00)#17 | 14.8%(+2.70)#4,789 |
| 18. | Turnerville | 16.1% | 9.5%(+6.60)#18 | 14.8%(+1.30)#5,251 |
| 19. | Star Valley Ranch | 15.5% | 9.5%(+6.00)#19 | 14.8%(+0.700)#5,456 |
| 20. | Centennial | 15.3% | 9.5%(+5.80)#20 | 14.8%(+0.500)#5,538 |
| 21. | Chugcreek | 15.0% | 9.5%(+5.50)#21 | 14.8%(+0.200)#5,663 |
| 22. | Vista West | 14.4% | 9.5%(+4.90)#22 | 14.8%(-0.400)#5,882 |
| 23. | Crowheart | 14.3% | 9.5%(+4.80)#23 | 14.8%(-0.500)#5,928 |
| 24. | Deaver | 12.5% | 9.5%(+3.00)#24 | 14.8%(-2.30)#6,779 |
| 25. | Frannie | 12.3% | 9.5%(+2.80)#25 | 14.8%(-2.50)#6,878 |
| 26. | Green River | 11.8% | 9.5%(+2.30)#26 | 14.8%(-3.00)#7,103 |
| 27. | Sheridan | 11.7% | 9.5%(+2.20)#27 | 14.8%(-3.10)#7,152 |
| 28. | Pinedale | 11.6% | 9.5%(+2.10)#28 | 14.8%(-3.20)#7,229 |
| 29. | Powder Horn | 11.5% | 9.5%(+2.00)#29 | 14.8%(-3.30)#7,300 |
| 30. | Casper | 11.1% | 9.5%(+1.60)#30 | 14.8%(-3.70)#7,517 |
| 31. | Lyman | 11.1% | 9.5%(+1.60)#31 | 14.8%(-3.70)#7,560 |
| 32. | Rock Springs | 11.0% | 9.5%(+1.50)#32 | 14.8%(-3.80)#7,613 |
| 33. | Eden | 11.0% | 9.5%(+1.50)#33 | 14.8%(-3.80)#7,655 |
| 34. | Bar Nunn | 10.4% | 9.5%(+0.900)#34 | 14.8%(-4.40)#7,977 |
| 35. | Johnstown | 10.4% | 9.5%(+0.900)#35 | 14.8%(-4.40)#8,011 |
| 36. | Wheatland | 10.1% | 9.5%(+0.600)#36 | 14.8%(-4.70)#8,179 |
| 37. | Upton | 10.1% | 9.5%(+0.600)#37 | 14.8%(-4.70)#8,205 |
| 38. | Laramie | 10.0% | 9.5%(+0.500)#38 | 14.8%(-4.80)#8,233 |
| 39. | Guernsey | 9.9% | 9.5%(+0.400)#39 | 14.8%(-4.90)#8,375 |
| 40. | Gillette | 9.7% | 9.5%(+0.200)#40 | 14.8%(-5.10)#8,471 |
| 41. | Rolling Hills | 9.5% | 9.5%(=0.000)#41 | 14.8%(-5.30)#8,648 |
| 42. | Sinclair | 9.4% | 9.5%(-0.100)#42 | 14.8%(-5.40)#8,731 |
| 43. | Powell | 9.0% | 9.5%(-0.500)#43 | 14.8%(-5.80)#9,013 |
| 44. | Alpine | 8.8% | 9.5%(-0.700)#44 | 14.8%(-6.00)#9,181 |
| 45. | North Rock Springs | 8.7% | 9.5%(-0.800)#45 | 14.8%(-6.10)#9,254 |
| 46. | Afton | 8.2% | 9.5%(-1.30)#46 | 14.8%(-6.60)#9,724 |
| 47. | Cheyenne | 8.1% | 9.5%(-1.40)#47 | 14.8%(-6.70)#9,773 |
| 48. | Arapahoe | 7.6% | 9.5%(-1.90)#48 | 14.8%(-7.20)#10,306 |
| 49. | Mountain View | 7.5% | 9.5%(-2.00)#49 | 14.8%(-7.30)#10,413 |
| 50. | Fox Farm College | 7.4% | 9.5%(-2.10)#50 | 14.8%(-7.40)#10,488 |
| 51. | Thermopolis | 7.3% | 9.5%(-2.20)#51 | 14.8%(-7.50)#10,615 |
| 52. | Big Piney | 7.1% | 9.5%(-2.40)#52 | 14.8%(-7.70)#10,867 |
| 53. | Lander | 6.8% | 9.5%(-2.70)#53 | 14.8%(-8.00)#11,137 |
| 54. | Opal | 6.7% | 9.5%(-2.80)#54 | 14.8%(-8.10)#11,350 |
| 55. | Cody | 6.3% | 9.5%(-3.20)#55 | 14.8%(-8.50)#11,714 |
| 56. | Rawlins | 6.3% | 9.5%(-3.20)#56 | 14.8%(-8.50)#11,717 |
| 57. | Lovell | 6.3% | 9.5%(-3.20)#57 | 14.8%(-8.50)#11,748 |
| 58. | Hulett | 6.2% | 9.5%(-3.30)#58 | 14.8%(-8.60)#11,942 |
| 59. | Douglas | 5.7% | 9.5%(-3.80)#59 | 14.8%(-9.10)#12,504 |
| 60. | Wright | 5.5% | 9.5%(-4.00)#60 | 14.8%(-9.30)#12,813 |
| 61. | Cowley | 5.5% | 9.5%(-4.00)#61 | 14.8%(-9.30)#12,834 |
| 62. | Boulder Flats | 5.1% | 9.5%(-4.40)#62 | 14.8%(-9.70)#13,364 |
| 63. | Newcastle | 5.0% | 9.5%(-4.50)#63 | 14.8%(-9.80)#13,446 |
| 64. | Cokeville | 5.0% | 9.5%(-4.50)#64 | 14.8%(-9.80)#13,518 |
| 65. | Warren Afb | 4.8% | 9.5%(-4.70)#65 | 14.8%(-10.0)#13,754 |
| 66. | Thayne | 4.7% | 9.5%(-4.80)#66 | 14.8%(-10.1)#13,972 |
| 67. | Rock River | 4.4% | 9.5%(-5.10)#67 | 14.8%(-10.4)#14,441 |
| 68. | Mills | 4.0% | 9.5%(-5.50)#68 | 14.8%(-10.8)#14,998 |
| 69. | Sleepy Hollow | 4.0% | 9.5%(-5.50)#69 | 14.8%(-10.8)#15,056 |
| 70. | Fort Washakie | 3.7% | 9.5%(-5.80)#70 | 14.8%(-11.1)#15,571 |
| 71. | Bairoil | 3.6% | 9.5%(-5.90)#71 | 14.8%(-11.2)#15,805 |
| 72. | South Greeley | 3.5% | 9.5%(-6.00)#72 | 14.8%(-11.3)#15,871 |
| 73. | Diamondville | 3.4% | 9.5%(-6.10)#73 | 14.8%(-11.4)#16,122 |
| 74. | Sundance | 3.1% | 9.5%(-6.40)#74 | 14.8%(-11.7)#16,629 |
| 75. | Evanston | 3.0% | 9.5%(-6.50)#75 | 14.8%(-11.8)#16,709 |
| 76. | Riverton | 3.0% | 9.5%(-6.50)#76 | 14.8%(-11.8)#16,711 |
| 77. | East Thermopolis | 2.9% | 9.5%(-6.60)#77 | 14.8%(-11.9)#17,029 |
| 78. | Torrington | 2.7% | 9.5%(-6.80)#78 | 14.8%(-12.1)#17,268 |
| 79. | Worland | 2.5% | 9.5%(-7.00)#79 | 14.8%(-12.3)#17,664 |
| 80. | Hudson | 2.5% | 9.5%(-7.00)#80 | 14.8%(-12.3)#17,771 |
| 81. | Kemmerer | 2.2% | 9.5%(-7.30)#81 | 14.8%(-12.6)#18,215 |
| 82. | Pine Haven | 2.2% | 9.5%(-7.30)#82 | 14.8%(-12.6)#18,301 |
| 83. | Evansville | 2.1% | 9.5%(-7.40)#83 | 14.8%(-12.7)#18,399 |
| 84. | Glenrock | 1.8% | 9.5%(-7.70)#84 | 14.8%(-13.0)#18,989 |
| 85. | Greybull | 1.3% | 9.5%(-8.20)#85 | 14.8%(-13.5)#19,982 |
| 86. | Lusk | 1.3% | 9.5%(-8.20)#86 | 14.8%(-13.5)#20,001 |
| 87. | Story | 1.3% | 9.5%(-8.20)#87 | 14.8%(-13.5)#20,026 |
| 88. | Moorcroft | 1.3% | 9.5%(-8.20)#88 | 14.8%(-13.5)#20,046 |
| 89. | Ethete | 1.2% | 9.5%(-8.30)#89 | 14.8%(-13.6)#20,210 |
| 90. | Pine Bluffs | 1.2% | 9.5%(-8.30)#90 | 14.8%(-13.6)#20,216 |
| 91. | Marbleton | 1.1% | 9.5%(-8.40)#91 | 14.8%(-13.7)#20,393 |
| 92. | Buffalo | 0.90% | 9.5%(-8.60)#92 | 14.8%(-13.9)#20,676 |
| 93. | Ranchester | 0.80% | 9.5%(-8.70)#93 | 14.8%(-14.0)#20,903 |
| 94. | Bear River | 0.40% | 9.5%(-9.10)#94 | 14.8%(-14.4)#21,326 |
| 95. | Hanna | 0.40% | 9.5%(-9.10)#95 | 14.8%(-14.4)#21,329 |
1
2Common Questions
What are the Top 10 Cities with the Highest Percentage of Families with Income Above $200,000 in Wyoming?
Top 10 Cities with the Highest Percentage of Families with Income Above $200,000 in Wyoming are:
#1
100.0%
#2
59.0%
#3
42.3%
#4
35.6%
#5
35.3%
#6
34.4%
#7
33.5%
#8
31.2%
#9
26.8%
#10
25.2%
What city has the Highest Percentage of Families with Income Above $200,000 in Wyoming?
Jeffrey City has the Highest Percentage of Families with Income Above $200,000 in Wyoming with 100.0%.
What is the Percentage of Families with Income Above $200,000 in the State of Wyoming?
Percentage of Families with Income Above $200,000 in Wyoming is 9.5%.
What is the Percentage of Families with Income Above $200,000 in the United States?
Percentage of Families with Income Above $200,000 in the United States is 14.8%.