Cities with the Highest Percentage of Families with Income Above $200,000 in Pennsylvania
RELATED REPORTS & OPTIONS
Family Income | $200k+
Pennsylvania
Compare Cities
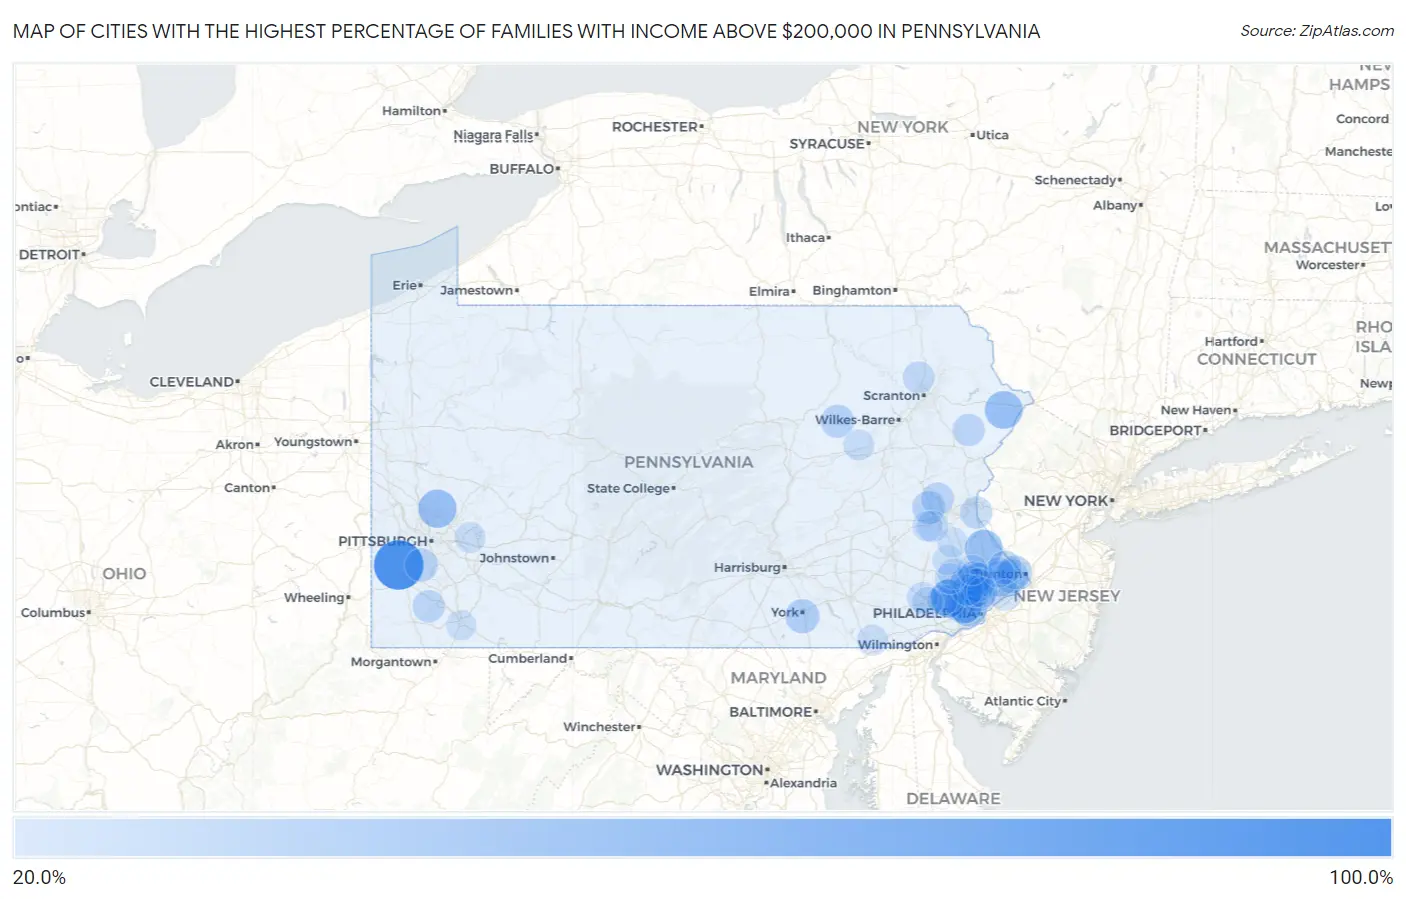
Map of Cities with the Highest Percentage of Families with Income Above $200,000 in Pennsylvania
0.0%
100.0%
Cities with the Highest Percentage of Families with Income Above $200,000 in Pennsylvania
| City | Families with Income > $200k | vs State | vs National | |
| 1. | Gray | 100.0% | 14.0%(+86.0)#1 | 14.8%(+85.2)#15 |
| 2. | Westland | 100.0% | 14.0%(+86.0)#2 | 14.8%(+85.2)#32 |
| 3. | Seven Springs Borough | 100.0% | 14.0%(+86.0)#3 | 14.8%(+85.2)#35 |
| 4. | Villanova | 73.5% | 14.0%(+59.5)#4 | 14.8%(+58.7)#131 |
| 5. | Merion Station | 70.4% | 14.0%(+56.4)#5 | 14.8%(+55.6)#176 |
| 6. | Ben Avon Heights Borough | 67.9% | 14.0%(+53.9)#6 | 14.8%(+53.1)#215 |
| 7. | Rose Valley Borough | 61.4% | 14.0%(+47.4)#7 | 14.8%(+46.6)#365 |
| 8. | Fox Chapel Borough | 61.3% | 14.0%(+47.3)#8 | 14.8%(+46.5)#370 |
| 9. | Edgeworth Borough | 60.5% | 14.0%(+46.5)#9 | 14.8%(+45.7)#392 |
| 10. | Dilworthtown | 60.5% | 14.0%(+46.5)#10 | 14.8%(+45.7)#393 |
| 11. | Devon | 60.2% | 14.0%(+46.2)#11 | 14.8%(+45.4)#403 |
| 12. | Blue Bell | 58.5% | 14.0%(+44.5)#12 | 14.8%(+43.7)#450 |
| 13. | Bakerstown | 58.5% | 14.0%(+44.5)#13 | 14.8%(+43.7)#451 |
| 14. | Sewickley Heights Borough | 57.0% | 14.0%(+43.0)#14 | 14.8%(+42.2)#511 |
| 15. | New Hope Borough | 56.9% | 14.0%(+42.9)#15 | 14.8%(+42.1)#513 |
| 16. | Sunrise Lake | 56.9% | 14.0%(+42.9)#16 | 14.8%(+42.1)#514 |
| 17. | Plumsteadville | 56.7% | 14.0%(+42.7)#17 | 14.8%(+41.9)#519 |
| 18. | Thornburg Borough | 56.6% | 14.0%(+42.6)#18 | 14.8%(+41.8)#526 |
| 19. | St. Davids | 56.0% | 14.0%(+42.0)#19 | 14.8%(+41.2)#548 |
| 20. | Haverford College | 55.1% | 14.0%(+41.1)#20 | 14.8%(+40.3)#575 |
| 21. | Swarthmore Borough | 53.3% | 14.0%(+39.3)#21 | 14.8%(+38.5)#650 |
| 22. | Bear Creek Village Borough | 53.0% | 14.0%(+39.0)#22 | 14.8%(+38.2)#665 |
| 23. | Narberth Borough | 52.5% | 14.0%(+38.5)#23 | 14.8%(+37.7)#688 |
| 24. | Sewickley Hills Borough | 50.5% | 14.0%(+36.5)#24 | 14.8%(+35.7)#764 |
| 25. | Penn Wynne | 49.8% | 14.0%(+35.8)#25 | 14.8%(+35.0)#803 |
| 26. | Rosslyn Farms Borough | 49.6% | 14.0%(+35.6)#26 | 14.8%(+34.8)#813 |
| 27. | Churchville | 48.7% | 14.0%(+34.7)#27 | 14.8%(+33.9)#856 |
| 28. | Wyndmoor | 48.2% | 14.0%(+34.2)#28 | 14.8%(+33.4)#873 |
| 29. | Newtown Borough | 48.1% | 14.0%(+34.1)#29 | 14.8%(+33.3)#877 |
| 30. | West Conshohocken Borough | 48.0% | 14.0%(+34.0)#30 | 14.8%(+33.2)#882 |
| 31. | Spring House | 45.9% | 14.0%(+31.9)#31 | 14.8%(+31.1)#998 |
| 32. | Maple Glen | 45.4% | 14.0%(+31.4)#32 | 14.8%(+30.6)#1,027 |
| 33. | Chadds Ford | 45.2% | 14.0%(+31.2)#33 | 14.8%(+30.4)#1,041 |
| 34. | Morgan Hill | 44.6% | 14.0%(+30.6)#34 | 14.8%(+29.8)#1,065 |
| 35. | Franklin Park Borough | 44.3% | 14.0%(+30.3)#35 | 14.8%(+29.5)#1,076 |
| 36. | Pughtown | 43.8% | 14.0%(+29.8)#36 | 14.8%(+29.0)#1,114 |
| 37. | Bala Cynwyd | 43.7% | 14.0%(+29.7)#37 | 14.8%(+28.9)#1,121 |
| 38. | Grantley | 43.6% | 14.0%(+29.6)#38 | 14.8%(+28.8)#1,130 |
| 39. | Woodbourne | 43.3% | 14.0%(+29.3)#39 | 14.8%(+28.5)#1,158 |
| 40. | Woodside | 42.7% | 14.0%(+28.7)#40 | 14.8%(+27.9)#1,195 |
| 41. | Ardmore | 42.2% | 14.0%(+28.2)#41 | 14.8%(+27.4)#1,239 |
| 42. | Fort Washington | 41.9% | 14.0%(+27.9)#42 | 14.8%(+27.1)#1,264 |
| 43. | Collegeville Borough | 41.9% | 14.0%(+27.9)#43 | 14.8%(+27.1)#1,265 |
| 44. | Glenmoore | 41.4% | 14.0%(+27.4)#44 | 14.8%(+26.6)#1,298 |
| 45. | Newtown Grant | 41.1% | 14.0%(+27.1)#45 | 14.8%(+26.3)#1,317 |
| 46. | Chesterbrook | 40.8% | 14.0%(+26.8)#46 | 14.8%(+26.0)#1,340 |
| 47. | Waller | 40.6% | 14.0%(+26.6)#47 | 14.8%(+25.8)#1,363 |
| 48. | Bell Acres Borough | 40.5% | 14.0%(+26.5)#48 | 14.8%(+25.7)#1,370 |
| 49. | Mcmurray | 40.2% | 14.0%(+26.2)#49 | 14.8%(+25.4)#1,392 |
| 50. | Schnecksville | 40.1% | 14.0%(+26.1)#50 | 14.8%(+25.3)#1,401 |
| 51. | Elkins Park | 40.0% | 14.0%(+26.0)#51 | 14.8%(+25.2)#1,404 |
| 52. | Aspinwall Borough | 39.5% | 14.0%(+25.5)#52 | 14.8%(+24.7)#1,463 |
| 53. | Laurys Station | 38.6% | 14.0%(+24.6)#53 | 14.8%(+23.8)#1,532 |
| 54. | Malvern Borough | 38.0% | 14.0%(+24.0)#54 | 14.8%(+23.2)#1,580 |
| 55. | Fredericktown | 37.8% | 14.0%(+23.8)#55 | 14.8%(+23.0)#1,599 |
| 56. | Bradford Woods Borough | 37.6% | 14.0%(+23.6)#56 | 14.8%(+22.8)#1,613 |
| 57. | Wayne | 37.4% | 14.0%(+23.4)#57 | 14.8%(+22.6)#1,622 |
| 58. | Berwyn | 37.2% | 14.0%(+23.2)#58 | 14.8%(+22.4)#1,639 |
| 59. | Raubsville | 37.1% | 14.0%(+23.1)#59 | 14.8%(+22.3)#1,648 |
| 60. | Mountainhome | 37.1% | 14.0%(+23.1)#60 | 14.8%(+22.3)#1,649 |
| 61. | Waverly | 35.8% | 14.0%(+21.8)#61 | 14.8%(+21.0)#1,767 |
| 62. | Langhorne Manor Borough | 35.6% | 14.0%(+21.6)#62 | 14.8%(+20.8)#1,782 |
| 63. | Flourtown | 35.4% | 14.0%(+21.4)#63 | 14.8%(+20.6)#1,799 |
| 64. | Sewickley Borough | 34.9% | 14.0%(+20.9)#64 | 14.8%(+20.1)#1,853 |
| 65. | Maxatawny | 34.8% | 14.0%(+20.8)#65 | 14.8%(+20.0)#1,865 |
| 66. | Rosemont | 34.7% | 14.0%(+20.7)#66 | 14.8%(+19.9)#1,867 |
| 67. | Cornwells Heights | 34.7% | 14.0%(+20.7)#67 | 14.8%(+19.9)#1,869 |
| 68. | Ancient Oaks | 34.6% | 14.0%(+20.6)#68 | 14.8%(+19.8)#1,877 |
| 69. | Plymouth Meeting | 34.5% | 14.0%(+20.5)#69 | 14.8%(+19.7)#1,887 |
| 70. | Cheltenham | 34.2% | 14.0%(+20.2)#70 | 14.8%(+19.4)#1,924 |
| 71. | Oakmont Borough | 34.1% | 14.0%(+20.1)#71 | 14.8%(+19.3)#1,931 |
| 72. | Eagleview | 33.3% | 14.0%(+19.3)#72 | 14.8%(+18.5)#1,996 |
| 73. | Little Britain | 32.9% | 14.0%(+18.9)#73 | 14.8%(+18.1)#2,049 |
| 74. | Murrysville | 32.8% | 14.0%(+18.8)#74 | 14.8%(+18.0)#2,053 |
| 75. | Jenkintown Borough | 32.7% | 14.0%(+18.7)#75 | 14.8%(+17.9)#2,066 |
| 76. | Paoli | 32.6% | 14.0%(+18.6)#76 | 14.8%(+17.8)#2,079 |
| 77. | Aaronsburg Cdp Centre County | 32.5% | 14.0%(+18.5)#77 | 14.8%(+17.7)#2,098 |
| 78. | Mckinley | 32.4% | 14.0%(+18.4)#78 | 14.8%(+17.6)#2,106 |
| 79. | Potters Mills | 32.4% | 14.0%(+18.4)#79 | 14.8%(+17.6)#2,110 |
| 80. | Foundryville | 32.3% | 14.0%(+18.3)#80 | 14.8%(+17.5)#2,128 |
| 81. | Exton | 32.2% | 14.0%(+18.2)#81 | 14.8%(+17.4)#2,131 |
| 82. | Trappe Borough | 32.2% | 14.0%(+18.2)#82 | 14.8%(+17.4)#2,132 |
| 83. | Skippack | 32.1% | 14.0%(+18.1)#83 | 14.8%(+17.3)#2,141 |
| 84. | Evansburg | 31.9% | 14.0%(+17.9)#84 | 14.8%(+17.1)#2,165 |
| 85. | Glen Osborne Borough | 31.5% | 14.0%(+17.5)#85 | 14.8%(+16.7)#2,208 |
| 86. | Wyncote | 31.4% | 14.0%(+17.4)#86 | 14.8%(+16.6)#2,213 |
| 87. | Carlisle Barracks | 31.4% | 14.0%(+17.4)#87 | 14.8%(+16.6)#2,216 |
| 88. | Jefferson Hills Borough | 31.3% | 14.0%(+17.3)#88 | 14.8%(+16.5)#2,220 |
| 89. | Rutledge Borough | 31.3% | 14.0%(+17.3)#89 | 14.8%(+16.5)#2,225 |
| 90. | Starrucca Borough | 31.3% | 14.0%(+17.3)#90 | 14.8%(+16.5)#2,230 |
| 91. | Breinigsville | 31.2% | 14.0%(+17.2)#91 | 14.8%(+16.4)#2,234 |
| 92. | Wyomissing Borough | 31.1% | 14.0%(+17.1)#92 | 14.8%(+16.3)#2,244 |
| 93. | Richboro | 30.7% | 14.0%(+16.7)#93 | 14.8%(+15.9)#2,287 |
| 94. | Montgomeryville | 30.6% | 14.0%(+16.6)#94 | 14.8%(+15.8)#2,295 |
| 95. | Haysville Borough | 30.6% | 14.0%(+16.6)#95 | 14.8%(+15.8)#2,304 |
| 96. | Leith Hatfield | 30.5% | 14.0%(+16.5)#96 | 14.8%(+15.7)#2,312 |
| 97. | Woxall | 30.3% | 14.0%(+16.3)#97 | 14.8%(+15.5)#2,335 |
| 98. | Milford Square | 30.1% | 14.0%(+16.1)#98 | 14.8%(+15.3)#2,360 |
| 99. | Ivyland Borough | 30.1% | 14.0%(+16.1)#99 | 14.8%(+15.3)#2,361 |
| 100. | Bryn Athyn Borough | 30.0% | 14.0%(+16.0)#100 | 14.8%(+15.2)#2,371 |
Common Questions
What are the Top 10 Cities with the Highest Percentage of Families with Income Above $200,000 in Pennsylvania?
Top 10 Cities with the Highest Percentage of Families with Income Above $200,000 in Pennsylvania are:
#1
100.0%
#2
60.2%
#3
58.5%
#4
58.5%
#5
56.9%
#6
56.7%
#7
55.1%
#8
49.8%
#9
48.7%
#10
48.2%
What city has the Highest Percentage of Families with Income Above $200,000 in Pennsylvania?
Westland has the Highest Percentage of Families with Income Above $200,000 in Pennsylvania with 100.0%.
What is the Percentage of Families with Income Above $200,000 in the State of Pennsylvania?
Percentage of Families with Income Above $200,000 in Pennsylvania is 14.0%.
What is the Percentage of Families with Income Above $200,000 in the United States?
Percentage of Families with Income Above $200,000 in the United States is 14.8%.