Lucas Valley Marinwood, CA Map & Demographics
Lucas Valley Marinwood Map
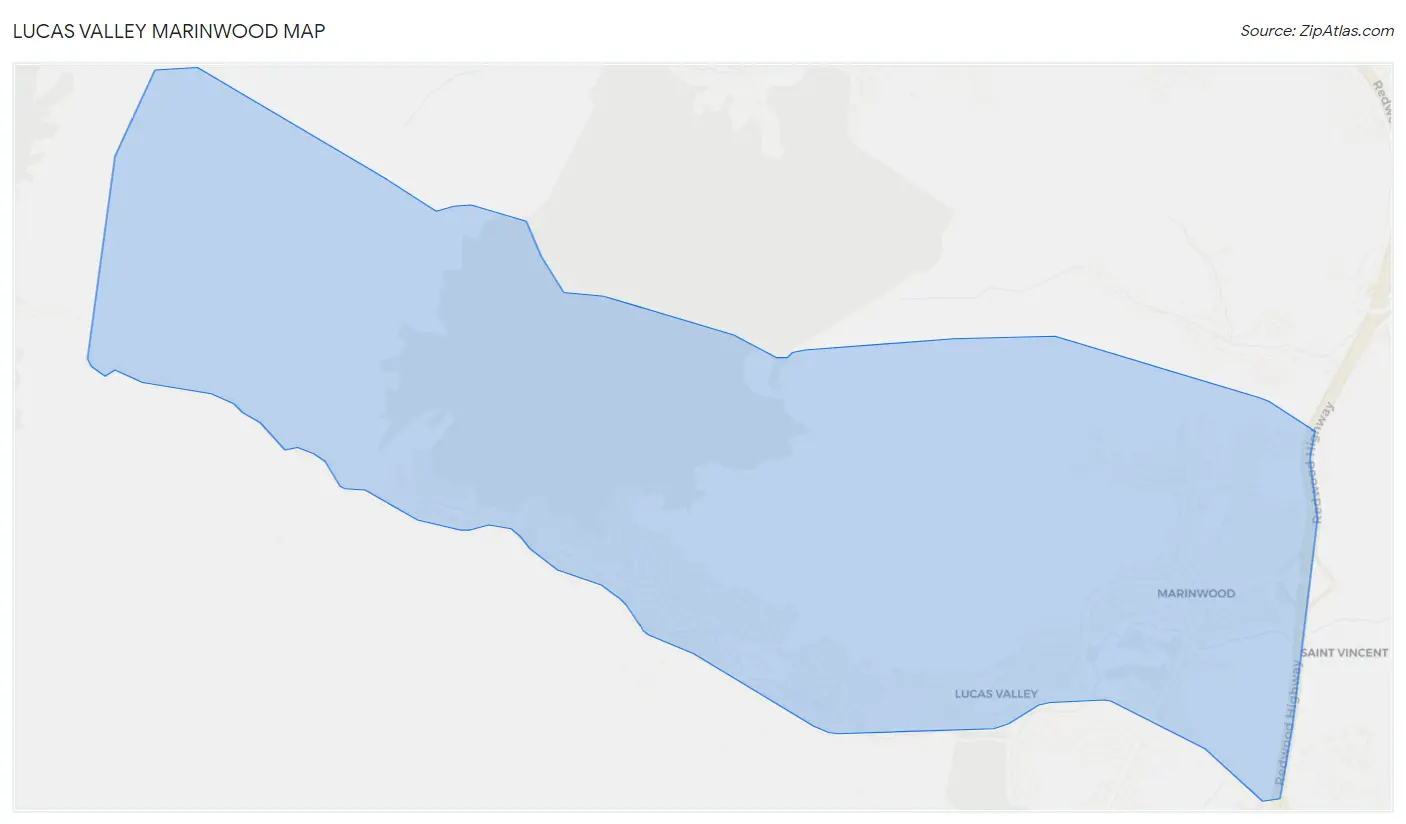
Lucas Valley Marinwood Overview
$105,657
PER CAPITA INCOME
$250,001
AVG FAMILY INCOME
$216,524
AVG HOUSEHOLD INCOME
53.3%
WAGE / INCOME GAP [ % ]
46.7¢/ $1
WAGE / INCOME GAP [ $ ]
0.46
INEQUALITY / GINI INDEX
6,334
TOTAL POPULATION
2,561
MALE POPULATION
3,773
FEMALE POPULATION
67.88
MALES / 100 FEMALES
147.33
FEMALES / 100 MALES
49.5
MEDIAN AGE
3.1
AVG FAMILY SIZE
2.6
AVG HOUSEHOLD SIZE
3,320
LABOR FORCE [ PEOPLE ]
62.6%
PERCENT IN LABOR FORCE
2.4%
UNEMPLOYMENT RATE
Income in Lucas Valley Marinwood
Income Overview in Lucas Valley Marinwood
Per Capita Income in Lucas Valley Marinwood is $105,657, while median incomes of families and households are $250,001 and $216,524 respectively.
| Characteristic | Number | Measure |
| Per Capita Income | 6,334 | $105,657 |
| Median Family Income | 1,648 | $250,001 |
| Mean Family Income | 1,648 | $300,383 |
| Median Household Income | 2,420 | $216,524 |
| Mean Household Income | 2,420 | $276,928 |
| Income Deficit | 1,648 | $0 |
| Wage / Income Gap (%) | 6,334 | 53.31% |
| Wage / Income Gap ($) | 6,334 | 46.69¢ per $1 |
| Gini / Inequality Index | 6,334 | 0.46 |
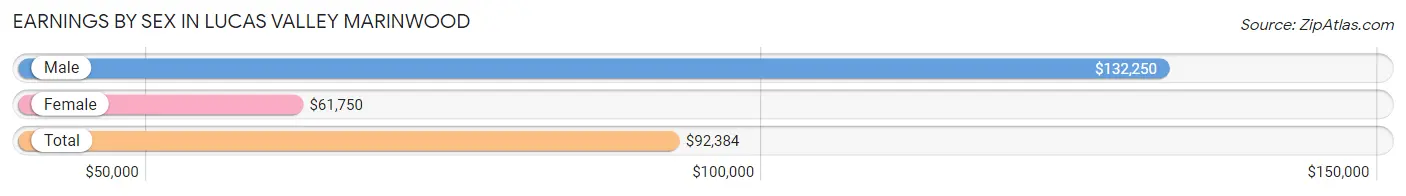
Earnings by Sex in Lucas Valley Marinwood
Average Earnings in Lucas Valley Marinwood are $92,384, $132,250 for men and $61,750 for women, a difference of 53.3%.
| Sex | Number | Average Earnings |
| Male | 1,473 (43.4%) | $132,250 |
| Female | 1,921 (56.6%) | $61,750 |
| Total | 3,394 (100.0%) | $92,384 |
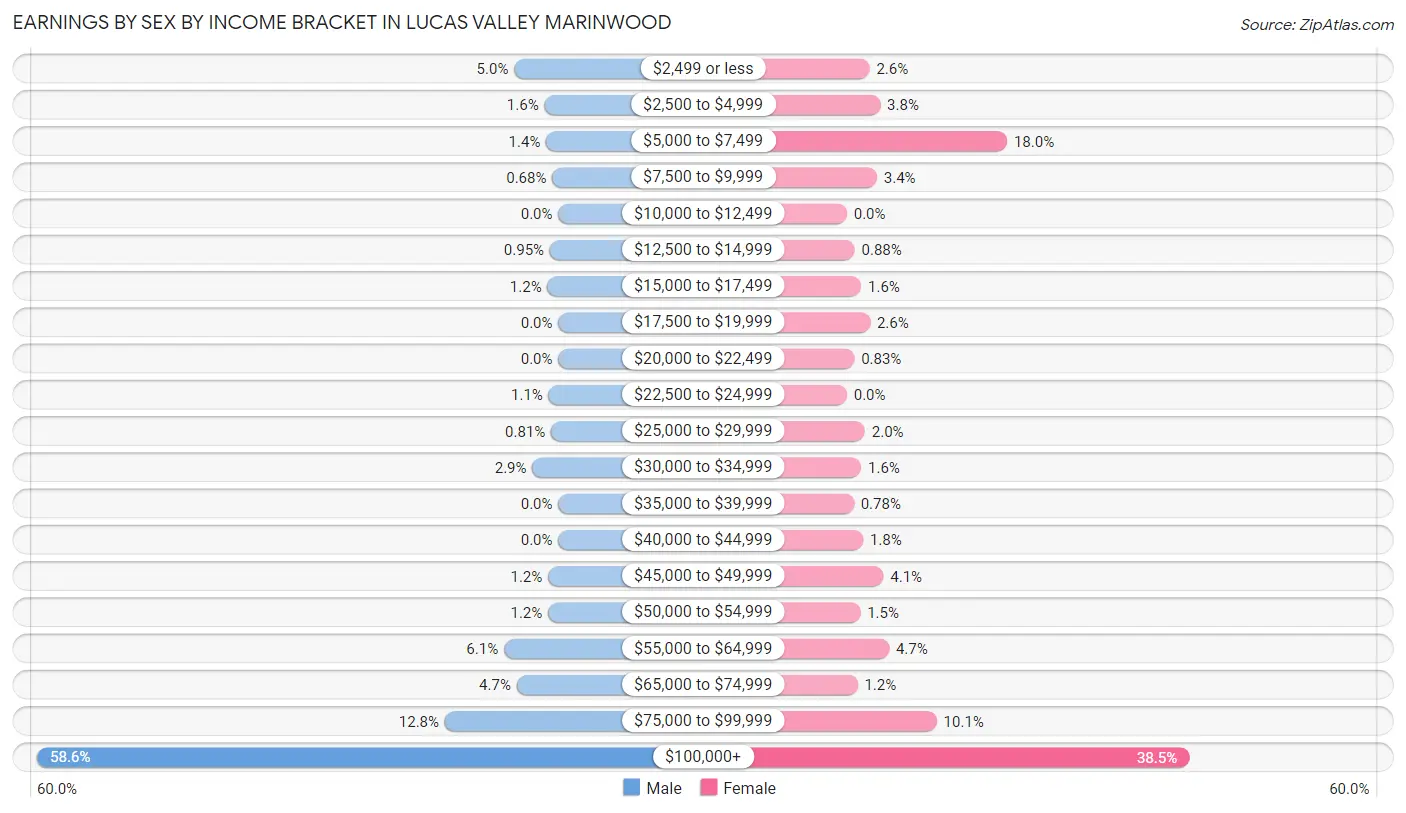
Earnings by Sex by Income Bracket in Lucas Valley Marinwood
The most common earnings brackets in Lucas Valley Marinwood are $100,000+ for men (863 | 58.6%) and $100,000+ for women (739 | 38.5%).
| Income | Male | Female |
| $2,499 or less | 73 (5.0%) | 49 (2.5%) |
| $2,500 to $4,999 | 23 (1.6%) | 72 (3.7%) |
| $5,000 to $7,499 | 20 (1.4%) | 346 (18.0%) |
| $7,500 to $9,999 | 10 (0.7%) | 65 (3.4%) |
| $10,000 to $12,499 | 0 (0.0%) | 0 (0.0%) |
| $12,500 to $14,999 | 14 (0.9%) | 17 (0.9%) |
| $15,000 to $17,499 | 18 (1.2%) | 31 (1.6%) |
| $17,500 to $19,999 | 0 (0.0%) | 50 (2.6%) |
| $20,000 to $22,499 | 0 (0.0%) | 16 (0.8%) |
| $22,500 to $24,999 | 16 (1.1%) | 0 (0.0%) |
| $25,000 to $29,999 | 12 (0.8%) | 39 (2.0%) |
| $30,000 to $34,999 | 43 (2.9%) | 31 (1.6%) |
| $35,000 to $39,999 | 0 (0.0%) | 15 (0.8%) |
| $40,000 to $44,999 | 0 (0.0%) | 35 (1.8%) |
| $45,000 to $49,999 | 17 (1.1%) | 79 (4.1%) |
| $50,000 to $54,999 | 17 (1.1%) | 29 (1.5%) |
| $55,000 to $64,999 | 90 (6.1%) | 91 (4.7%) |
| $65,000 to $74,999 | 69 (4.7%) | 23 (1.2%) |
| $75,000 to $99,999 | 188 (12.8%) | 194 (10.1%) |
| $100,000+ | 863 (58.6%) | 739 (38.5%) |
| Total | 1,473 (100.0%) | 1,921 (100.0%) |
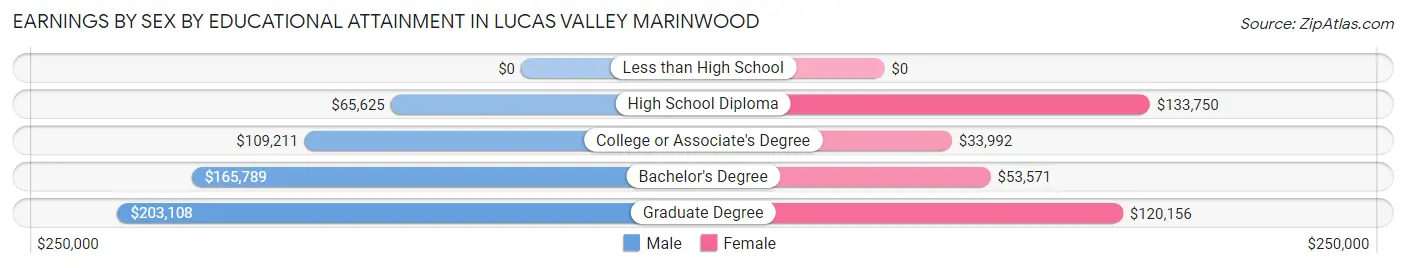
Earnings by Sex by Educational Attainment in Lucas Valley Marinwood
Average earnings in Lucas Valley Marinwood are $152,756 for men and $76,349 for women, a difference of 50.0%. Men with an educational attainment of graduate degree enjoy the highest average annual earnings of $203,108, while those with high school diploma education earn the least with $65,625. Women with an educational attainment of high school diploma earn the most with the average annual earnings of $133,750, while those with college or associate's degree education have the smallest earnings of $33,992.
| Educational Attainment | Male Income | Female Income |
| Less than High School | - | - |
| High School Diploma | $65,625 | $133,750 |
| College or Associate's Degree | $109,211 | $33,992 |
| Bachelor's Degree | $165,789 | $53,571 |
| Graduate Degree | $203,108 | $120,156 |
| Total | $152,756 | $76,349 |
Family Income in Lucas Valley Marinwood
Family Income Brackets in Lucas Valley Marinwood
According to the Lucas Valley Marinwood family income data, there are 929 families falling into the $200,000+ income range, which is the most common income bracket and makes up 56.4% of all families.
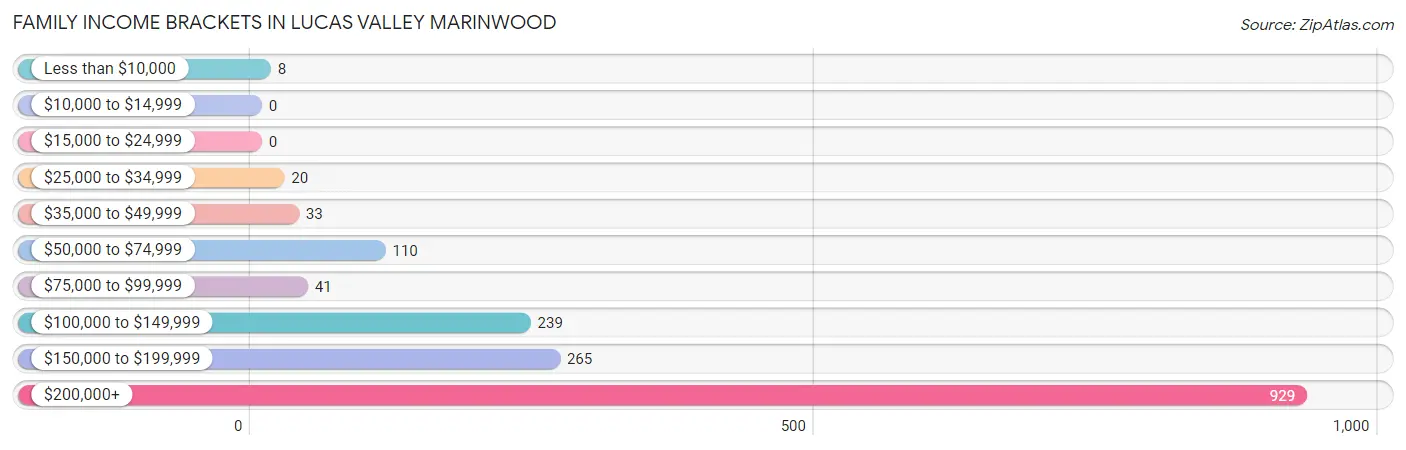
| Income Bracket | # Families | % Families |
| Less than $10,000 | 8 | 0.5% |
| $10,000 to $14,999 | 0 | 0.0% |
| $15,000 to $24,999 | 0 | 0.0% |
| $25,000 to $34,999 | 20 | 1.2% |
| $35,000 to $49,999 | 33 | 2.0% |
| $50,000 to $74,999 | 110 | 6.7% |
| $75,000 to $99,999 | 41 | 2.5% |
| $100,000 to $149,999 | 239 | 14.5% |
| $150,000 to $199,999 | 265 | 16.1% |
| $200,000+ | 929 | 56.4% |
Family Income by Famaliy Size in Lucas Valley Marinwood
3-person families (549 | 33.3%) account for the highest median family income in Lucas Valley Marinwood with $250,001 per family, while 2-person families (654 | 39.7%) have the highest median income of $93,125 per family member.
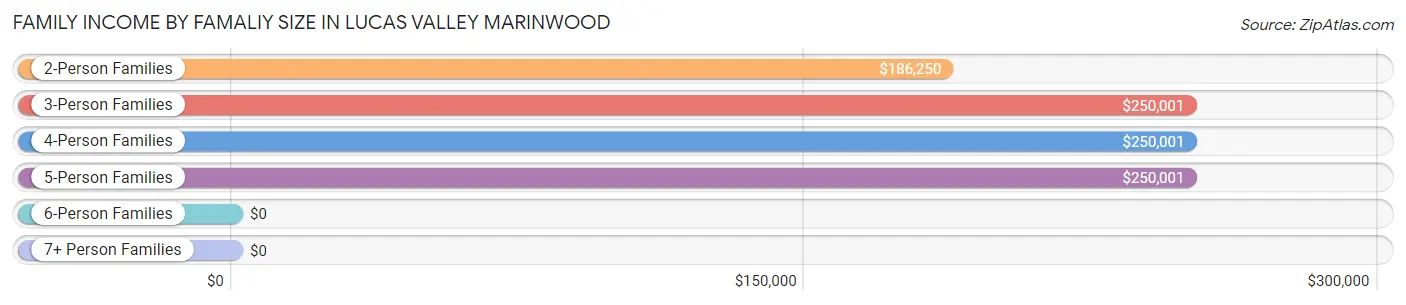
| Income Bracket | # Families | Median Income |
| 2-Person Families | 654 (39.7%) | $186,250 |
| 3-Person Families | 549 (33.3%) | $250,001 |
| 4-Person Families | 357 (21.7%) | $250,001 |
| 5-Person Families | 72 (4.4%) | $250,001 |
| 6-Person Families | 0 (0.0%) | $0 |
| 7+ Person Families | 16 (1.0%) | $0 |
| Total | 1,648 (100.0%) | $250,001 |
Family Income by Number of Earners in Lucas Valley Marinwood
The median family income in Lucas Valley Marinwood is $250,001, with families comprising 2 earners (854) having the highest median family income of $250,001, while families with no earners (225) have the lowest median family income of $133,984, accounting for 51.8% and 13.7% of families, respectively.
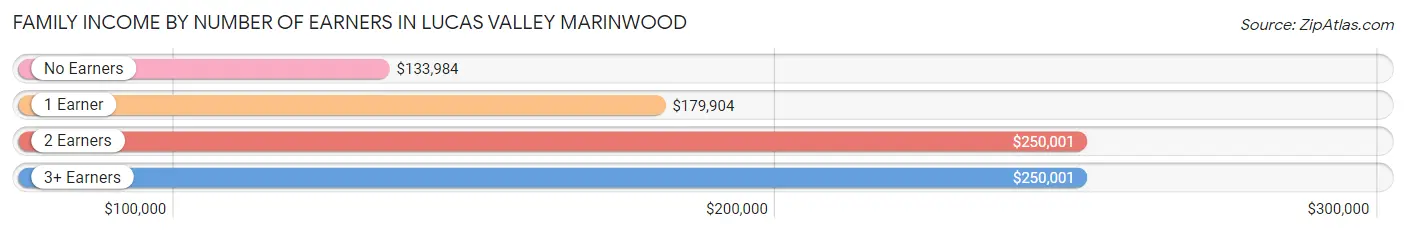
| Number of Earners | # Families | Median Income |
| No Earners | 225 (13.7%) | $133,984 |
| 1 Earner | 373 (22.6%) | $179,904 |
| 2 Earners | 854 (51.8%) | $250,001 |
| 3+ Earners | 196 (11.9%) | $250,001 |
| Total | 1,648 (100.0%) | $250,001 |
Household Income in Lucas Valley Marinwood
Household Income Brackets in Lucas Valley Marinwood
With 1,258 households falling in the category, the $200,000+ income range is the most frequent in Lucas Valley Marinwood, accounting for 52.0% of all households. In contrast, only 10 households (0.4%) fall into the $10,000 to $14,999 income bracket, making it the least populous group.
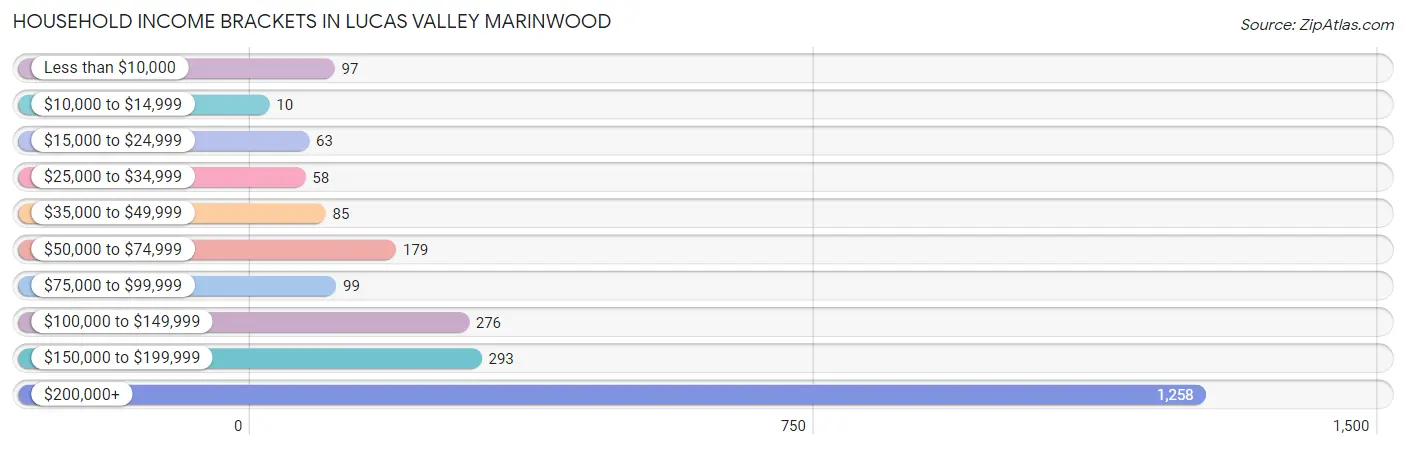
| Income Bracket | # Households | % Households |
| Less than $10,000 | 97 | 4.0% |
| $10,000 to $14,999 | 10 | 0.4% |
| $15,000 to $24,999 | 63 | 2.6% |
| $25,000 to $34,999 | 58 | 2.4% |
| $35,000 to $49,999 | 85 | 3.5% |
| $50,000 to $74,999 | 179 | 7.4% |
| $75,000 to $99,999 | 99 | 4.1% |
| $100,000 to $149,999 | 276 | 11.4% |
| $150,000 to $199,999 | 293 | 12.1% |
| $200,000+ | 1,258 | 52.0% |
Household Income by Householder Age in Lucas Valley Marinwood
The median household income in Lucas Valley Marinwood is $216,524, with the highest median household income of $250,001 found in the 25 to 44 years age bracket for the primary householder. A total of 302 households (12.5%) fall into this category. Meanwhile, the 15 to 24 years age bracket for the primary householder has the lowest median household income of $0, with 18 households (0.7%) in this group.
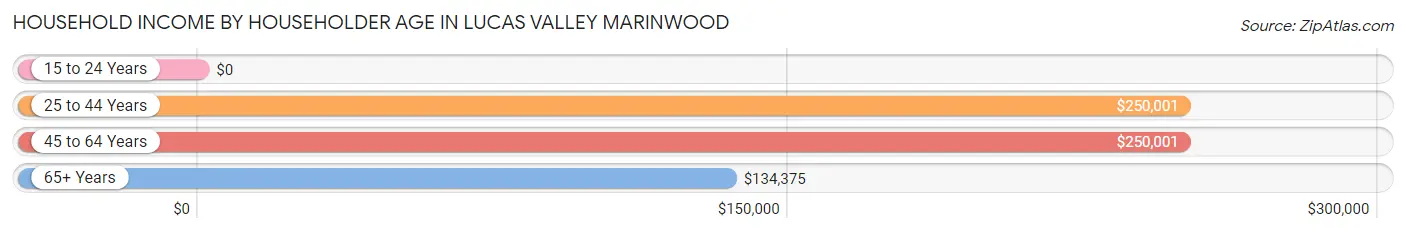
| Income Bracket | # Households | Median Income |
| 15 to 24 Years | 18 (0.7%) | $0 |
| 25 to 44 Years | 302 (12.5%) | $250,001 |
| 45 to 64 Years | 945 (39.1%) | $250,001 |
| 65+ Years | 1,155 (47.7%) | $134,375 |
| Total | 2,420 (100.0%) | $216,524 |
Poverty in Lucas Valley Marinwood
Income Below Poverty by Sex and Age in Lucas Valley Marinwood
With 3.0% poverty level for males and 4.4% for females among the residents of Lucas Valley Marinwood, 18 to 24 year old males and 15 year old females are the most vulnerable to poverty, with 10 males (11.1%) and 21 females (35.0%) in their respective age groups living below the poverty level.
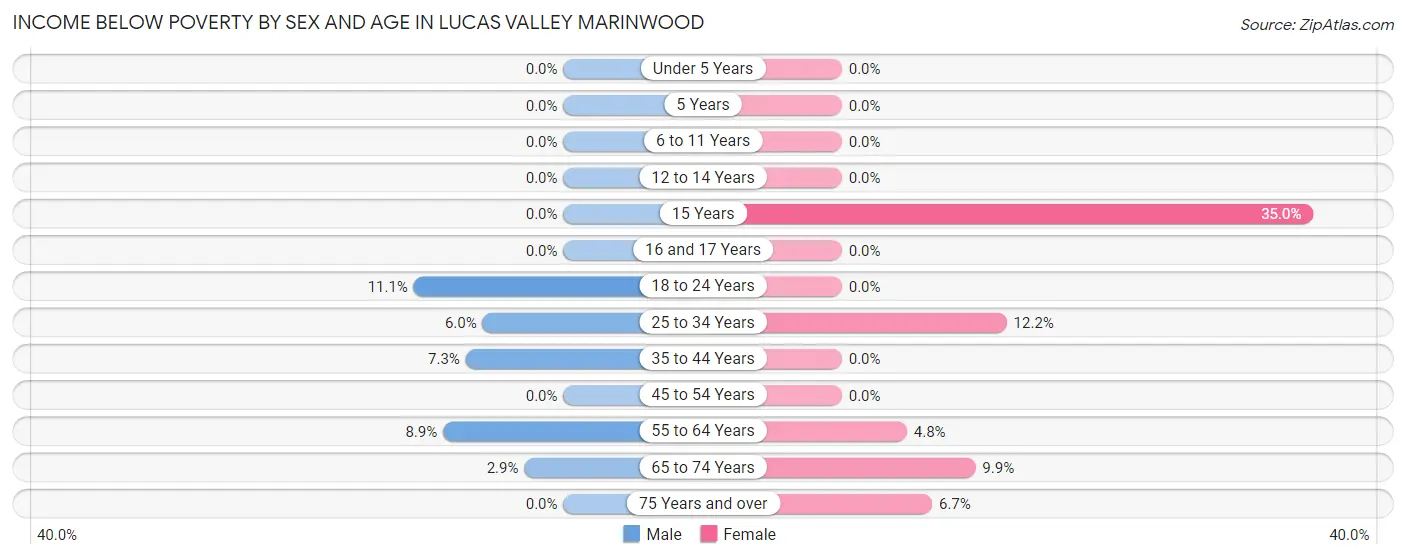
| Age Bracket | Male | Female |
| Under 5 Years | 0 (0.0%) | 0 (0.0%) |
| 5 Years | 0 (0.0%) | 0 (0.0%) |
| 6 to 11 Years | 0 (0.0%) | 0 (0.0%) |
| 12 to 14 Years | 0 (0.0%) | 0 (0.0%) |
| 15 Years | 0 (0.0%) | 21 (35.0%) |
| 16 and 17 Years | 0 (0.0%) | 0 (0.0%) |
| 18 to 24 Years | 10 (11.1%) | 0 (0.0%) |
| 25 to 34 Years | 9 (6.0%) | 35 (12.2%) |
| 35 to 44 Years | 14 (7.2%) | 0 (0.0%) |
| 45 to 54 Years | 0 (0.0%) | 0 (0.0%) |
| 55 to 64 Years | 30 (8.9%) | 21 (4.8%) |
| 65 to 74 Years | 13 (2.9%) | 49 (9.9%) |
| 75 Years and over | 0 (0.0%) | 39 (6.7%) |
| Total | 76 (3.0%) | 165 (4.4%) |
Income Above Poverty by Sex and Age in Lucas Valley Marinwood
According to the poverty statistics in Lucas Valley Marinwood, males aged under 5 years and females aged under 5 years are the age groups that are most secure financially, with 100.0% of males and 100.0% of females in these age groups living above the poverty line.
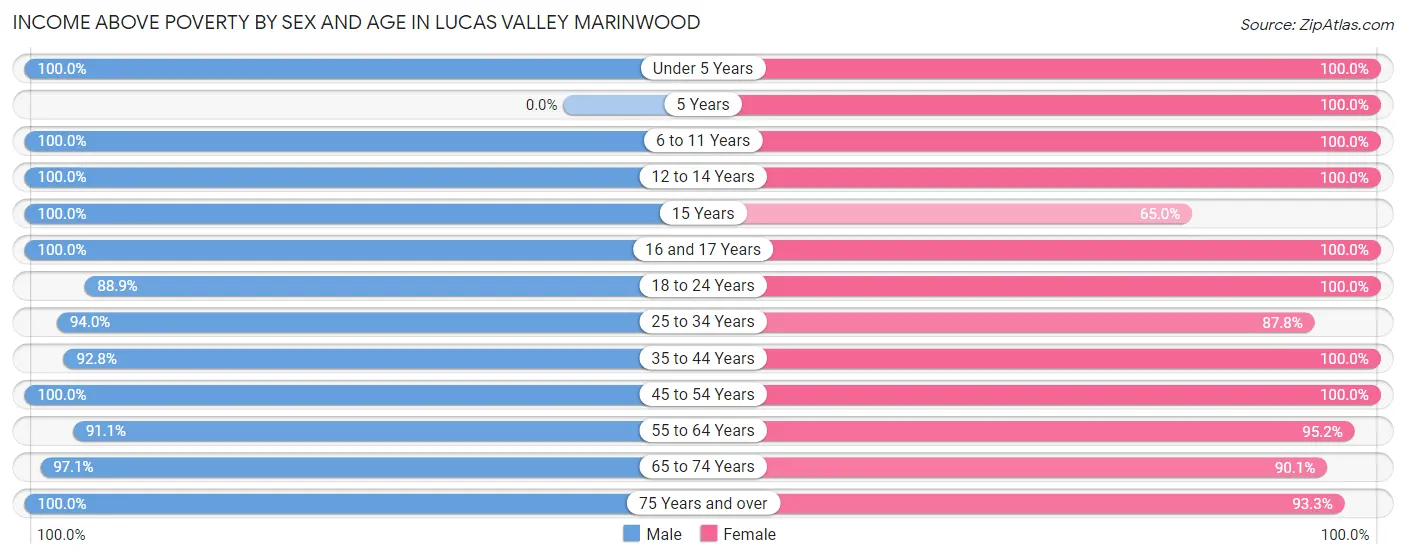
| Age Bracket | Male | Female |
| Under 5 Years | 55 (100.0%) | 41 (100.0%) |
| 5 Years | 0 (0.0%) | 73 (100.0%) |
| 6 to 11 Years | 266 (100.0%) | 248 (100.0%) |
| 12 to 14 Years | 129 (100.0%) | 142 (100.0%) |
| 15 Years | 15 (100.0%) | 39 (65.0%) |
| 16 and 17 Years | 102 (100.0%) | 104 (100.0%) |
| 18 to 24 Years | 80 (88.9%) | 214 (100.0%) |
| 25 to 34 Years | 141 (94.0%) | 251 (87.8%) |
| 35 to 44 Years | 179 (92.7%) | 310 (100.0%) |
| 45 to 54 Years | 528 (100.0%) | 779 (100.0%) |
| 55 to 64 Years | 306 (91.1%) | 414 (95.2%) |
| 65 to 74 Years | 436 (97.1%) | 445 (90.1%) |
| 75 Years and over | 237 (100.0%) | 543 (93.3%) |
| Total | 2,474 (97.0%) | 3,603 (95.6%) |
Income Below Poverty Among Married-Couple Families in Lucas Valley Marinwood
The poverty statistics for married-couple families in Lucas Valley Marinwood show that 0.6% or 9 of the total 1,486 families live below the poverty line. Families with no children have the highest poverty rate of 1.1%, comprising of 9 families. On the other hand, families with 1 or 2 children have the lowest poverty rate of 0.0%, which includes 0 families.
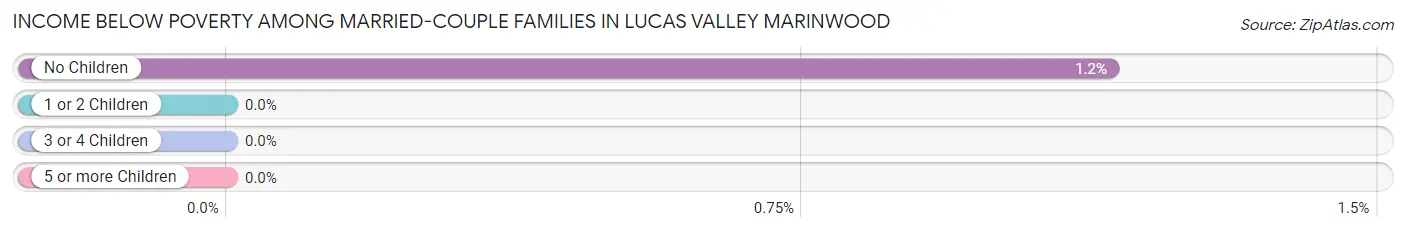
| Children | Above Poverty | Below Poverty |
| No Children | 777 (98.9%) | 9 (1.1%) |
| 1 or 2 Children | 644 (100.0%) | 0 (0.0%) |
| 3 or 4 Children | 56 (100.0%) | 0 (0.0%) |
| 5 or more Children | 0 (0.0%) | 0 (0.0%) |
| Total | 1,477 (99.4%) | 9 (0.6%) |
Income Below Poverty Among Single-Parent Households in Lucas Valley Marinwood
| Children | Single Father | Single Mother |
| No Children | 0 (0.0%) | 0 (0.0%) |
| 1 or 2 Children | 0 (0.0%) | 0 (0.0%) |
| 3 or 4 Children | 0 (0.0%) | 0 (0.0%) |
| 5 or more Children | 0 (0.0%) | 0 (0.0%) |
| Total | 0 (0.0%) | 0 (0.0%) |
Income Below Poverty Among Married-Couple vs Single-Parent Households in Lucas Valley Marinwood
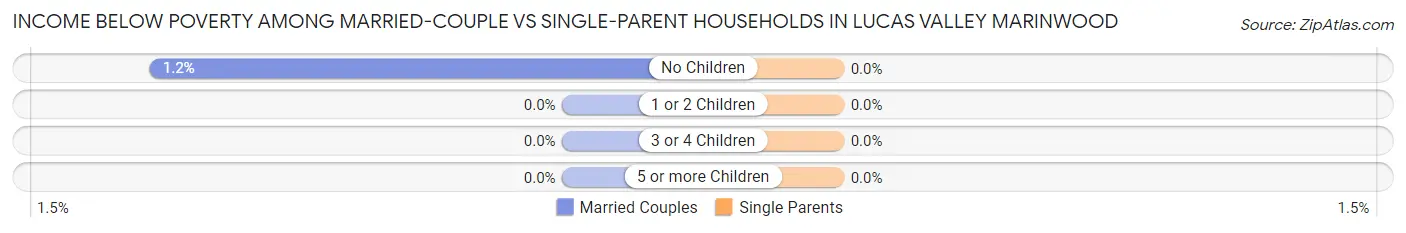
| Children | Married-Couple Families | Single-Parent Households |
| No Children | 9 (1.1%) | 0 (0.0%) |
| 1 or 2 Children | 0 (0.0%) | 0 (0.0%) |
| 3 or 4 Children | 0 (0.0%) | 0 (0.0%) |
| 5 or more Children | 0 (0.0%) | 0 (0.0%) |
| Total | 9 (0.6%) | 0 (0.0%) |
Race in Lucas Valley Marinwood
The most populous races in Lucas Valley Marinwood are White / Caucasian (5,038 | 79.5%), Two or more Races (683 | 10.8%), and Asian (484 | 7.6%).
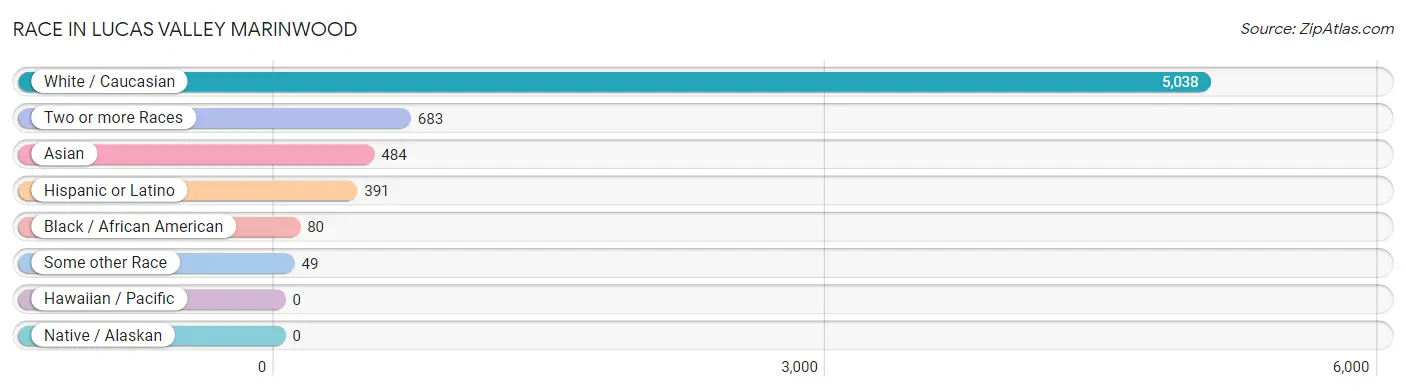
| Race | # Population | % Population |
| Asian | 484 | 7.6% |
| Black / African American | 80 | 1.3% |
| Hawaiian / Pacific | 0 | 0.0% |
| Hispanic or Latino | 391 | 6.2% |
| Native / Alaskan | 0 | 0.0% |
| White / Caucasian | 5,038 | 79.5% |
| Two or more Races | 683 | 10.8% |
| Some other Race | 49 | 0.8% |
| Total | 6,334 | 100.0% |
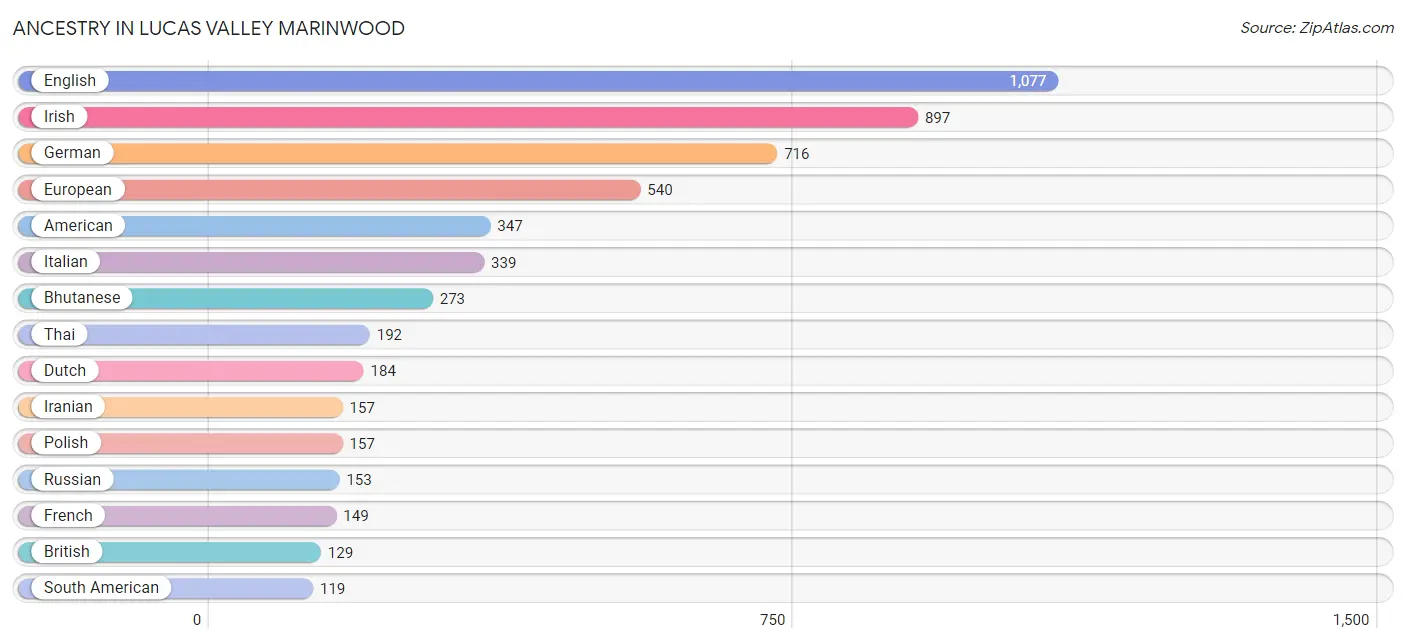
Ancestry in Lucas Valley Marinwood
The most populous ancestries reported in Lucas Valley Marinwood are English (1,077 | 17.0%), Irish (897 | 14.2%), German (716 | 11.3%), European (540 | 8.5%), and American (347 | 5.5%), together accounting for 56.5% of all Lucas Valley Marinwood residents.
| Ancestry | # Population | % Population |
| African | 87 | 1.4% |
| Albanian | 16 | 0.3% |
| American | 347 | 5.5% |
| Australian | 98 | 1.5% |
| Austrian | 12 | 0.2% |
| Belgian | 11 | 0.2% |
| Bhutanese | 273 | 4.3% |
| British | 129 | 2.0% |
| Central American | 82 | 1.3% |
| Colombian | 18 | 0.3% |
| Croatian | 53 | 0.8% |
| Cuban | 57 | 0.9% |
| Czech | 16 | 0.3% |
| Danish | 56 | 0.9% |
| Dutch | 184 | 2.9% |
| Eastern European | 66 | 1.0% |
| Ecuadorian | 60 | 0.9% |
| English | 1,077 | 17.0% |
| European | 540 | 8.5% |
| French | 149 | 2.4% |
| French Canadian | 9 | 0.1% |
| German | 716 | 11.3% |
| Honduran | 46 | 0.7% |
| Hungarian | 14 | 0.2% |
| Indian (Asian) | 92 | 1.5% |
| Iranian | 157 | 2.5% |
| Irish | 897 | 14.2% |
| Italian | 339 | 5.3% |
| Japanese | 58 | 0.9% |
| Korean | 99 | 1.6% |
| Lithuanian | 10 | 0.2% |
| Mexican | 41 | 0.6% |
| Mongolian | 25 | 0.4% |
| Nicaraguan | 36 | 0.6% |
| Northern European | 27 | 0.4% |
| Norwegian | 104 | 1.6% |
| Polish | 157 | 2.5% |
| Portuguese | 14 | 0.2% |
| Puerto Rican | 17 | 0.3% |
| Russian | 153 | 2.4% |
| Scandinavian | 57 | 0.9% |
| Scotch-Irish | 70 | 1.1% |
| Scottish | 71 | 1.1% |
| Serbian | 11 | 0.2% |
| Slovak | 50 | 0.8% |
| South American | 119 | 1.9% |
| Spanish | 27 | 0.4% |
| Subsaharan African | 87 | 1.4% |
| Swedish | 101 | 1.6% |
| Swiss | 108 | 1.7% |
| Thai | 192 | 3.0% |
| Turkish | 21 | 0.3% |
| Ukrainian | 73 | 1.1% |
| Venezuelan | 41 | 0.6% |
| Welsh | 36 | 0.6% |
| West Indian | 28 | 0.4% | View All 56 Rows |
Immigrants in Lucas Valley Marinwood
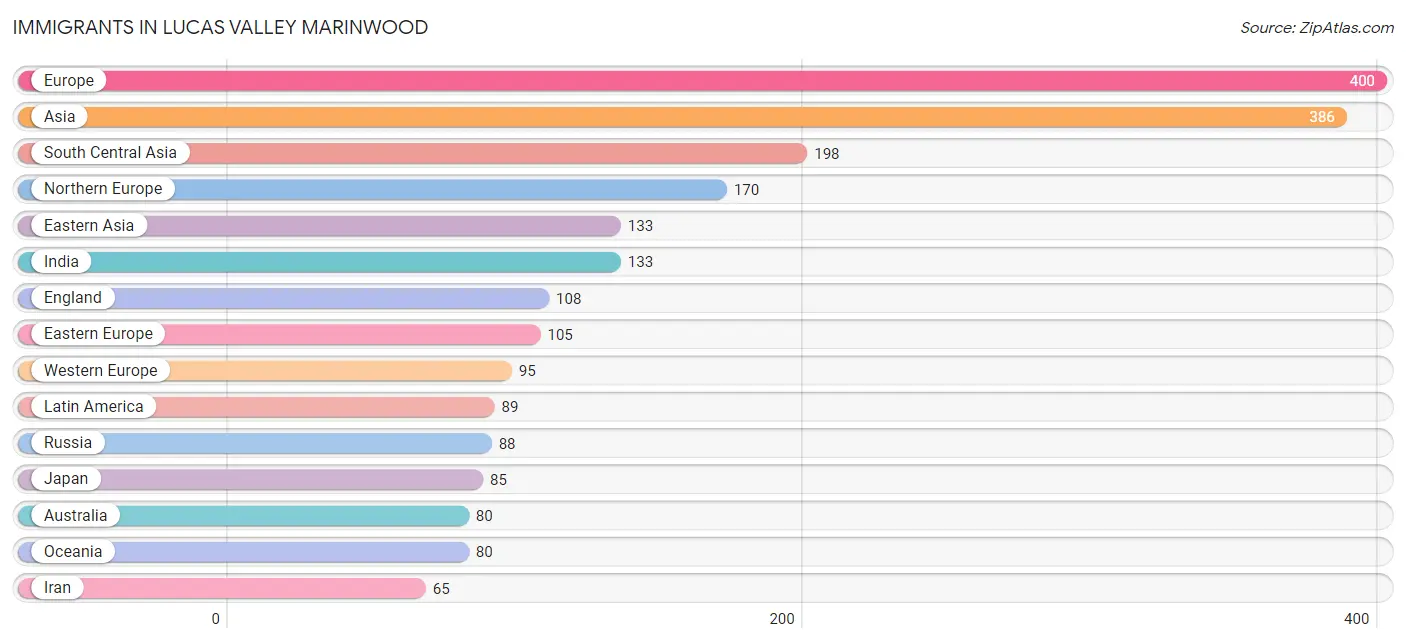
The most numerous immigrant groups reported in Lucas Valley Marinwood came from Europe (400 | 6.3%), Asia (386 | 6.1%), South Central Asia (198 | 3.1%), Northern Europe (170 | 2.7%), and Eastern Asia (133 | 2.1%), together accounting for 20.3% of all Lucas Valley Marinwood residents.
| Immigration Origin | # Population | % Population |
| Africa | 16 | 0.3% |
| Asia | 386 | 6.1% |
| Australia | 80 | 1.3% |
| Belarus | 17 | 0.3% |
| Brazil | 17 | 0.3% |
| Canada | 41 | 0.6% |
| Caribbean | 32 | 0.5% |
| Central America | 2 | 0.0% |
| China | 48 | 0.8% |
| Cuba | 32 | 0.5% |
| Denmark | 11 | 0.2% |
| Eastern Asia | 133 | 2.1% |
| Eastern Europe | 105 | 1.7% |
| Ecuador | 23 | 0.4% |
| England | 108 | 1.7% |
| Europe | 400 | 6.3% |
| France | 20 | 0.3% |
| Guatemala | 2 | 0.0% |
| Hong Kong | 12 | 0.2% |
| India | 133 | 2.1% |
| Indonesia | 10 | 0.2% |
| Iran | 65 | 1.0% |
| Ireland | 32 | 0.5% |
| Italy | 16 | 0.3% |
| Japan | 85 | 1.3% |
| Latin America | 89 | 1.4% |
| Netherlands | 61 | 1.0% |
| Northern Europe | 170 | 2.7% |
| Oceania | 80 | 1.3% |
| Philippines | 27 | 0.4% |
| Portugal | 14 | 0.2% |
| Russia | 88 | 1.4% |
| South Africa | 16 | 0.3% |
| South America | 55 | 0.9% |
| South Central Asia | 198 | 3.1% |
| South Eastern Asia | 55 | 0.9% |
| Southern Europe | 30 | 0.5% |
| Switzerland | 14 | 0.2% |
| Thailand | 18 | 0.3% |
| Venezuela | 15 | 0.2% |
| Western Europe | 95 | 1.5% | View All 41 Rows |
Sex and Age in Lucas Valley Marinwood
Sex and Age in Lucas Valley Marinwood
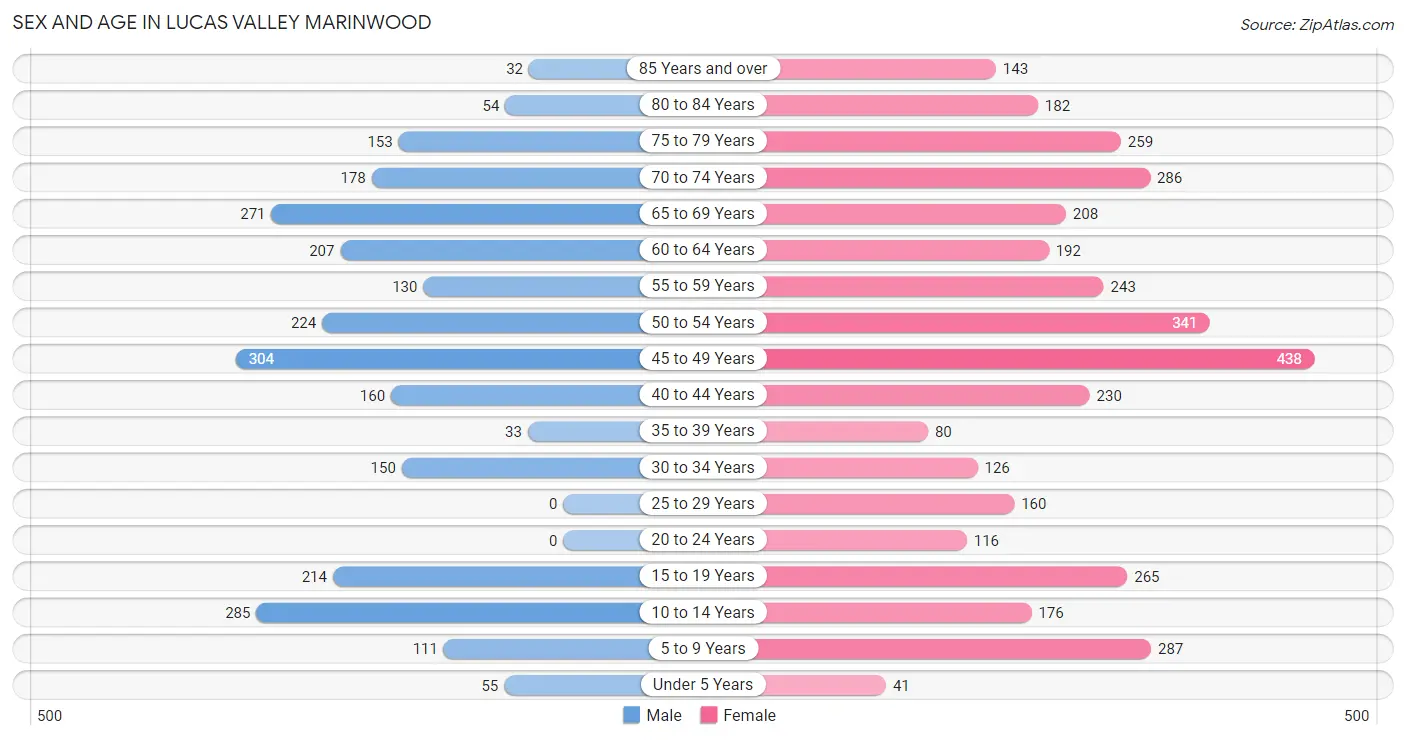
The most populous age groups in Lucas Valley Marinwood are 45 to 49 Years (304 | 11.9%) for men and 45 to 49 Years (438 | 11.6%) for women.
| Age Bracket | Male | Female |
| Under 5 Years | 55 (2.1%) | 41 (1.1%) |
| 5 to 9 Years | 111 (4.3%) | 287 (7.6%) |
| 10 to 14 Years | 285 (11.1%) | 176 (4.7%) |
| 15 to 19 Years | 214 (8.4%) | 265 (7.0%) |
| 20 to 24 Years | 0 (0.0%) | 116 (3.1%) |
| 25 to 29 Years | 0 (0.0%) | 160 (4.2%) |
| 30 to 34 Years | 150 (5.9%) | 126 (3.3%) |
| 35 to 39 Years | 33 (1.3%) | 80 (2.1%) |
| 40 to 44 Years | 160 (6.2%) | 230 (6.1%) |
| 45 to 49 Years | 304 (11.9%) | 438 (11.6%) |
| 50 to 54 Years | 224 (8.7%) | 341 (9.0%) |
| 55 to 59 Years | 130 (5.1%) | 243 (6.4%) |
| 60 to 64 Years | 207 (8.1%) | 192 (5.1%) |
| 65 to 69 Years | 271 (10.6%) | 208 (5.5%) |
| 70 to 74 Years | 178 (7.0%) | 286 (7.6%) |
| 75 to 79 Years | 153 (6.0%) | 259 (6.9%) |
| 80 to 84 Years | 54 (2.1%) | 182 (4.8%) |
| 85 Years and over | 32 (1.3%) | 143 (3.8%) |
| Total | 2,561 (100.0%) | 3,773 (100.0%) |
Families and Households in Lucas Valley Marinwood
Median Family Size in Lucas Valley Marinwood
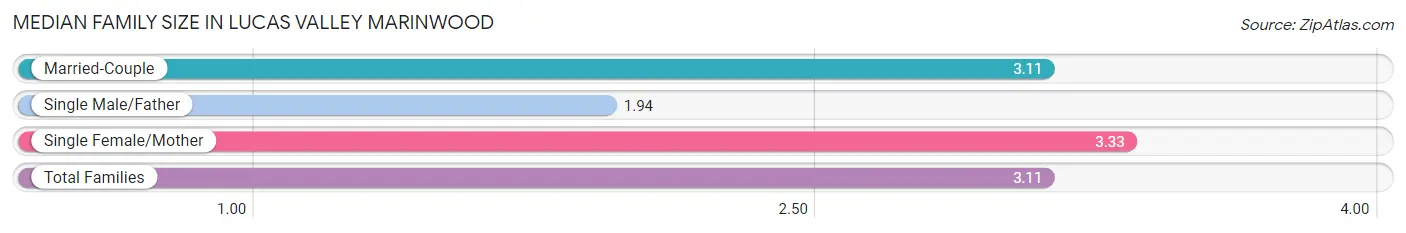
The median family size in Lucas Valley Marinwood is 3.11 persons per family, with single female/mother families (129 | 7.8%) accounting for the largest median family size of 3.33 persons per family. On the other hand, single male/father families (33 | 2.0%) represent the smallest median family size with 1.94 persons per family.
| Family Type | # Families | Family Size |
| Married-Couple | 1,486 (90.2%) | 3.11 |
| Single Male/Father | 33 (2.0%) | 1.94 |
| Single Female/Mother | 129 (7.8%) | 3.33 |
| Total Families | 1,648 (100.0%) | 3.11 |
Median Household Size in Lucas Valley Marinwood
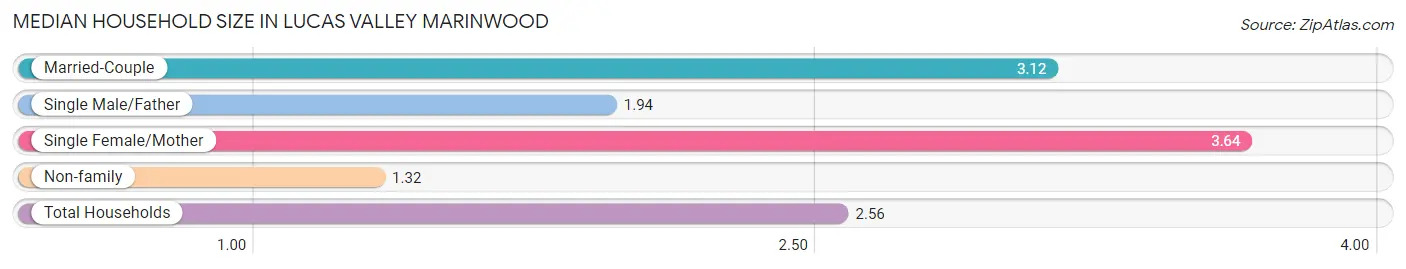
The median household size in Lucas Valley Marinwood is 2.56 persons per household, with single female/mother households (129 | 5.3%) accounting for the largest median household size of 3.64 persons per household. non-family households (772 | 31.9%) represent the smallest median household size with 1.32 persons per household.
| Household Type | # Households | Household Size |
| Married-Couple | 1,486 (61.4%) | 3.12 |
| Single Male/Father | 33 (1.4%) | 1.94 |
| Single Female/Mother | 129 (5.3%) | 3.64 |
| Non-family | 772 (31.9%) | 1.32 |
| Total Households | 2,420 (100.0%) | 2.56 |
Household Size by Marriage Status in Lucas Valley Marinwood
Out of a total of 2,420 households in Lucas Valley Marinwood, 1,648 (68.1%) are family households, while 772 (31.9%) are nonfamily households. The most numerous type of family households are 2-person households, comprising 654, and the most common type of nonfamily households are 1-person households, comprising 588.
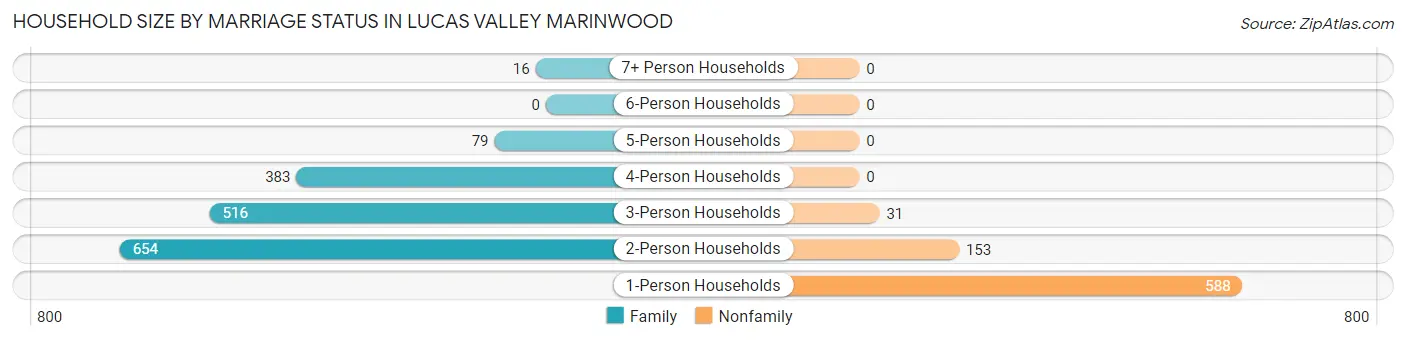
| Household Size | Family Households | Nonfamily Households |
| 1-Person Households | - | 588 (24.3%) |
| 2-Person Households | 654 (27.0%) | 153 (6.3%) |
| 3-Person Households | 516 (21.3%) | 31 (1.3%) |
| 4-Person Households | 383 (15.8%) | 0 (0.0%) |
| 5-Person Households | 79 (3.3%) | 0 (0.0%) |
| 6-Person Households | 0 (0.0%) | 0 (0.0%) |
| 7+ Person Households | 16 (0.7%) | 0 (0.0%) |
| Total | 1,648 (68.1%) | 772 (31.9%) |
Female Fertility in Lucas Valley Marinwood
Fertility by Age in Lucas Valley Marinwood
Average fertility rate in Lucas Valley Marinwood is 14.0 births per 1,000 women. Women in the age bracket of 20 to 34 years have the highest fertility rate with 50.0 births per 1,000 women. Women in the age bracket of 20 to 34 years acount for 100.0% of all women with births.
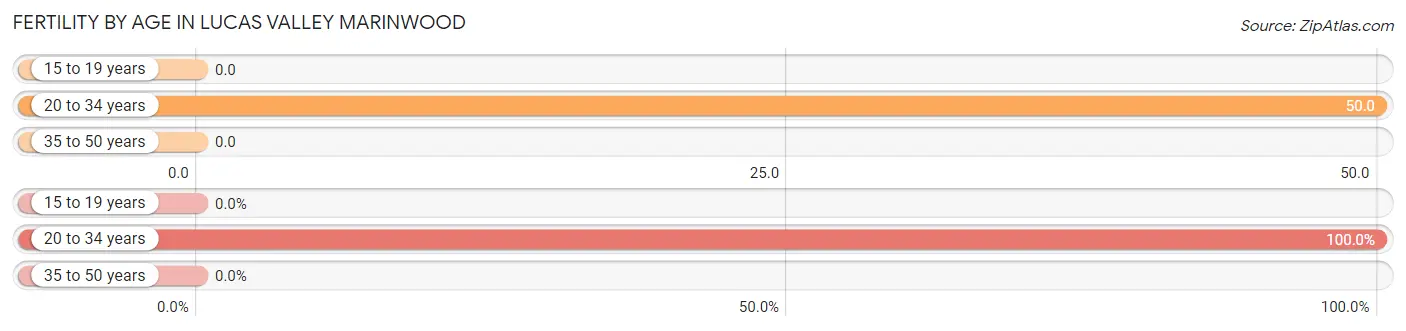
| Age Bracket | Women with Births | Births / 1,000 Women |
| 15 to 19 years | 0 (0.0%) | 0.0 |
| 20 to 34 years | 20 (100.0%) | 50.0 |
| 35 to 50 years | 0 (0.0%) | 0.0 |
| Total | 20 (100.0%) | 14.0 |
Fertility by Age by Marriage Status in Lucas Valley Marinwood
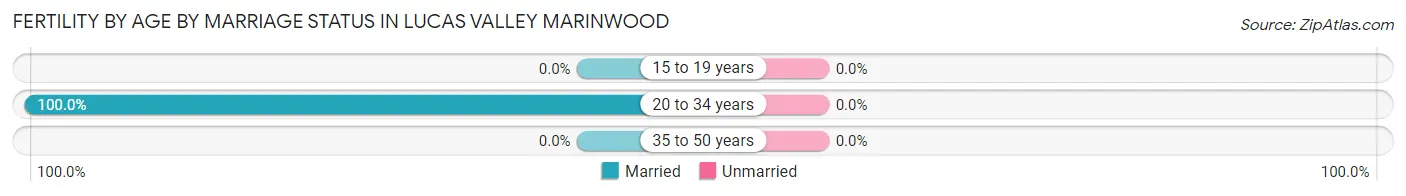
| Age Bracket | Married | Unmarried |
| 15 to 19 years | 0 (0.0%) | 0 (0.0%) |
| 20 to 34 years | 20 (100.0%) | 0 (0.0%) |
| 35 to 50 years | 0 (0.0%) | 0 (0.0%) |
| Total | 20 (100.0%) | 0 (0.0%) |
Fertility by Education in Lucas Valley Marinwood
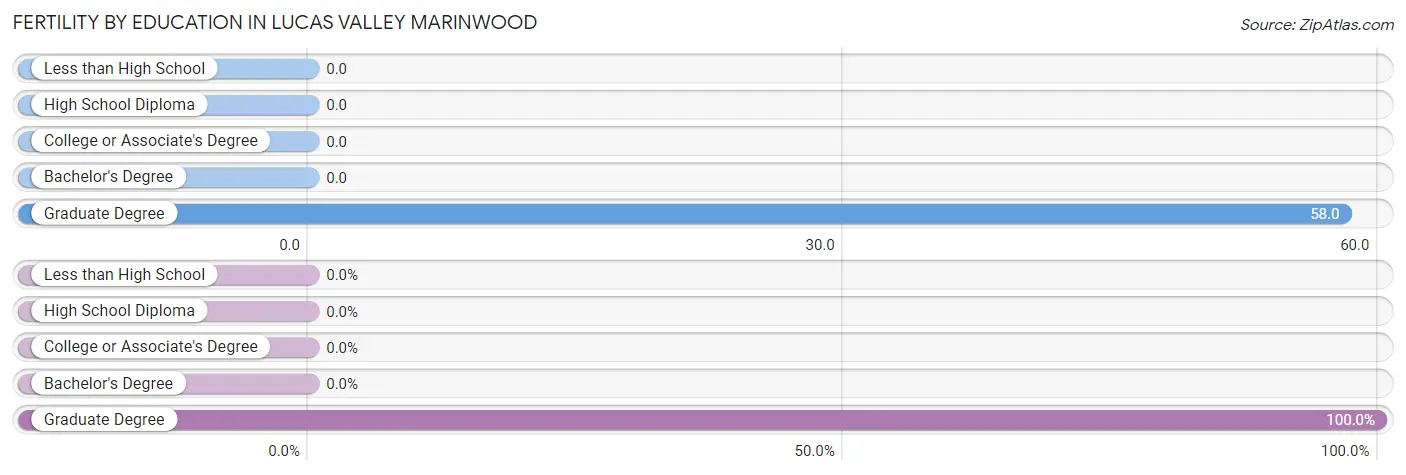
| Educational Attainment | Women with Births | Births / 1,000 Women |
| Less than High School | 0 (0.0%) | 0.0 |
| High School Diploma | 0 (0.0%) | 0.0 |
| College or Associate's Degree | 0 (0.0%) | 0.0 |
| Bachelor's Degree | 0 (0.0%) | 0.0 |
| Graduate Degree | 20 (100.0%) | 58.0 |
| Total | 20 (100.0%) | 14.0 |
Fertility by Education by Marriage Status in Lucas Valley Marinwood
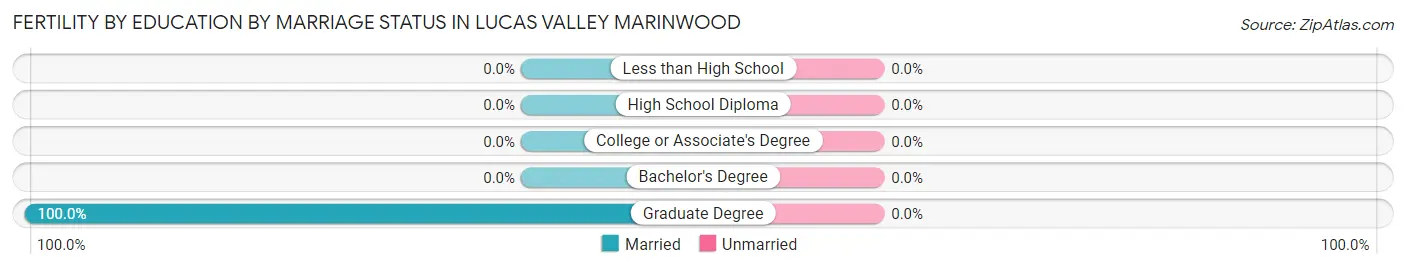
| Educational Attainment | Married | Unmarried |
| Less than High School | 0 (0.0%) | 0 (0.0%) |
| High School Diploma | 0 (0.0%) | 0 (0.0%) |
| College or Associate's Degree | 0 (0.0%) | 0 (0.0%) |
| Bachelor's Degree | 0 (0.0%) | 0 (0.0%) |
| Graduate Degree | 20 (100.0%) | 0 (0.0%) |
| Total | 20 (100.0%) | 0 (0.0%) |
Employment Characteristics in Lucas Valley Marinwood
Employment by Class of Employer in Lucas Valley Marinwood
Among the 3,157 employed individuals in Lucas Valley Marinwood, private company employees (1,705 | 54.0%), not-for-profit organizations (492 | 15.6%), and self-employed (not incorporated) (469 | 14.9%) make up the most common classes of employment.

| Employer Class | # Employees | % Employees |
| Private Company Employees | 1,705 | 54.0% |
| Self-Employed (Incorporated) | 130 | 4.1% |
| Self-Employed (Not Incorporated) | 469 | 14.9% |
| Not-for-profit Organizations | 492 | 15.6% |
| Local Government Employees | 278 | 8.8% |
| State Government Employees | 26 | 0.8% |
| Federal Government Employees | 57 | 1.8% |
| Unpaid Family Workers | 0 | 0.0% |
| Total | 3,157 | 100.0% |
Employment Status by Age in Lucas Valley Marinwood
According to the labor force statistics for Lucas Valley Marinwood, out of the total population over 16 years of age (5,303), 62.6% or 3,320 individuals are in the labor force, with 2.4% or 80 of them unemployed. The age group with the highest labor force participation rate is 25 to 29 years, with 100.0% or 160 individuals in the labor force. Within the labor force, the 20 to 24 years age range has the highest percentage of unemployed individuals, with 30.0% or 12 of them being unemployed.
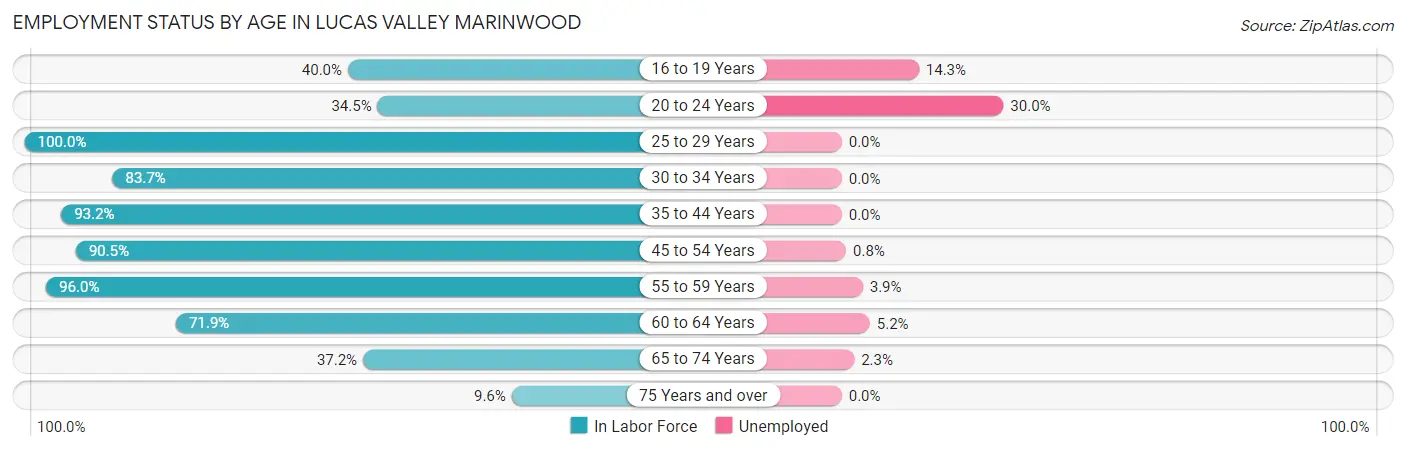
| Age Bracket | In Labor Force | Unemployed |
| 16 to 19 Years | 161 (40.0%) | 23 (14.3%) |
| 20 to 24 Years | 40 (34.5%) | 12 (30.0%) |
| 25 to 29 Years | 160 (100.0%) | 0 (0.0%) |
| 30 to 34 Years | 231 (83.7%) | 0 (0.0%) |
| 35 to 44 Years | 469 (93.2%) | 0 (0.0%) |
| 45 to 54 Years | 1,183 (90.5%) | 9 (0.8%) |
| 55 to 59 Years | 358 (96.0%) | 14 (3.9%) |
| 60 to 64 Years | 287 (71.9%) | 15 (5.2%) |
| 65 to 74 Years | 351 (37.2%) | 8 (2.3%) |
| 75 Years and over | 79 (9.6%) | 0 (0.0%) |
| Total | 3,320 (62.6%) | 80 (2.4%) |
Employment Status by Educational Attainment in Lucas Valley Marinwood
According to labor force statistics for Lucas Valley Marinwood, 89.1% of individuals (2,689) out of the total population between 25 and 64 years of age (3,018) are in the labor force, with 1.4% or 38 of them being unemployed. The group with the highest labor force participation rate are those with the educational attainment of high school diploma, with 100.0% or 162 individuals in the labor force. Within the labor force, individuals with college / associate degree education have the highest percentage of unemployment, with 7.5% or 29 of them being unemployed.
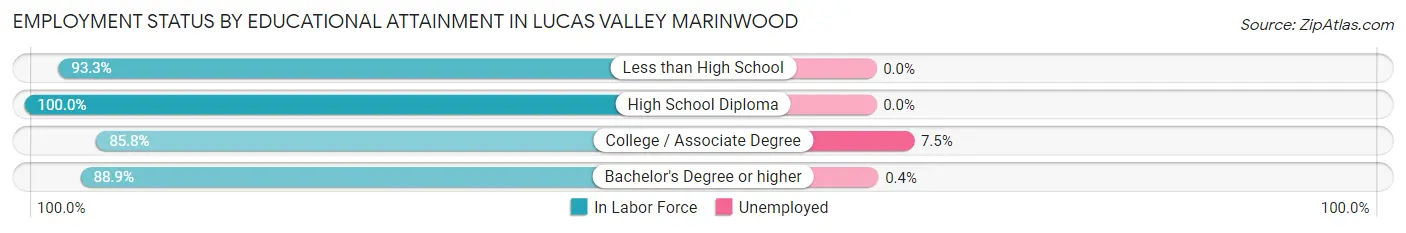
| Educational Attainment | In Labor Force | Unemployed |
| Less than High School | 14 (93.3%) | 0 (0.0%) |
| High School Diploma | 162 (100.0%) | 0 (0.0%) |
| College / Associate Degree | 388 (85.8%) | 34 (7.5%) |
| Bachelor's Degree or higher | 2,124 (88.9%) | 10 (0.4%) |
| Total | 2,689 (89.1%) | 42 (1.4%) |
Employment Occupations by Sex in Lucas Valley Marinwood
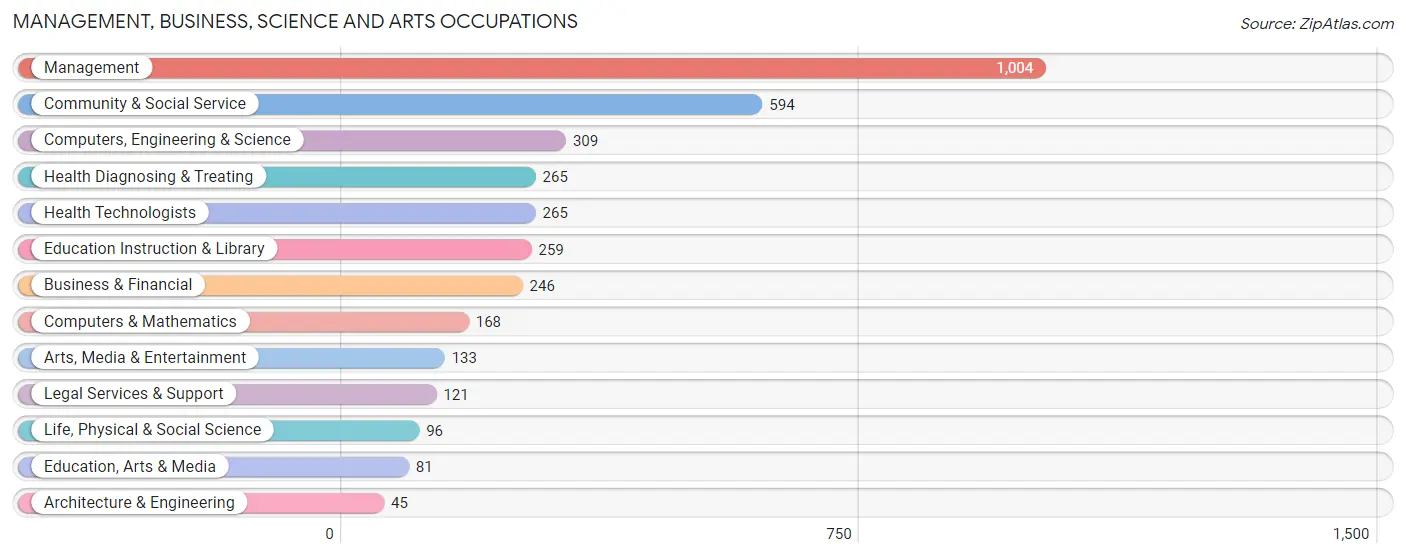
Management, Business, Science and Arts Occupations
The most common Management, Business, Science and Arts occupations in Lucas Valley Marinwood are Management (1,004 | 31.0%), Community & Social Service (594 | 18.3%), Computers, Engineering & Science (309 | 9.5%), Health Diagnosing & Treating (265 | 8.2%), and Health Technologists (265 | 8.2%).
Management, Business, Science and Arts Occupations by Sex
Within the Management, Business, Science and Arts occupations in Lucas Valley Marinwood, the most male-oriented occupations are Architecture & Engineering (100.0%), Computers & Mathematics (82.1%), and Legal Services & Support (81.0%), while the most female-oriented occupations are Health Diagnosing & Treating (83.4%), Health Technologists (83.4%), and Education Instruction & Library (81.5%).
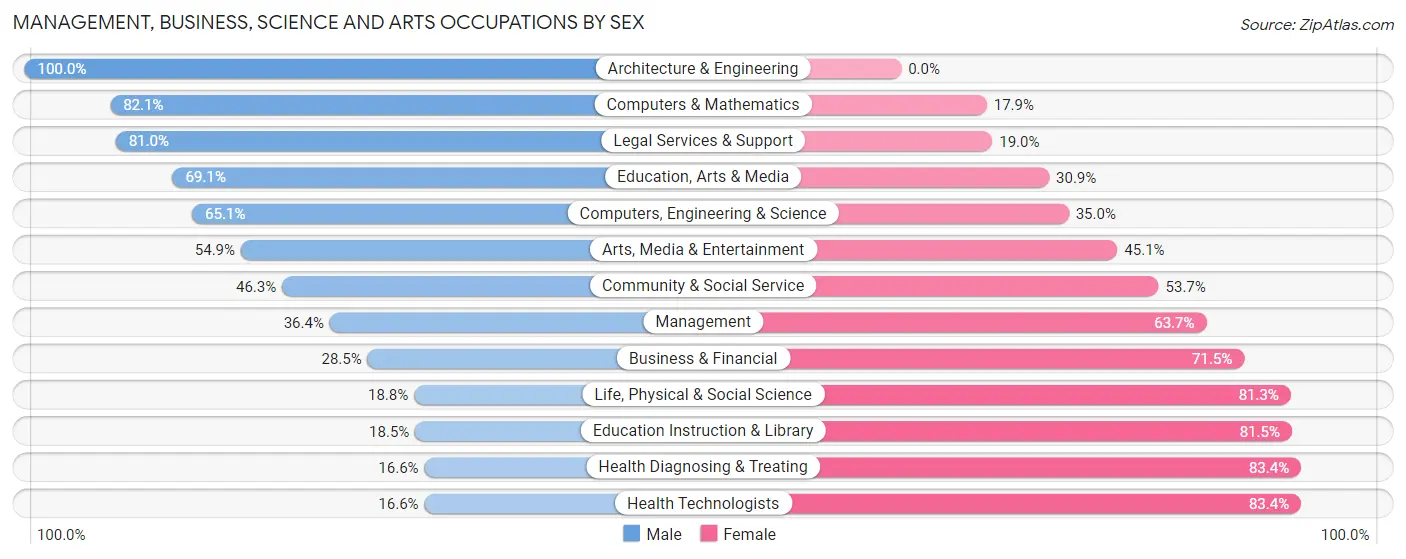
| Occupation | Male | Female |
| Management | 365 (36.3%) | 639 (63.6%) |
| Business & Financial | 70 (28.5%) | 176 (71.5%) |
| Computers, Engineering & Science | 201 (65.0%) | 108 (34.9%) |
| Computers & Mathematics | 138 (82.1%) | 30 (17.9%) |
| Architecture & Engineering | 45 (100.0%) | 0 (0.0%) |
| Life, Physical & Social Science | 18 (18.8%) | 78 (81.2%) |
| Community & Social Service | 275 (46.3%) | 319 (53.7%) |
| Education, Arts & Media | 56 (69.1%) | 25 (30.9%) |
| Legal Services & Support | 98 (81.0%) | 23 (19.0%) |
| Education Instruction & Library | 48 (18.5%) | 211 (81.5%) |
| Arts, Media & Entertainment | 73 (54.9%) | 60 (45.1%) |
| Health Diagnosing & Treating | 44 (16.6%) | 221 (83.4%) |
| Health Technologists | 44 (16.6%) | 221 (83.4%) |
| Total (Category) | 955 (39.5%) | 1,463 (60.5%) |
| Total (Overall) | 1,406 (43.4%) | 1,832 (56.6%) |
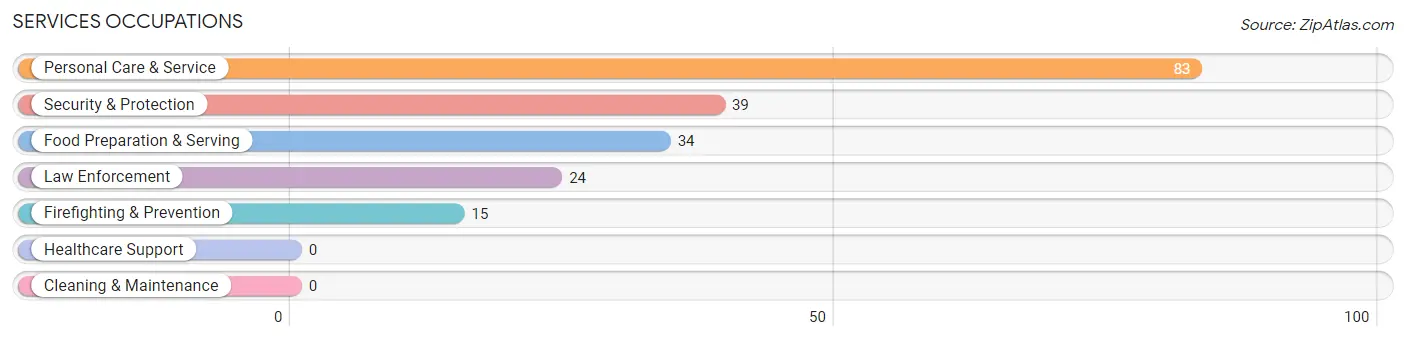
Services Occupations
The most common Services occupations in Lucas Valley Marinwood are Personal Care & Service (83 | 2.6%), Security & Protection (39 | 1.2%), Food Preparation & Serving (34 | 1.1%), Law Enforcement (24 | 0.7%), and Firefighting & Prevention (15 | 0.5%).
Services Occupations by Sex
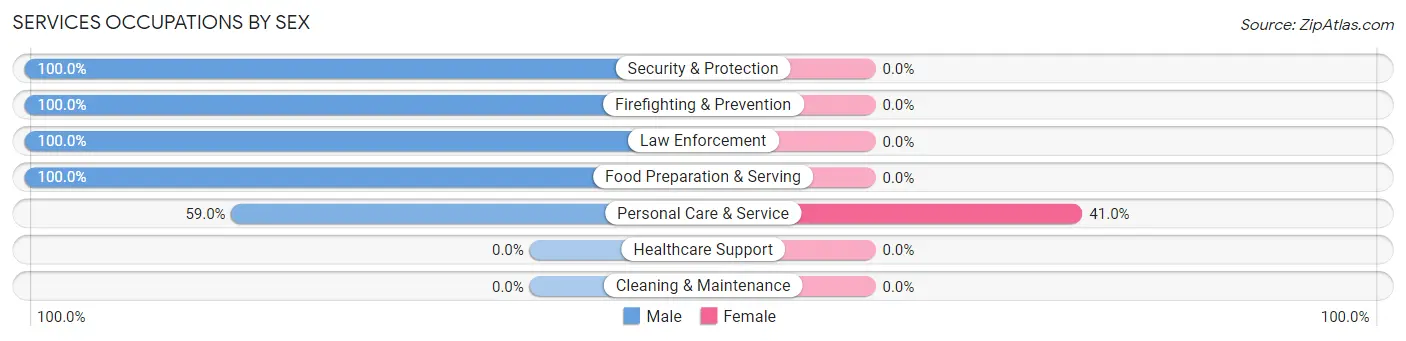
| Occupation | Male | Female |
| Healthcare Support | 0 (0.0%) | 0 (0.0%) |
| Security & Protection | 39 (100.0%) | 0 (0.0%) |
| Firefighting & Prevention | 15 (100.0%) | 0 (0.0%) |
| Law Enforcement | 24 (100.0%) | 0 (0.0%) |
| Food Preparation & Serving | 34 (100.0%) | 0 (0.0%) |
| Cleaning & Maintenance | 0 (0.0%) | 0 (0.0%) |
| Personal Care & Service | 49 (59.0%) | 34 (41.0%) |
| Total (Category) | 122 (78.2%) | 34 (21.8%) |
| Total (Overall) | 1,406 (43.4%) | 1,832 (56.6%) |
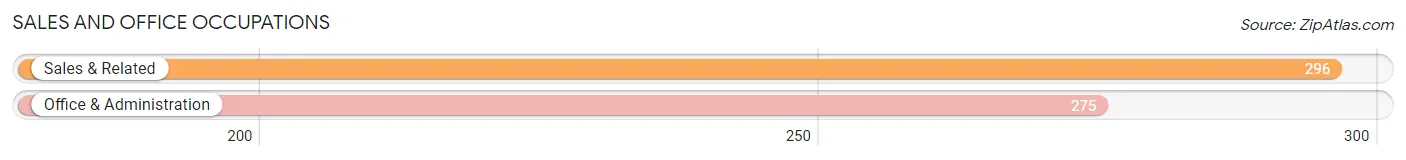
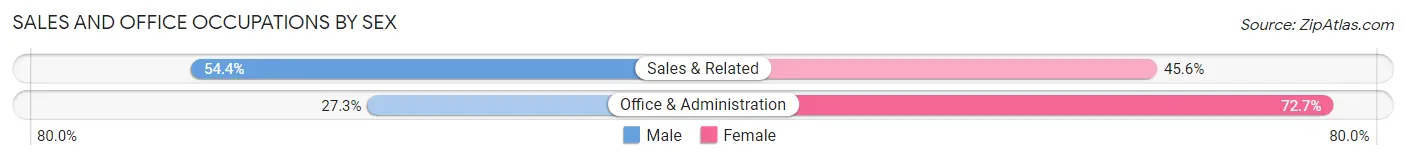
Sales and Office Occupations
The most common Sales and Office occupations in Lucas Valley Marinwood are Sales & Related (296 | 9.1%), and Office & Administration (275 | 8.5%).
Sales and Office Occupations by Sex
| Occupation | Male | Female |
| Sales & Related | 161 (54.4%) | 135 (45.6%) |
| Office & Administration | 75 (27.3%) | 200 (72.7%) |
| Total (Category) | 236 (41.3%) | 335 (58.7%) |
| Total (Overall) | 1,406 (43.4%) | 1,832 (56.6%) |
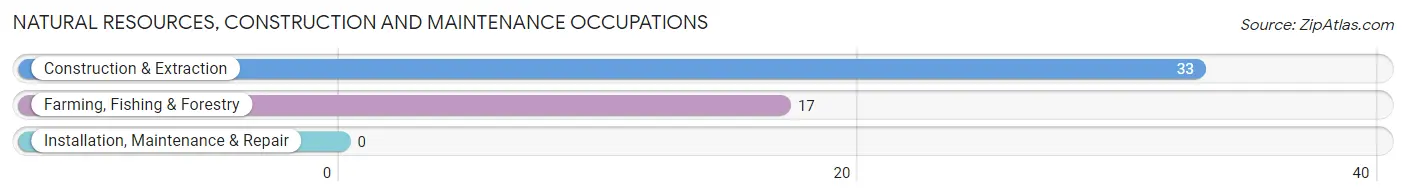
Natural Resources, Construction and Maintenance Occupations
The most common Natural Resources, Construction and Maintenance occupations in Lucas Valley Marinwood are Construction & Extraction (33 | 1.0%), and Farming, Fishing & Forestry (17 | 0.5%).
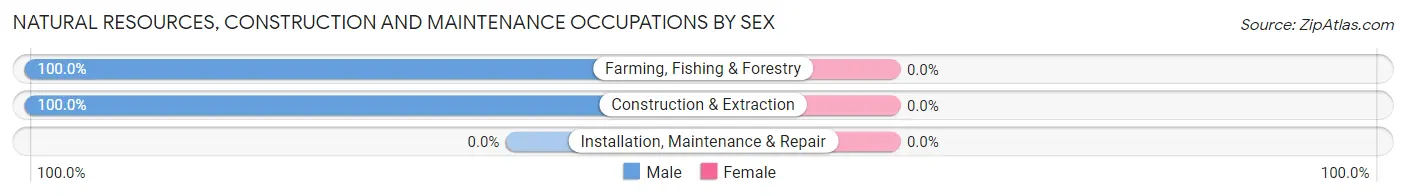
Natural Resources, Construction and Maintenance Occupations by Sex
| Occupation | Male | Female |
| Farming, Fishing & Forestry | 17 (100.0%) | 0 (0.0%) |
| Construction & Extraction | 33 (100.0%) | 0 (0.0%) |
| Installation, Maintenance & Repair | 0 (0.0%) | 0 (0.0%) |
| Total (Category) | 50 (100.0%) | 0 (0.0%) |
| Total (Overall) | 1,406 (43.4%) | 1,832 (56.6%) |
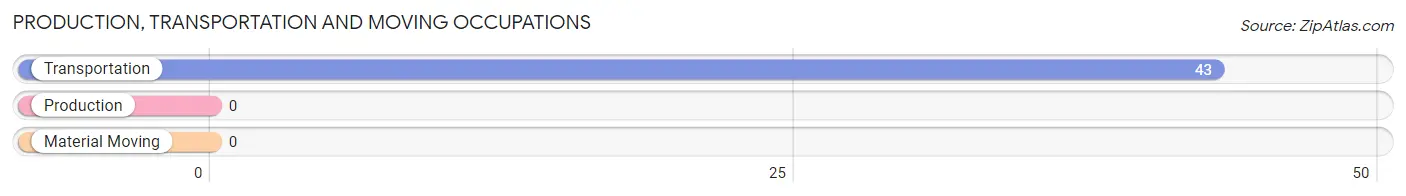
Production, Transportation and Moving Occupations
The most common Production, Transportation and Moving occupations in Lucas Valley Marinwood are , and Transportation (43 | 1.3%).
Production, Transportation and Moving Occupations by Sex
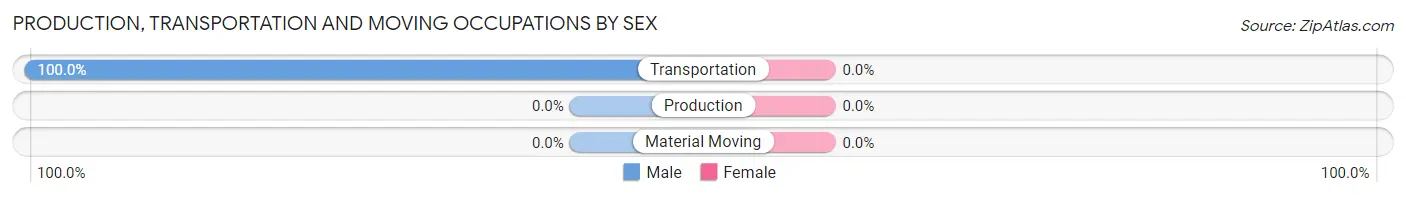
| Occupation | Male | Female |
| Production | 0 (0.0%) | 0 (0.0%) |
| Transportation | 43 (100.0%) | 0 (0.0%) |
| Material Moving | 0 (0.0%) | 0 (0.0%) |
| Total (Category) | 43 (100.0%) | 0 (0.0%) |
| Total (Overall) | 1,406 (43.4%) | 1,832 (56.6%) |
Employment Industries by Sex in Lucas Valley Marinwood
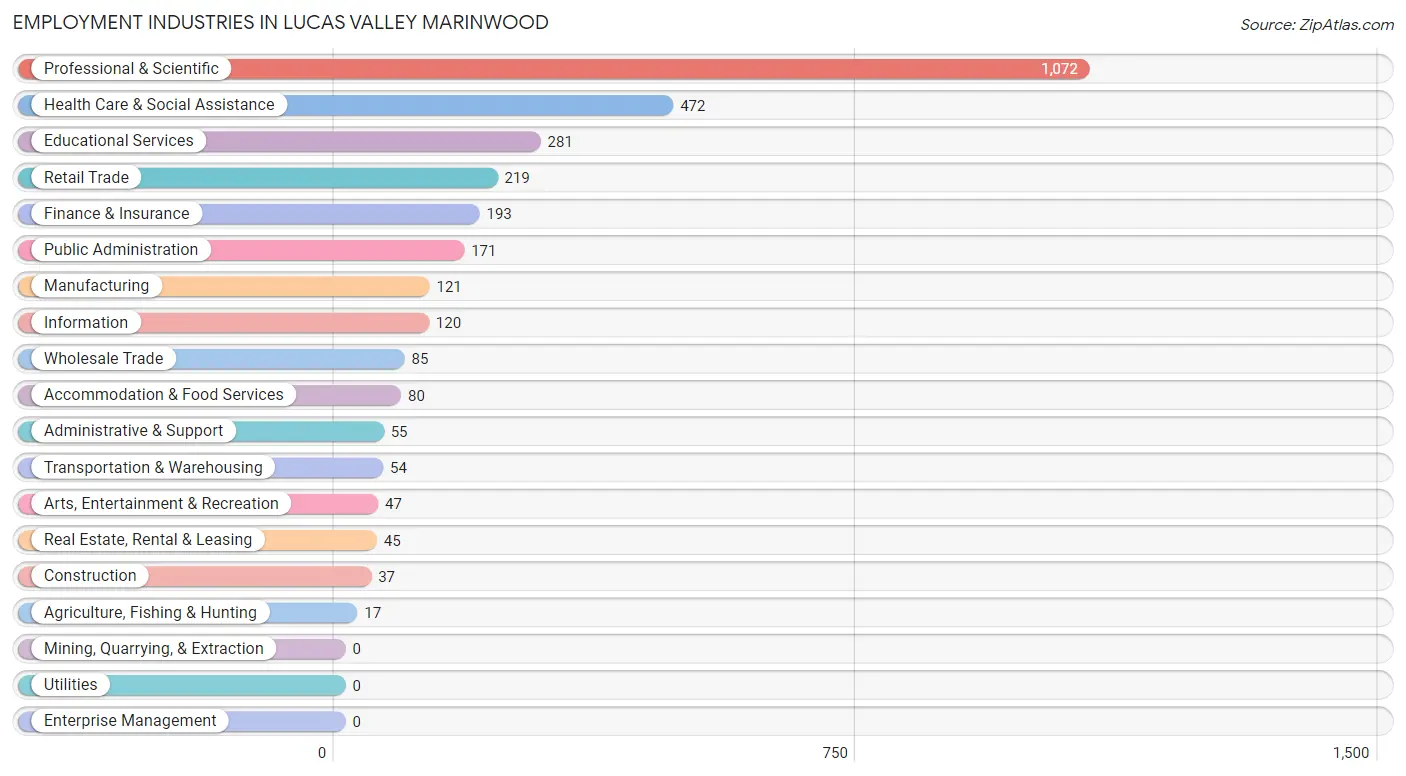
Employment Industries in Lucas Valley Marinwood
The major employment industries in Lucas Valley Marinwood include Professional & Scientific (1,072 | 33.1%), Health Care & Social Assistance (472 | 14.6%), Educational Services (281 | 8.7%), Retail Trade (219 | 6.8%), and Finance & Insurance (193 | 6.0%).
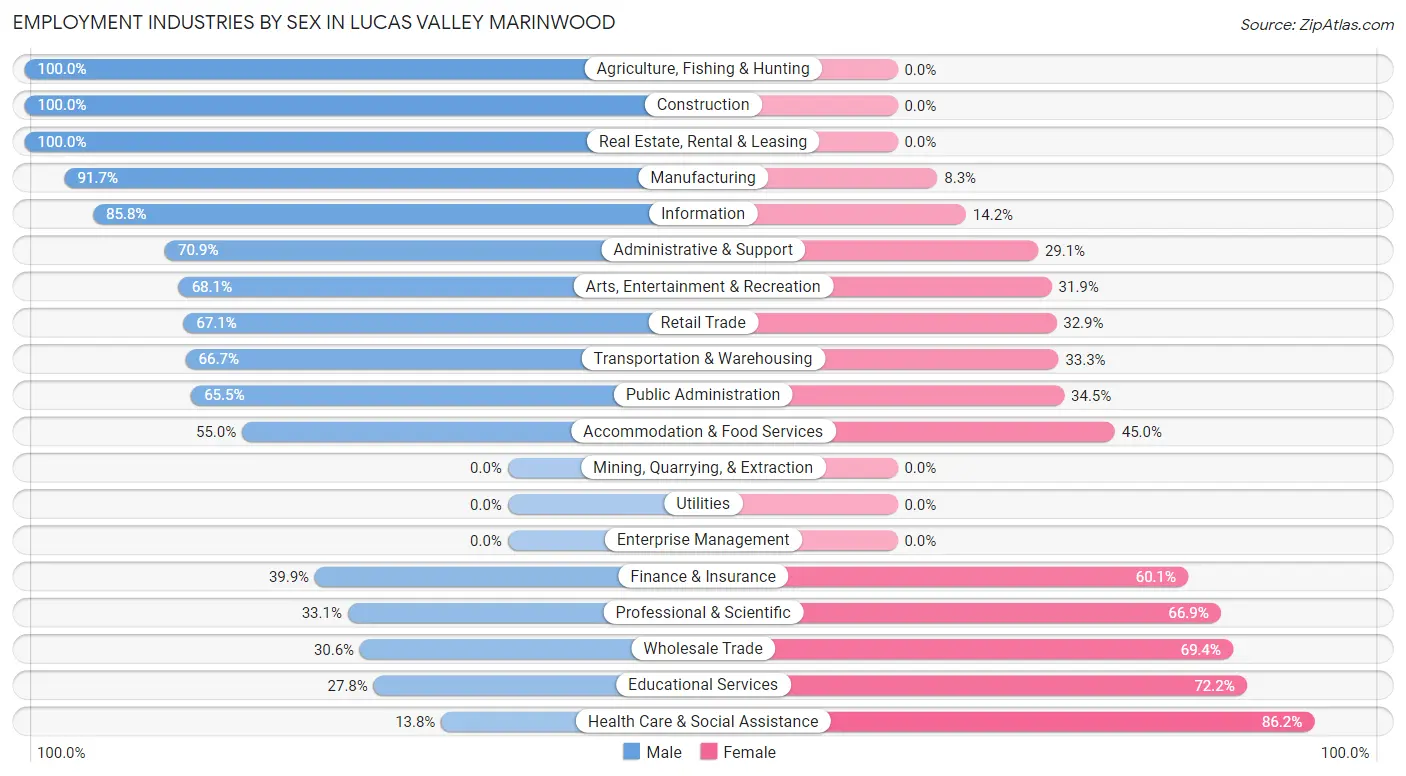
Employment Industries by Sex in Lucas Valley Marinwood
The Lucas Valley Marinwood industries that see more men than women are Agriculture, Fishing & Hunting (100.0%), Construction (100.0%), and Real Estate, Rental & Leasing (100.0%), whereas the industries that tend to have a higher number of women are Health Care & Social Assistance (86.2%), Educational Services (72.2%), and Wholesale Trade (69.4%).
| Industry | Male | Female |
| Agriculture, Fishing & Hunting | 17 (100.0%) | 0 (0.0%) |
| Mining, Quarrying, & Extraction | 0 (0.0%) | 0 (0.0%) |
| Construction | 37 (100.0%) | 0 (0.0%) |
| Manufacturing | 111 (91.7%) | 10 (8.3%) |
| Wholesale Trade | 26 (30.6%) | 59 (69.4%) |
| Retail Trade | 147 (67.1%) | 72 (32.9%) |
| Transportation & Warehousing | 36 (66.7%) | 18 (33.3%) |
| Utilities | 0 (0.0%) | 0 (0.0%) |
| Information | 103 (85.8%) | 17 (14.2%) |
| Finance & Insurance | 77 (39.9%) | 116 (60.1%) |
| Real Estate, Rental & Leasing | 45 (100.0%) | 0 (0.0%) |
| Professional & Scientific | 355 (33.1%) | 717 (66.9%) |
| Enterprise Management | 0 (0.0%) | 0 (0.0%) |
| Administrative & Support | 39 (70.9%) | 16 (29.1%) |
| Educational Services | 78 (27.8%) | 203 (72.2%) |
| Health Care & Social Assistance | 65 (13.8%) | 407 (86.2%) |
| Arts, Entertainment & Recreation | 32 (68.1%) | 15 (31.9%) |
| Accommodation & Food Services | 44 (55.0%) | 36 (45.0%) |
| Public Administration | 112 (65.5%) | 59 (34.5%) |
| Total | 1,406 (43.4%) | 1,832 (56.6%) |
Education in Lucas Valley Marinwood
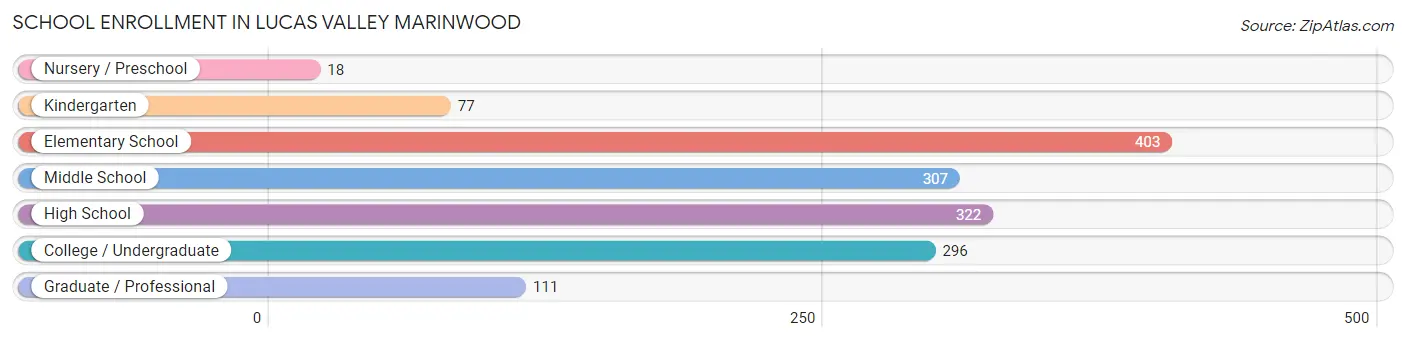
School Enrollment in Lucas Valley Marinwood
The most common levels of schooling among the 1,534 students in Lucas Valley Marinwood are elementary school (403 | 26.3%), high school (322 | 21.0%), and middle school (307 | 20.0%).
| School Level | # Students | % Students |
| Nursery / Preschool | 18 | 1.2% |
| Kindergarten | 77 | 5.0% |
| Elementary School | 403 | 26.3% |
| Middle School | 307 | 20.0% |
| High School | 322 | 21.0% |
| College / Undergraduate | 296 | 19.3% |
| Graduate / Professional | 111 | 7.2% |
| Total | 1,534 | 100.0% |
School Enrollment by Age by Funding Source in Lucas Valley Marinwood
Out of a total of 1,534 students who are enrolled in schools in Lucas Valley Marinwood, 411 (26.8%) attend a private institution, while the remaining 1,123 (73.2%) are enrolled in public schools. The age group of 35 years and over has the highest likelihood of being enrolled in private schools, with 101 (82.8% in the age bracket) enrolled. Conversely, the age group of 10 to 14 year olds has the lowest likelihood of being enrolled in a private school, with 415 (90.0% in the age bracket) attending a public institution.
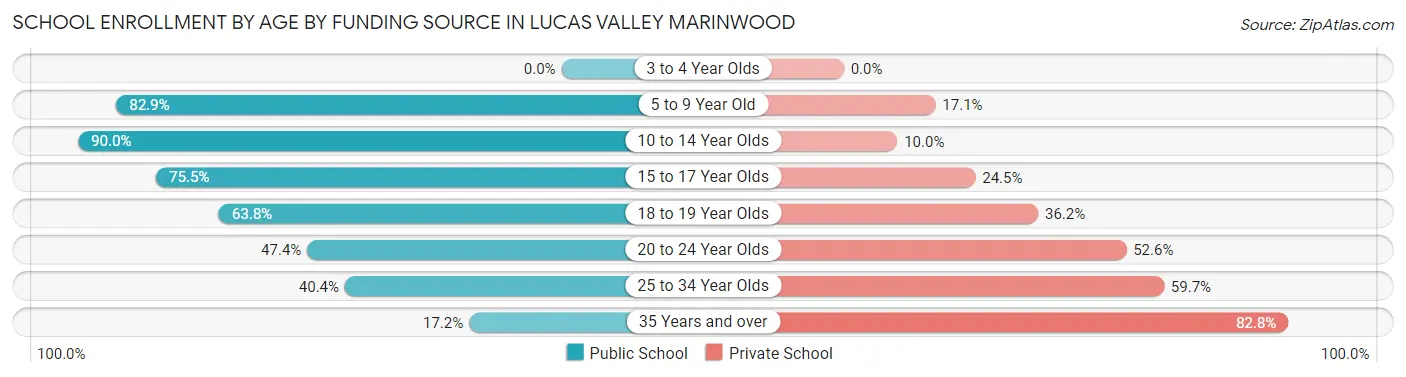
| Age Bracket | Public School | Private School |
| 3 to 4 Year Olds | 0 (0.0%) | 0 (0.0%) |
| 5 to 9 Year Old | 330 (82.9%) | 68 (17.1%) |
| 10 to 14 Year Olds | 415 (90.0%) | 46 (10.0%) |
| 15 to 17 Year Olds | 194 (75.5%) | 63 (24.5%) |
| 18 to 19 Year Olds | 104 (63.8%) | 59 (36.2%) |
| 20 to 24 Year Olds | 36 (47.4%) | 40 (52.6%) |
| 25 to 34 Year Olds | 23 (40.4%) | 34 (59.7%) |
| 35 Years and over | 21 (17.2%) | 101 (82.8%) |
| Total | 1,123 (73.2%) | 411 (26.8%) |
Educational Attainment by Field of Study in Lucas Valley Marinwood
Business (492 | 12.8%), liberal arts & history (473 | 12.3%), social sciences (445 | 11.6%), literature & languages (362 | 9.4%), and science & technology (297 | 7.7%) are the most common fields of study among 3,842 individuals in Lucas Valley Marinwood who have obtained a bachelor's degree or higher.
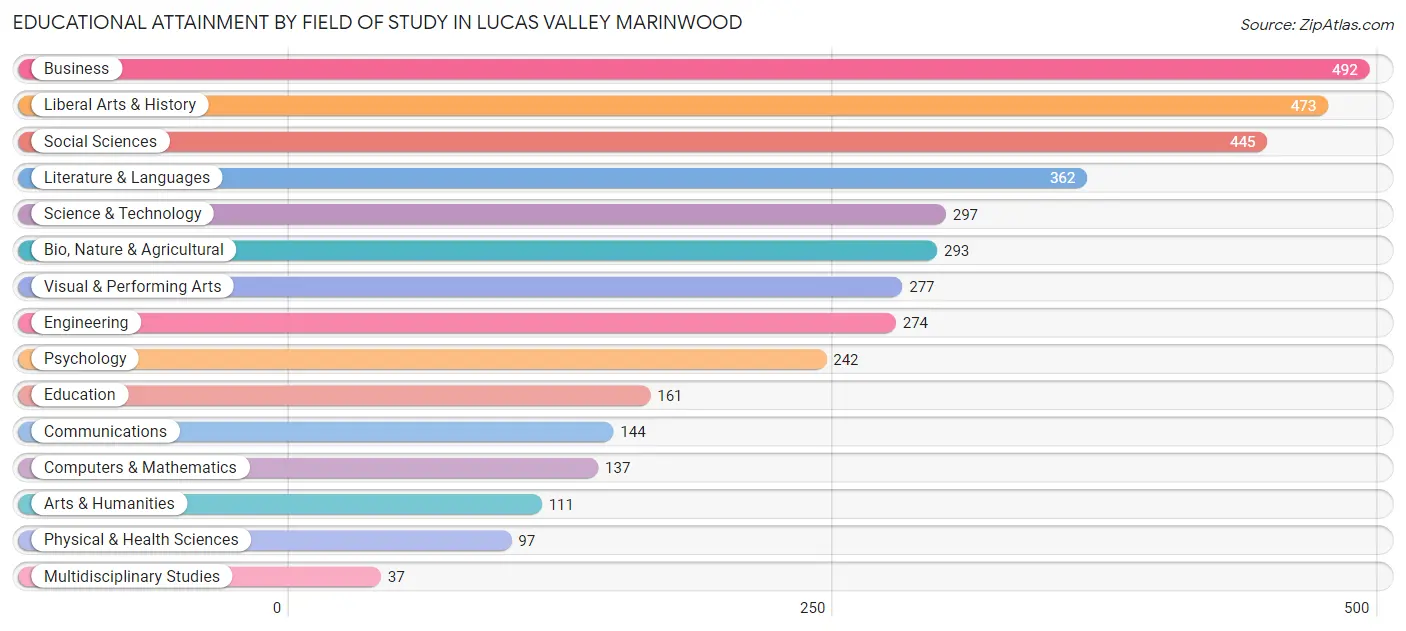
| Field of Study | # Graduates | % Graduates |
| Computers & Mathematics | 137 | 3.6% |
| Bio, Nature & Agricultural | 293 | 7.6% |
| Physical & Health Sciences | 97 | 2.5% |
| Psychology | 242 | 6.3% |
| Social Sciences | 445 | 11.6% |
| Engineering | 274 | 7.1% |
| Multidisciplinary Studies | 37 | 1.0% |
| Science & Technology | 297 | 7.7% |
| Business | 492 | 12.8% |
| Education | 161 | 4.2% |
| Literature & Languages | 362 | 9.4% |
| Liberal Arts & History | 473 | 12.3% |
| Visual & Performing Arts | 277 | 7.2% |
| Communications | 144 | 3.7% |
| Arts & Humanities | 111 | 2.9% |
| Total | 3,842 | 100.0% |
Transportation & Commute in Lucas Valley Marinwood
Vehicle Availability by Sex in Lucas Valley Marinwood
The most prevalent vehicle ownership categories in Lucas Valley Marinwood are males with 2 vehicles (653, accounting for 47.2%) and females with 2 vehicles (960, making up 38.5%).
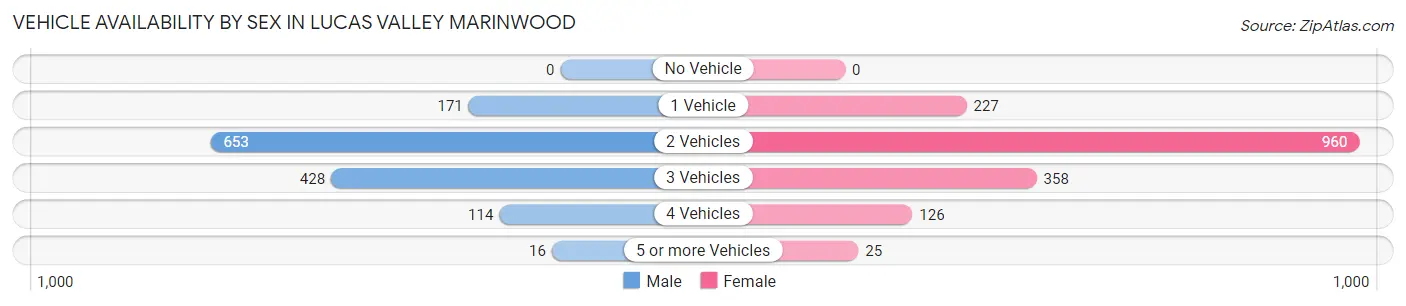
| Vehicles Available | Male | Female |
| No Vehicle | 0 (0.0%) | 0 (0.0%) |
| 1 Vehicle | 171 (12.4%) | 227 (13.4%) |
| 2 Vehicles | 653 (47.2%) | 960 (56.6%) |
| 3 Vehicles | 428 (31.0%) | 358 (21.1%) |
| 4 Vehicles | 114 (8.3%) | 126 (7.4%) |
| 5 or more Vehicles | 16 (1.2%) | 25 (1.5%) |
| Total | 1,382 (100.0%) | 1,696 (100.0%) |
Commute Time in Lucas Valley Marinwood
The most frequently occuring commute durations in Lucas Valley Marinwood are 15 to 19 minutes (319 commuters, 14.3%), 10 to 14 minutes (301 commuters, 13.5%), and less than 5 minutes (265 commuters, 11.9%).
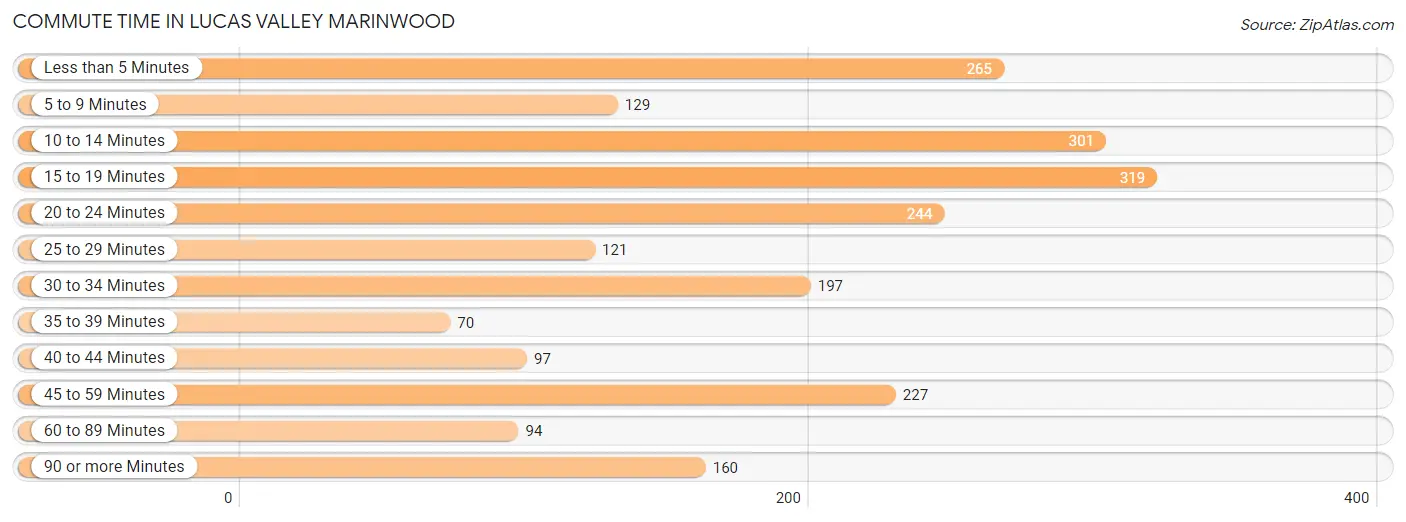
| Commute Time | # Commuters | % Commuters |
| Less than 5 Minutes | 265 | 11.9% |
| 5 to 9 Minutes | 129 | 5.8% |
| 10 to 14 Minutes | 301 | 13.5% |
| 15 to 19 Minutes | 319 | 14.3% |
| 20 to 24 Minutes | 244 | 11.0% |
| 25 to 29 Minutes | 121 | 5.4% |
| 30 to 34 Minutes | 197 | 8.9% |
| 35 to 39 Minutes | 70 | 3.2% |
| 40 to 44 Minutes | 97 | 4.4% |
| 45 to 59 Minutes | 227 | 10.2% |
| 60 to 89 Minutes | 94 | 4.2% |
| 90 or more Minutes | 160 | 7.2% |
Commute Time by Sex in Lucas Valley Marinwood
The most common commute times in Lucas Valley Marinwood are 10 to 14 minutes (253 commuters, 25.1%) for males and 15 to 19 minutes (253 commuters, 20.8%) for females.
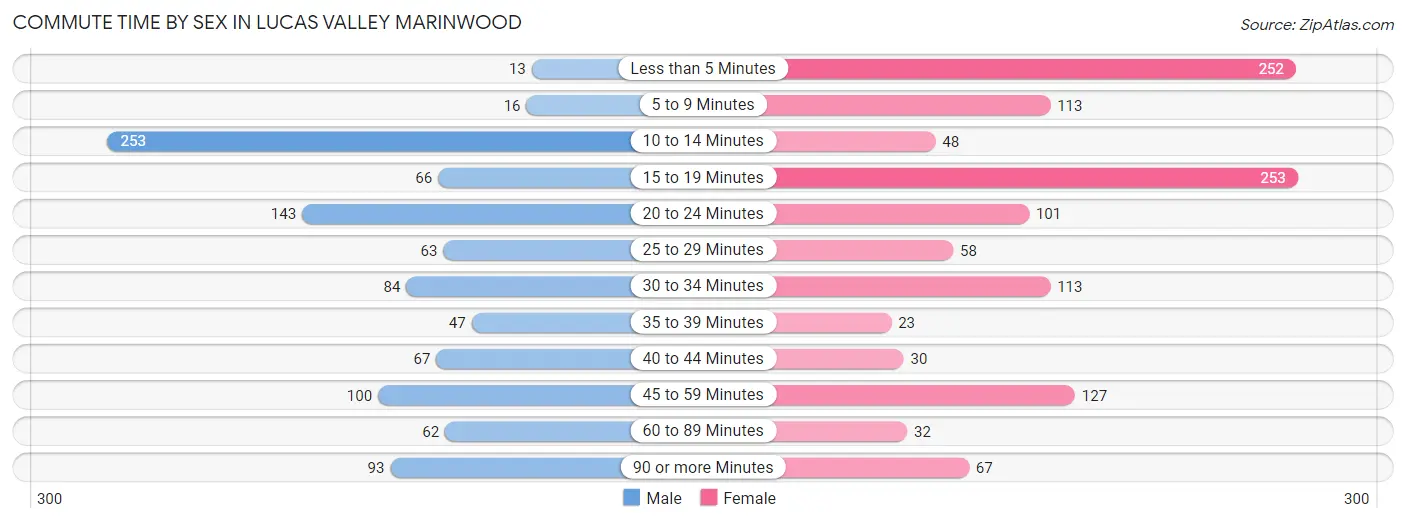
| Commute Time | Male | Female |
| Less than 5 Minutes | 13 (1.3%) | 252 (20.7%) |
| 5 to 9 Minutes | 16 (1.6%) | 113 (9.3%) |
| 10 to 14 Minutes | 253 (25.1%) | 48 (3.9%) |
| 15 to 19 Minutes | 66 (6.6%) | 253 (20.8%) |
| 20 to 24 Minutes | 143 (14.2%) | 101 (8.3%) |
| 25 to 29 Minutes | 63 (6.3%) | 58 (4.8%) |
| 30 to 34 Minutes | 84 (8.3%) | 113 (9.3%) |
| 35 to 39 Minutes | 47 (4.7%) | 23 (1.9%) |
| 40 to 44 Minutes | 67 (6.7%) | 30 (2.5%) |
| 45 to 59 Minutes | 100 (9.9%) | 127 (10.4%) |
| 60 to 89 Minutes | 62 (6.2%) | 32 (2.6%) |
| 90 or more Minutes | 93 (9.2%) | 67 (5.5%) |
Time of Departure to Work by Sex in Lucas Valley Marinwood
The most frequent times of departure to work in Lucas Valley Marinwood are 7:30 AM to 7:59 AM (214, 21.2%) for males and 4:00 PM to 11:59 PM (209, 17.2%) for females.
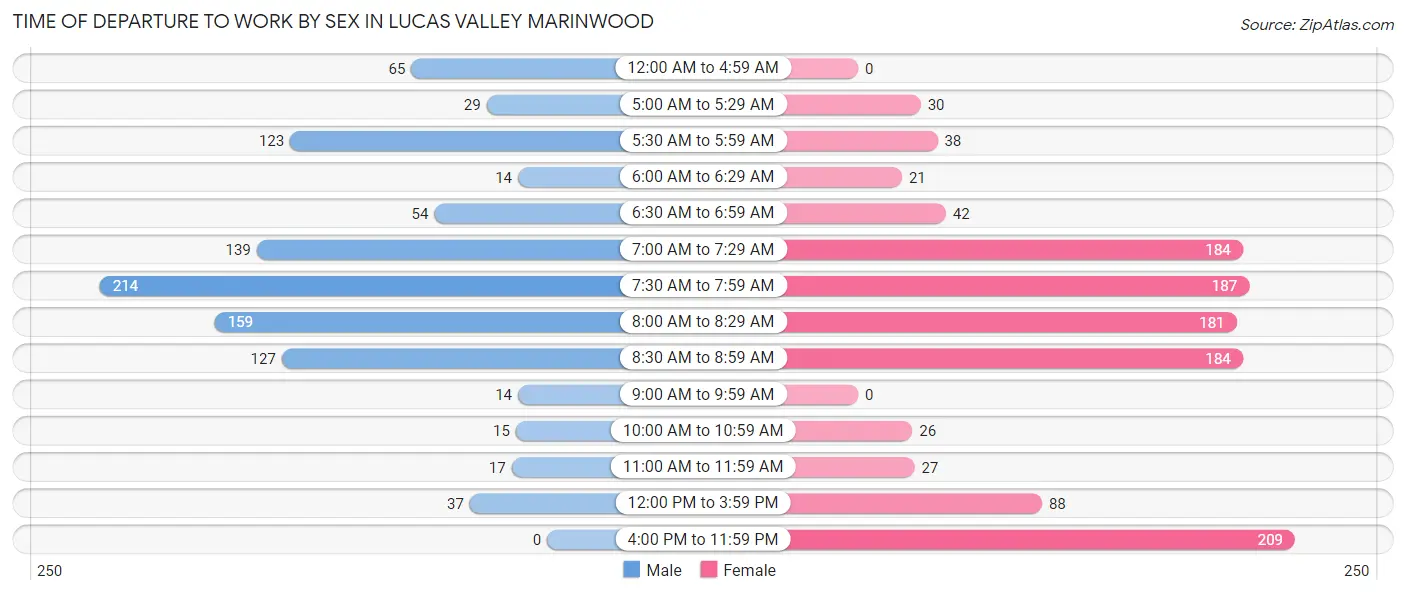
| Time of Departure | Male | Female |
| 12:00 AM to 4:59 AM | 65 (6.5%) | 0 (0.0%) |
| 5:00 AM to 5:29 AM | 29 (2.9%) | 30 (2.5%) |
| 5:30 AM to 5:59 AM | 123 (12.2%) | 38 (3.1%) |
| 6:00 AM to 6:29 AM | 14 (1.4%) | 21 (1.7%) |
| 6:30 AM to 6:59 AM | 54 (5.4%) | 42 (3.5%) |
| 7:00 AM to 7:29 AM | 139 (13.8%) | 184 (15.1%) |
| 7:30 AM to 7:59 AM | 214 (21.2%) | 187 (15.4%) |
| 8:00 AM to 8:29 AM | 159 (15.8%) | 181 (14.9%) |
| 8:30 AM to 8:59 AM | 127 (12.6%) | 184 (15.1%) |
| 9:00 AM to 9:59 AM | 14 (1.4%) | 0 (0.0%) |
| 10:00 AM to 10:59 AM | 15 (1.5%) | 26 (2.1%) |
| 11:00 AM to 11:59 AM | 17 (1.7%) | 27 (2.2%) |
| 12:00 PM to 3:59 PM | 37 (3.7%) | 88 (7.2%) |
| 4:00 PM to 11:59 PM | 0 (0.0%) | 209 (17.2%) |
| Total | 1,007 (100.0%) | 1,217 (100.0%) |
Housing Occupancy in Lucas Valley Marinwood
Occupancy by Ownership in Lucas Valley Marinwood
Of the total 2,420 dwellings in Lucas Valley Marinwood, owner-occupied units account for 2,196 (90.7%), while renter-occupied units make up 224 (9.3%).
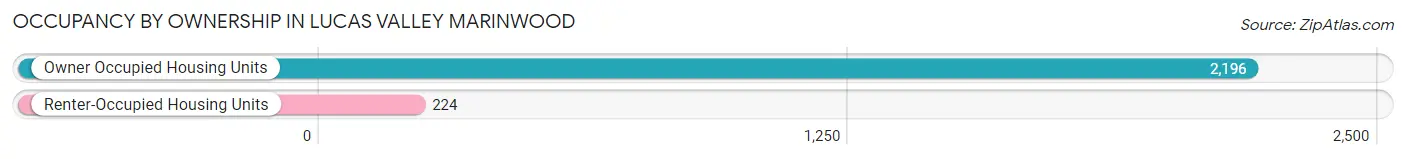
| Occupancy | # Housing Units | % Housing Units |
| Owner Occupied Housing Units | 2,196 | 90.7% |
| Renter-Occupied Housing Units | 224 | 9.3% |
| Total Occupied Housing Units | 2,420 | 100.0% |
Occupancy by Household Size in Lucas Valley Marinwood
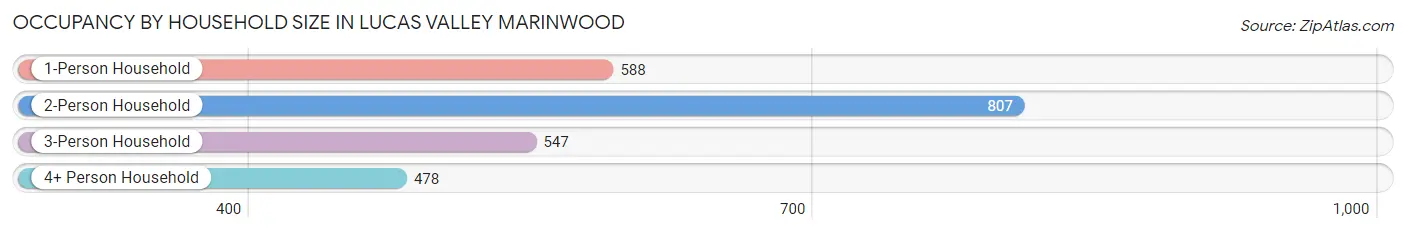
| Household Size | # Housing Units | % Housing Units |
| 1-Person Household | 588 | 24.3% |
| 2-Person Household | 807 | 33.4% |
| 3-Person Household | 547 | 22.6% |
| 4+ Person Household | 478 | 19.8% |
| Total Housing Units | 2,420 | 100.0% |
Occupancy by Ownership by Household Size in Lucas Valley Marinwood
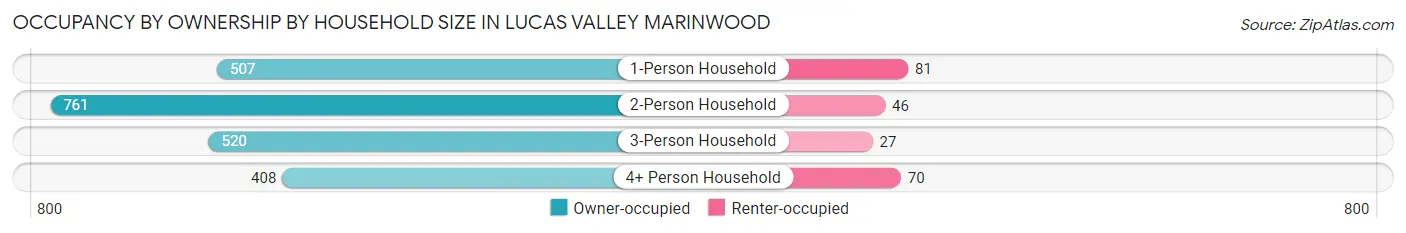
| Household Size | Owner-occupied | Renter-occupied |
| 1-Person Household | 507 (86.2%) | 81 (13.8%) |
| 2-Person Household | 761 (94.3%) | 46 (5.7%) |
| 3-Person Household | 520 (95.1%) | 27 (4.9%) |
| 4+ Person Household | 408 (85.4%) | 70 (14.6%) |
| Total Housing Units | 2,196 (90.7%) | 224 (9.3%) |
Occupancy by Educational Attainment in Lucas Valley Marinwood
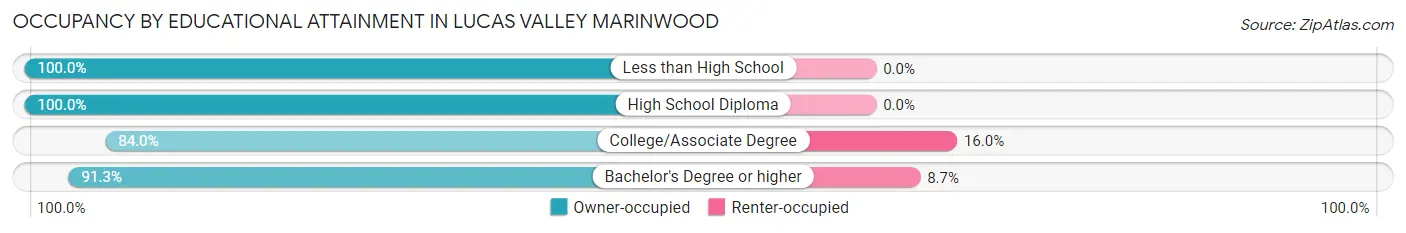
| Household Size | Owner-occupied | Renter-occupied |
| Less than High School | 64 (100.0%) | 0 (0.0%) |
| High School Diploma | 155 (100.0%) | 0 (0.0%) |
| College/Associate Degree | 367 (84.0%) | 70 (16.0%) |
| Bachelor's Degree or higher | 1,610 (91.3%) | 154 (8.7%) |
Occupancy by Age of Householder in Lucas Valley Marinwood
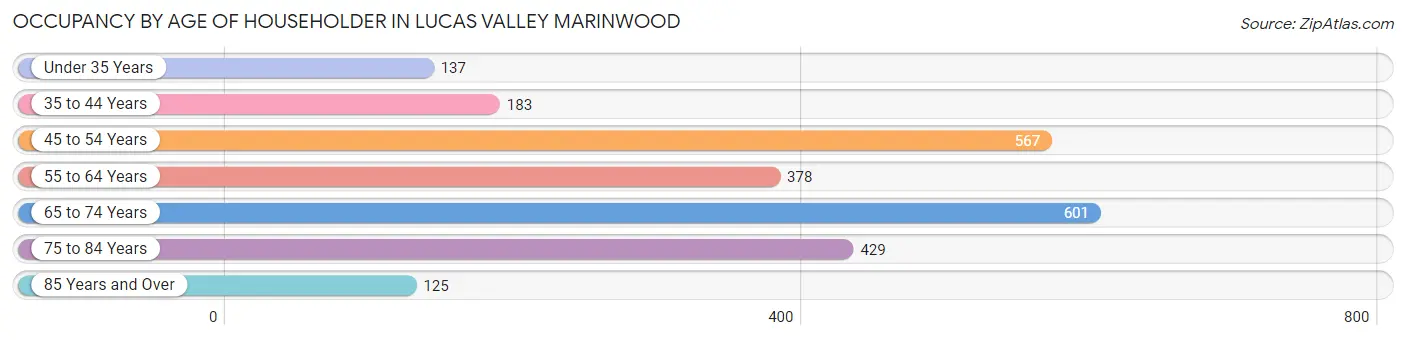
| Age Bracket | # Households | % Households |
| Under 35 Years | 137 | 5.7% |
| 35 to 44 Years | 183 | 7.6% |
| 45 to 54 Years | 567 | 23.4% |
| 55 to 64 Years | 378 | 15.6% |
| 65 to 74 Years | 601 | 24.8% |
| 75 to 84 Years | 429 | 17.7% |
| 85 Years and Over | 125 | 5.2% |
| Total | 2,420 | 100.0% |
Housing Finances in Lucas Valley Marinwood
Median Income by Occupancy in Lucas Valley Marinwood
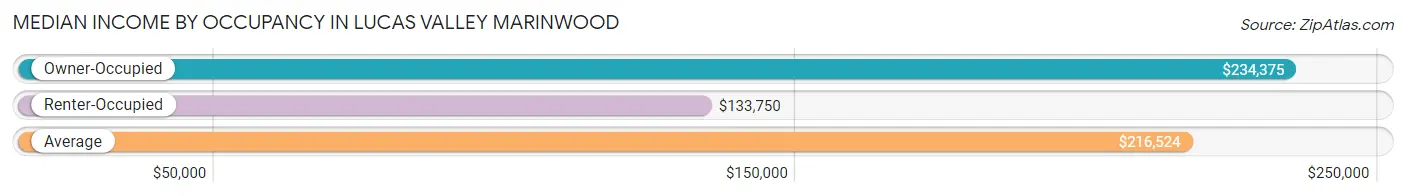
| Occupancy Type | # Households | Median Income |
| Owner-Occupied | 2,196 (90.7%) | $234,375 |
| Renter-Occupied | 224 (9.3%) | $133,750 |
| Average | 2,420 (100.0%) | $216,524 |
Occupancy by Householder Income Bracket in Lucas Valley Marinwood
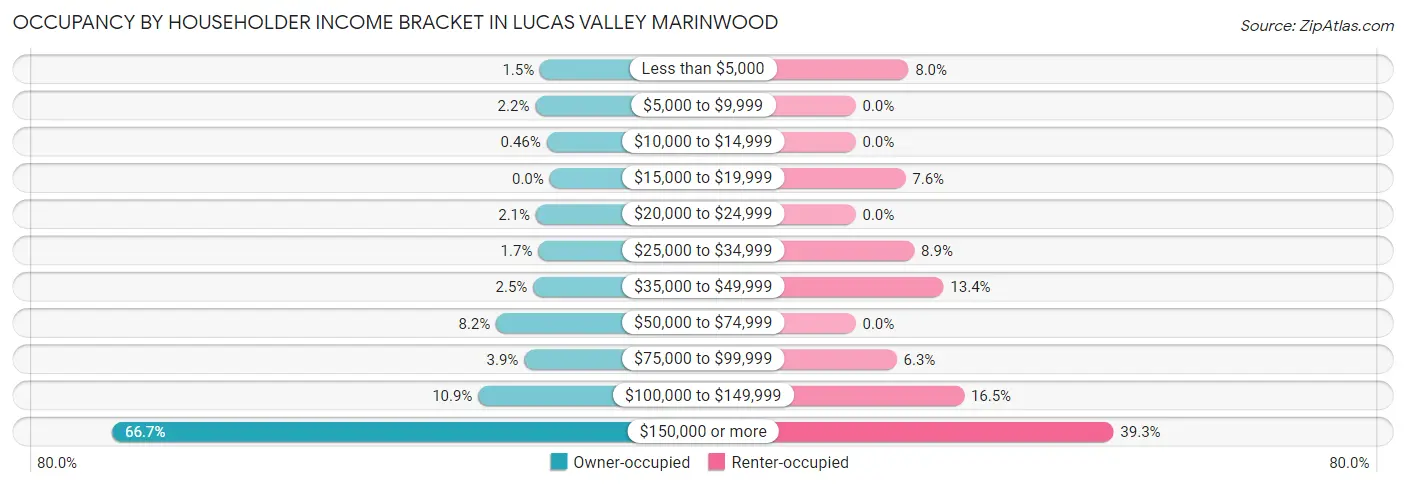
| Income Bracket | Owner-occupied | Renter-occupied |
| Less than $5,000 | 32 (1.5%) | 18 (8.0%) |
| $5,000 to $9,999 | 48 (2.2%) | 0 (0.0%) |
| $10,000 to $14,999 | 10 (0.5%) | 0 (0.0%) |
| $15,000 to $19,999 | 0 (0.0%) | 17 (7.6%) |
| $20,000 to $24,999 | 46 (2.1%) | 0 (0.0%) |
| $25,000 to $34,999 | 38 (1.7%) | 20 (8.9%) |
| $35,000 to $49,999 | 55 (2.5%) | 30 (13.4%) |
| $50,000 to $74,999 | 179 (8.2%) | 0 (0.0%) |
| $75,000 to $99,999 | 85 (3.9%) | 14 (6.2%) |
| $100,000 to $149,999 | 239 (10.9%) | 37 (16.5%) |
| $150,000 or more | 1,464 (66.7%) | 88 (39.3%) |
| Total | 2,196 (100.0%) | 224 (100.0%) |
Monthly Housing Cost Tiers in Lucas Valley Marinwood
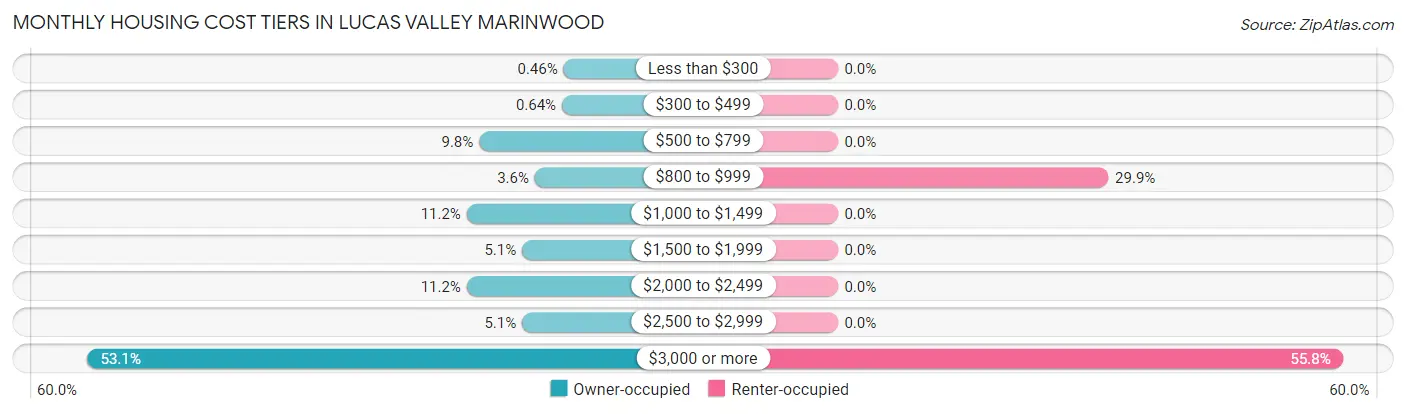
| Monthly Cost | Owner-occupied | Renter-occupied |
| Less than $300 | 10 (0.5%) | 0 (0.0%) |
| $300 to $499 | 14 (0.6%) | 0 (0.0%) |
| $500 to $799 | 215 (9.8%) | 0 (0.0%) |
| $800 to $999 | 80 (3.6%) | 67 (29.9%) |
| $1,000 to $1,499 | 245 (11.2%) | 0 (0.0%) |
| $1,500 to $1,999 | 111 (5.1%) | 0 (0.0%) |
| $2,000 to $2,499 | 245 (11.2%) | 0 (0.0%) |
| $2,500 to $2,999 | 111 (5.1%) | 0 (0.0%) |
| $3,000 or more | 1,165 (53.0%) | 125 (55.8%) |
| Total | 2,196 (100.0%) | 224 (100.0%) |
Physical Housing Characteristics in Lucas Valley Marinwood
Housing Structures in Lucas Valley Marinwood
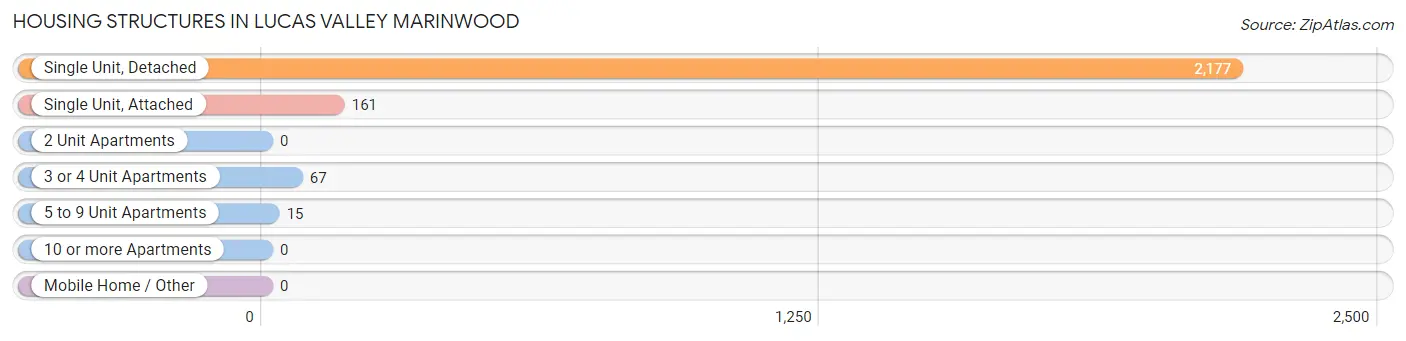
| Structure Type | # Housing Units | % Housing Units |
| Single Unit, Detached | 2,177 | 90.0% |
| Single Unit, Attached | 161 | 6.7% |
| 2 Unit Apartments | 0 | 0.0% |
| 3 or 4 Unit Apartments | 67 | 2.8% |
| 5 to 9 Unit Apartments | 15 | 0.6% |
| 10 or more Apartments | 0 | 0.0% |
| Mobile Home / Other | 0 | 0.0% |
| Total | 2,420 | 100.0% |
Housing Structures by Occupancy in Lucas Valley Marinwood
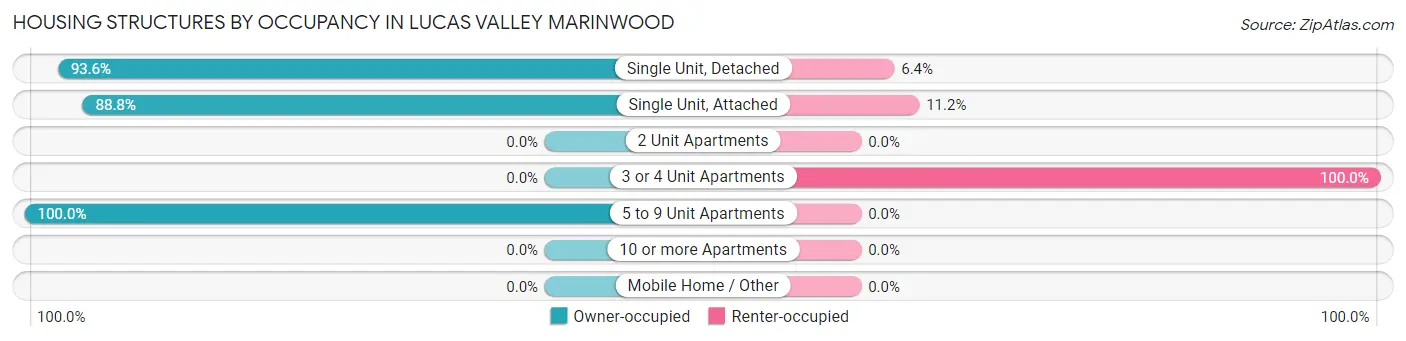
| Structure Type | Owner-occupied | Renter-occupied |
| Single Unit, Detached | 2,038 (93.6%) | 139 (6.4%) |
| Single Unit, Attached | 143 (88.8%) | 18 (11.2%) |
| 2 Unit Apartments | 0 (0.0%) | 0 (0.0%) |
| 3 or 4 Unit Apartments | 0 (0.0%) | 67 (100.0%) |
| 5 to 9 Unit Apartments | 15 (100.0%) | 0 (0.0%) |
| 10 or more Apartments | 0 (0.0%) | 0 (0.0%) |
| Mobile Home / Other | 0 (0.0%) | 0 (0.0%) |
| Total | 2,196 (90.7%) | 224 (9.3%) |
Housing Structures by Number of Rooms in Lucas Valley Marinwood
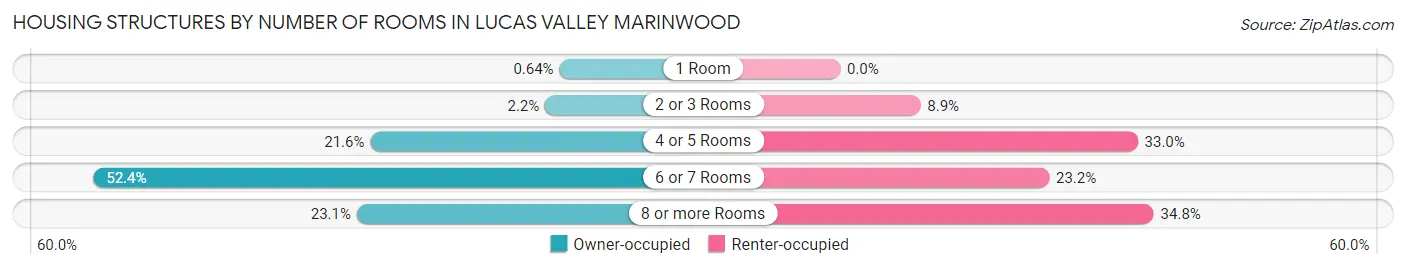
| Number of Rooms | Owner-occupied | Renter-occupied |
| 1 Room | 14 (0.6%) | 0 (0.0%) |
| 2 or 3 Rooms | 49 (2.2%) | 20 (8.9%) |
| 4 or 5 Rooms | 475 (21.6%) | 74 (33.0%) |
| 6 or 7 Rooms | 1,150 (52.4%) | 52 (23.2%) |
| 8 or more Rooms | 508 (23.1%) | 78 (34.8%) |
| Total | 2,196 (100.0%) | 224 (100.0%) |
Housing Structure by Heating Type in Lucas Valley Marinwood
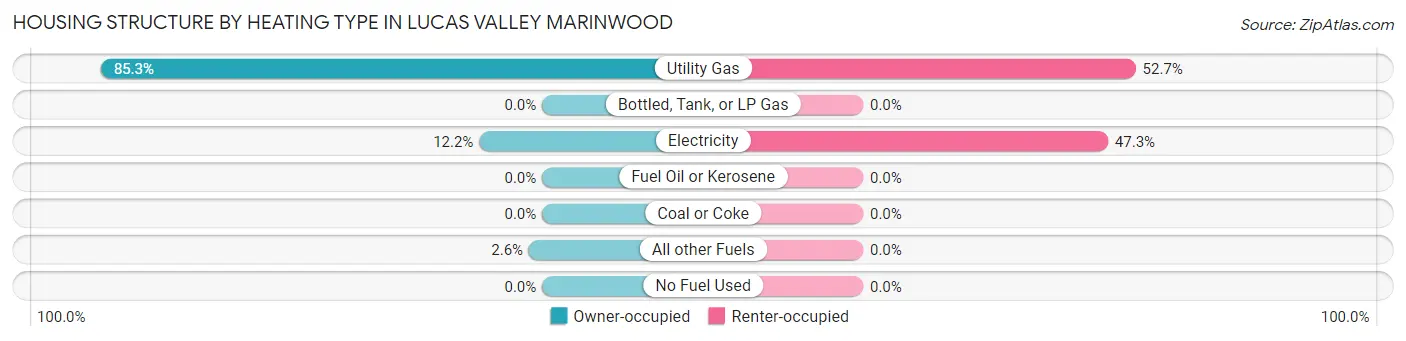
| Heating Type | Owner-occupied | Renter-occupied |
| Utility Gas | 1,873 (85.3%) | 118 (52.7%) |
| Bottled, Tank, or LP Gas | 0 (0.0%) | 0 (0.0%) |
| Electricity | 267 (12.2%) | 106 (47.3%) |
| Fuel Oil or Kerosene | 0 (0.0%) | 0 (0.0%) |
| Coal or Coke | 0 (0.0%) | 0 (0.0%) |
| All other Fuels | 56 (2.5%) | 0 (0.0%) |
| No Fuel Used | 0 (0.0%) | 0 (0.0%) |
| Total | 2,196 (100.0%) | 224 (100.0%) |
Household Vehicle Usage in Lucas Valley Marinwood
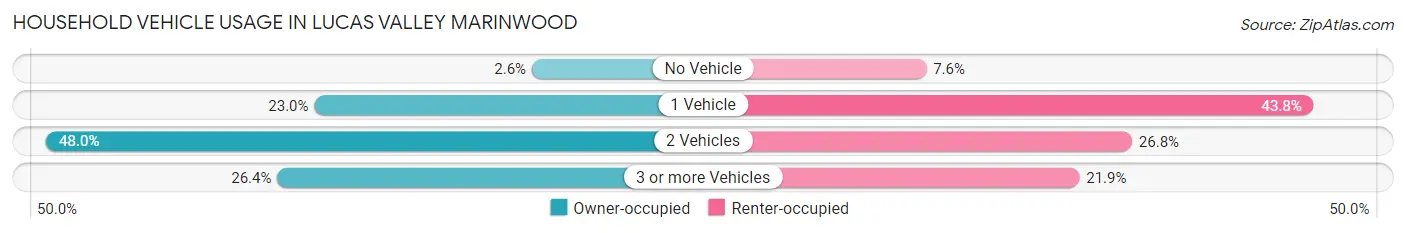
| Vehicles per Household | Owner-occupied | Renter-occupied |
| No Vehicle | 58 (2.6%) | 17 (7.6%) |
| 1 Vehicle | 504 (23.0%) | 98 (43.8%) |
| 2 Vehicles | 1,054 (48.0%) | 60 (26.8%) |
| 3 or more Vehicles | 580 (26.4%) | 49 (21.9%) |
| Total | 2,196 (100.0%) | 224 (100.0%) |
Real Estate & Mortgages in Lucas Valley Marinwood
Real Estate and Mortgage Overview in Lucas Valley Marinwood
| Characteristic | Without Mortgage | With Mortgage |
| Housing Units | 700 | 1,496 |
| Median Property Value | $1,233,900 | $1,292,100 |
| Median Household Income | $134,688 | $1,152 |
| Monthly Housing Costs | $1,172 | $1,165 |
| Real Estate Taxes | $8,190 | $10 |
Property Value by Mortgage Status in Lucas Valley Marinwood
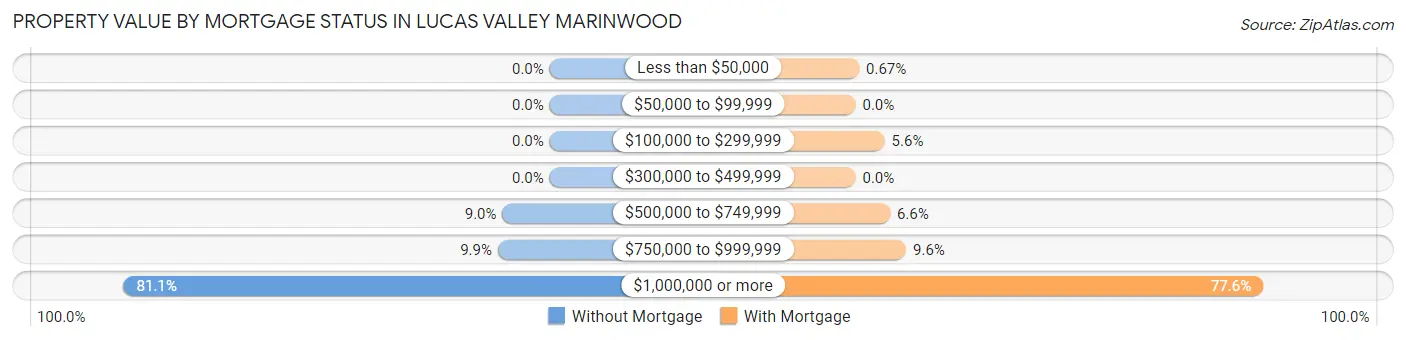
| Property Value | Without Mortgage | With Mortgage |
| Less than $50,000 | 0 (0.0%) | 10 (0.7%) |
| $50,000 to $99,999 | 0 (0.0%) | 0 (0.0%) |
| $100,000 to $299,999 | 0 (0.0%) | 83 (5.6%) |
| $300,000 to $499,999 | 0 (0.0%) | 0 (0.0%) |
| $500,000 to $749,999 | 63 (9.0%) | 98 (6.6%) |
| $750,000 to $999,999 | 69 (9.9%) | 144 (9.6%) |
| $1,000,000 or more | 568 (81.1%) | 1,161 (77.6%) |
| Total | 700 (100.0%) | 1,496 (100.0%) |
Household Income by Mortgage Status in Lucas Valley Marinwood
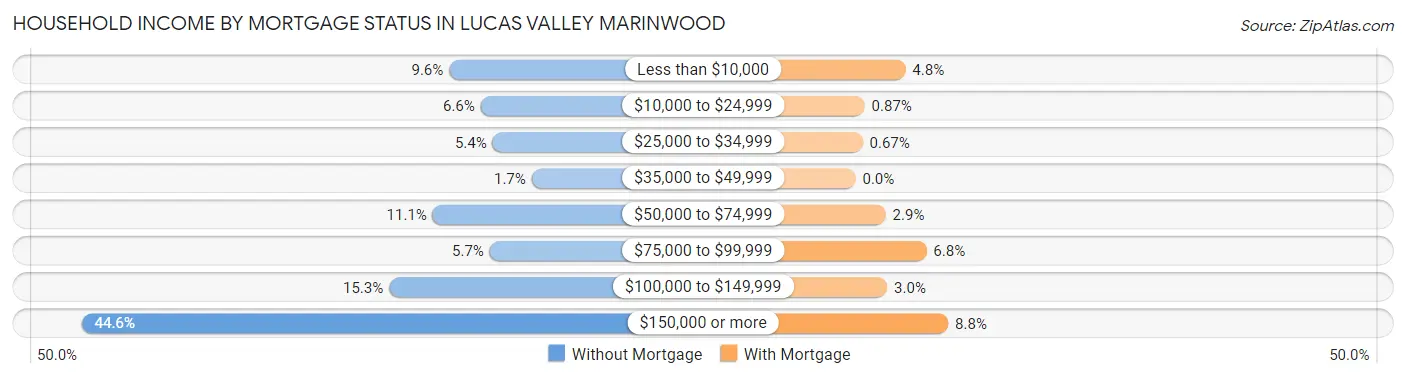
| Household Income | Without Mortgage | With Mortgage |
| Less than $10,000 | 67 (9.6%) | 71 (4.8%) |
| $10,000 to $24,999 | 46 (6.6%) | 13 (0.9%) |
| $25,000 to $34,999 | 38 (5.4%) | 10 (0.7%) |
| $35,000 to $49,999 | 12 (1.7%) | 0 (0.0%) |
| $50,000 to $74,999 | 78 (11.1%) | 43 (2.9%) |
| $75,000 to $99,999 | 40 (5.7%) | 101 (6.8%) |
| $100,000 to $149,999 | 107 (15.3%) | 45 (3.0%) |
| $150,000 or more | 312 (44.6%) | 132 (8.8%) |
| Total | 700 (100.0%) | 1,496 (100.0%) |
Property Value to Household Income Ratio in Lucas Valley Marinwood
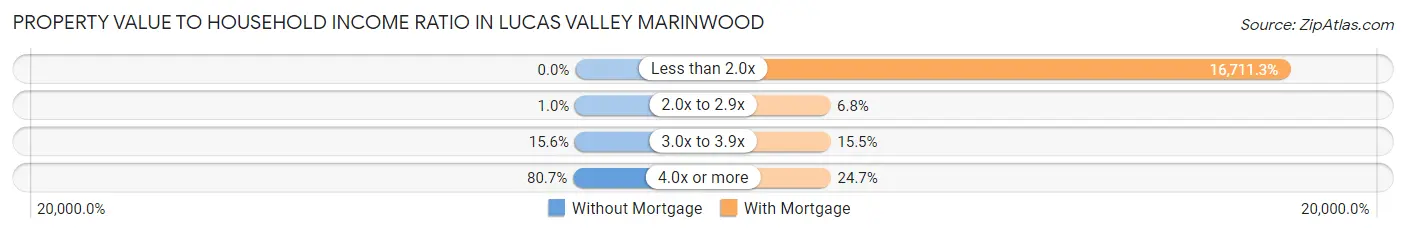
| Value-to-Income Ratio | Without Mortgage | With Mortgage |
| Less than 2.0x | 0 (0.0%) | 250,001 (16,711.3%) |
| 2.0x to 2.9x | 7 (1.0%) | 101 (6.8%) |
| 3.0x to 3.9x | 109 (15.6%) | 232 (15.5%) |
| 4.0x or more | 565 (80.7%) | 369 (24.7%) |
| Total | 700 (100.0%) | 1,496 (100.0%) |
Real Estate Taxes by Mortgage Status in Lucas Valley Marinwood
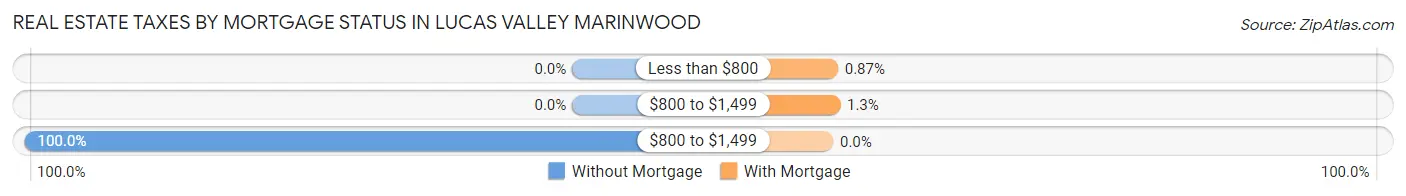
| Property Taxes | Without Mortgage | With Mortgage |
| Less than $800 | 0 (0.0%) | 13 (0.9%) |
| $800 to $1,499 | 0 (0.0%) | 19 (1.3%) |
| $800 to $1,499 | 700 (100.0%) | 0 (0.0%) |
| Total | 700 (100.0%) | 1,496 (100.0%) |
Health & Disability in Lucas Valley Marinwood
Health Insurance Coverage by Age in Lucas Valley Marinwood
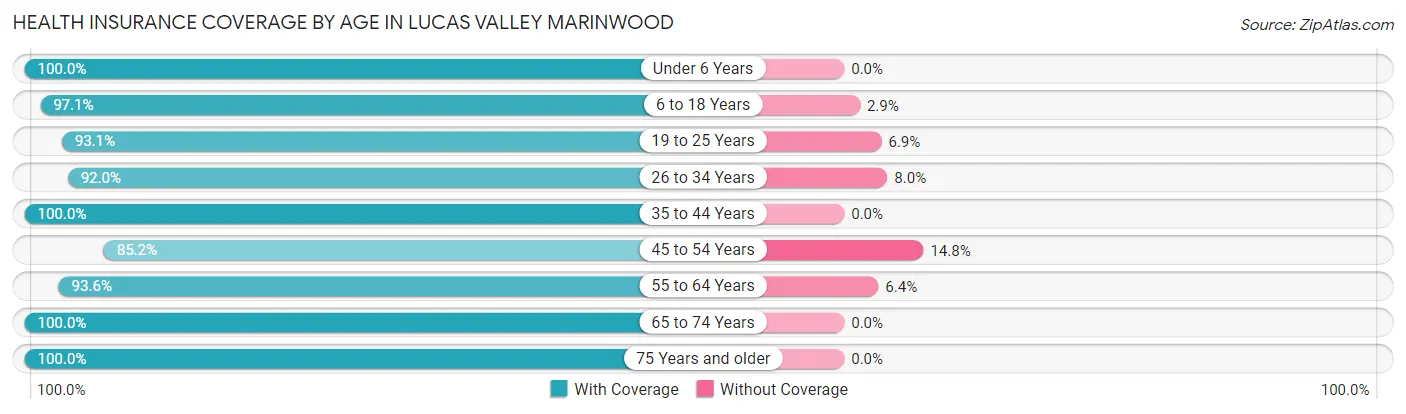
| Age Bracket | With Coverage | Without Coverage |
| Under 6 Years | 169 (100.0%) | 0 (0.0%) |
| 6 to 18 Years | 1,129 (97.1%) | 34 (2.9%) |
| 19 to 25 Years | 228 (93.1%) | 17 (6.9%) |
| 26 to 34 Years | 366 (92.0%) | 32 (8.0%) |
| 35 to 44 Years | 503 (100.0%) | 0 (0.0%) |
| 45 to 54 Years | 1,114 (85.2%) | 193 (14.8%) |
| 55 to 64 Years | 722 (93.6%) | 49 (6.4%) |
| 65 to 74 Years | 943 (100.0%) | 0 (0.0%) |
| 75 Years and older | 819 (100.0%) | 0 (0.0%) |
| Total | 5,993 (94.9%) | 325 (5.1%) |
Health Insurance Coverage by Citizenship Status in Lucas Valley Marinwood
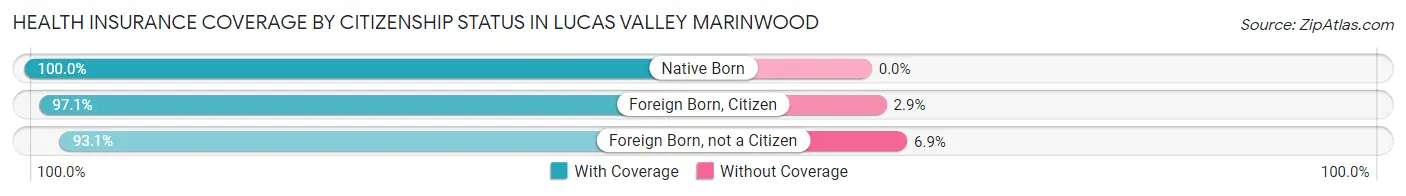
| Citizenship Status | With Coverage | Without Coverage |
| Native Born | 169 (100.0%) | 0 (0.0%) |
| Foreign Born, Citizen | 1,129 (97.1%) | 34 (2.9%) |
| Foreign Born, not a Citizen | 228 (93.1%) | 17 (6.9%) |
Health Insurance Coverage by Household Income in Lucas Valley Marinwood
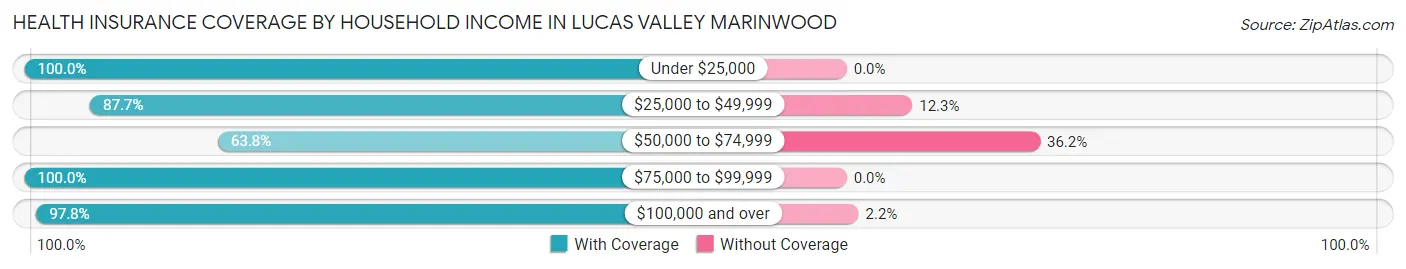
| Household Income | With Coverage | Without Coverage |
| Under $25,000 | 210 (100.0%) | 0 (0.0%) |
| $25,000 to $49,999 | 143 (87.7%) | 20 (12.3%) |
| $50,000 to $74,999 | 340 (63.8%) | 193 (36.2%) |
| $75,000 to $99,999 | 223 (100.0%) | 0 (0.0%) |
| $100,000 and over | 4,946 (97.8%) | 112 (2.2%) |
Public vs Private Health Insurance Coverage by Age in Lucas Valley Marinwood
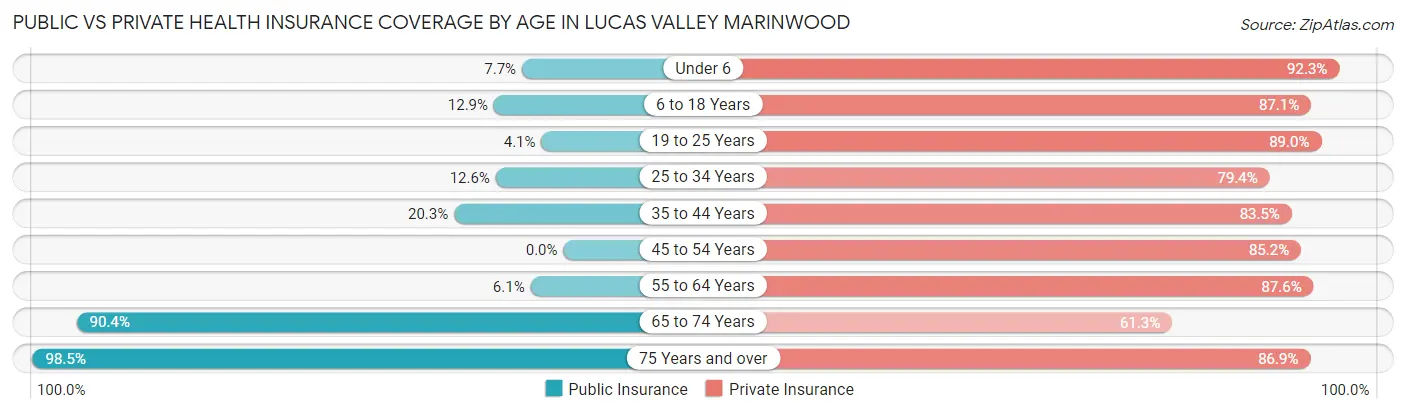
| Age Bracket | Public Insurance | Private Insurance |
| Under 6 | 13 (7.7%) | 156 (92.3%) |
| 6 to 18 Years | 150 (12.9%) | 1,013 (87.1%) |
| 19 to 25 Years | 10 (4.1%) | 218 (89.0%) |
| 25 to 34 Years | 50 (12.6%) | 316 (79.4%) |
| 35 to 44 Years | 102 (20.3%) | 420 (83.5%) |
| 45 to 54 Years | 0 (0.0%) | 1,114 (85.2%) |
| 55 to 64 Years | 47 (6.1%) | 675 (87.5%) |
| 65 to 74 Years | 852 (90.3%) | 578 (61.3%) |
| 75 Years and over | 807 (98.5%) | 712 (86.9%) |
| Total | 2,031 (32.2%) | 5,202 (82.3%) |
Disability Status by Sex by Age in Lucas Valley Marinwood
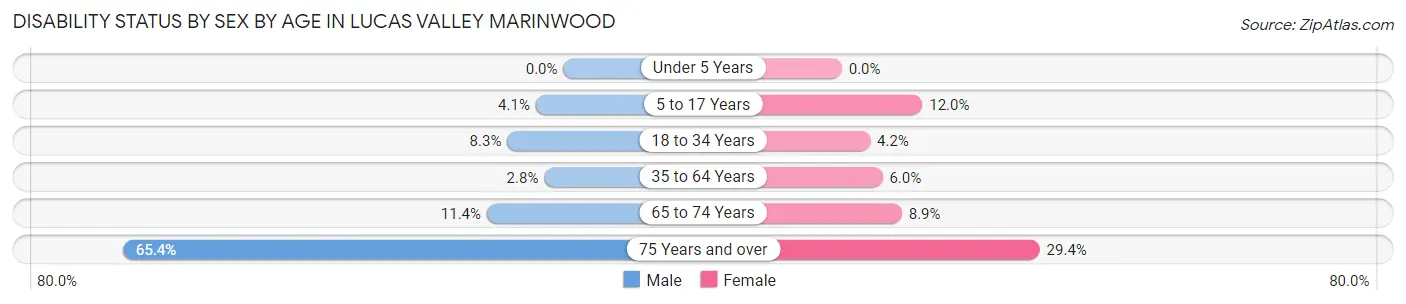
| Age Bracket | Male | Female |
| Under 5 Years | 0 (0.0%) | 0 (0.0%) |
| 5 to 17 Years | 21 (4.1%) | 75 (12.0%) |
| 18 to 34 Years | 20 (8.3%) | 21 (4.2%) |
| 35 to 64 Years | 30 (2.8%) | 92 (6.0%) |
| 65 to 74 Years | 51 (11.4%) | 44 (8.9%) |
| 75 Years and over | 155 (65.4%) | 171 (29.4%) |
Disability Class by Sex by Age in Lucas Valley Marinwood
Disability Class: Hearing Difficulty
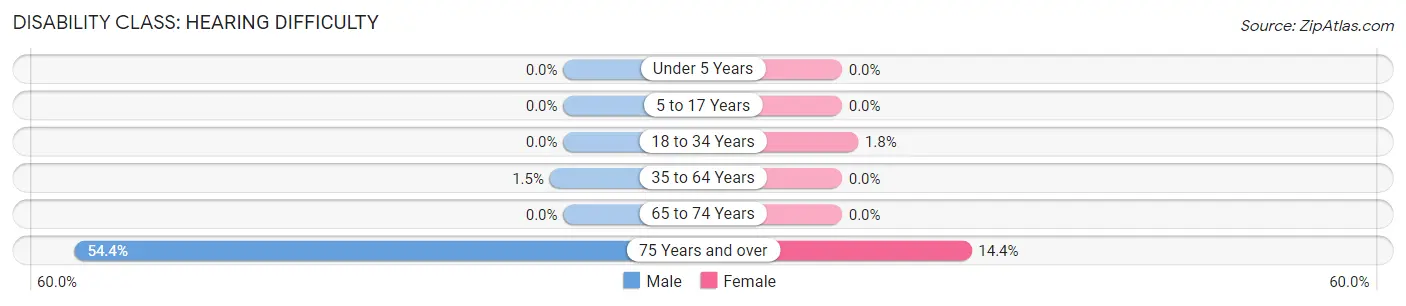
| Age Bracket | Male | Female |
| Under 5 Years | 0 (0.0%) | 0 (0.0%) |
| 5 to 17 Years | 0 (0.0%) | 0 (0.0%) |
| 18 to 34 Years | 0 (0.0%) | 9 (1.8%) |
| 35 to 64 Years | 16 (1.5%) | 0 (0.0%) |
| 65 to 74 Years | 0 (0.0%) | 0 (0.0%) |
| 75 Years and over | 129 (54.4%) | 84 (14.4%) |
Disability Class: Vision Difficulty
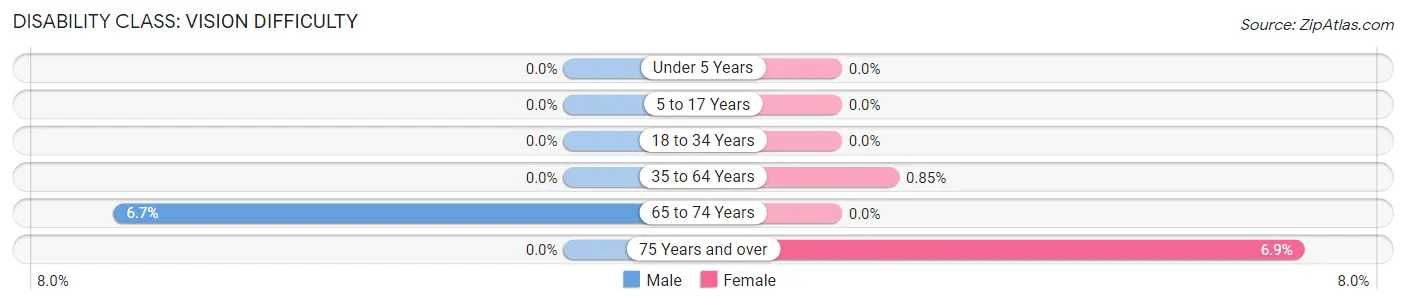
| Age Bracket | Male | Female |
| Under 5 Years | 0 (0.0%) | 0 (0.0%) |
| 5 to 17 Years | 0 (0.0%) | 0 (0.0%) |
| 18 to 34 Years | 0 (0.0%) | 0 (0.0%) |
| 35 to 64 Years | 0 (0.0%) | 13 (0.9%) |
| 65 to 74 Years | 30 (6.7%) | 0 (0.0%) |
| 75 Years and over | 0 (0.0%) | 40 (6.9%) |
Disability Class: Cognitive Difficulty
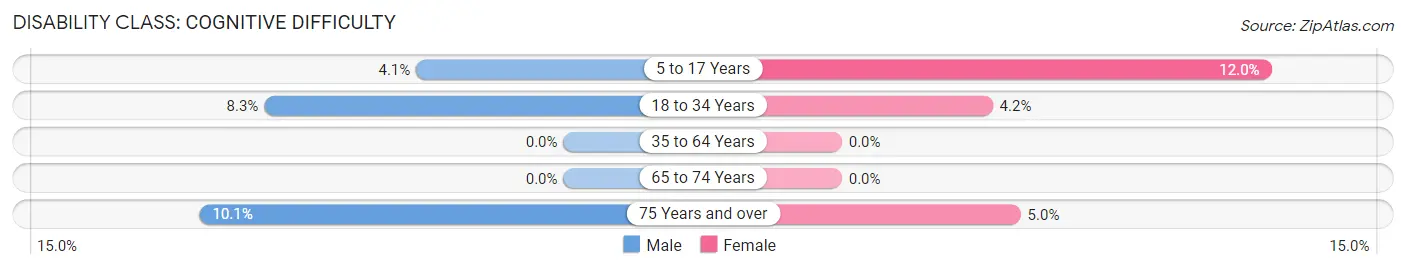
| Age Bracket | Male | Female |
| 5 to 17 Years | 21 (4.1%) | 75 (12.0%) |
| 18 to 34 Years | 20 (8.3%) | 21 (4.2%) |
| 35 to 64 Years | 0 (0.0%) | 0 (0.0%) |
| 65 to 74 Years | 0 (0.0%) | 0 (0.0%) |
| 75 Years and over | 24 (10.1%) | 29 (5.0%) |
Disability Class: Ambulatory Difficulty
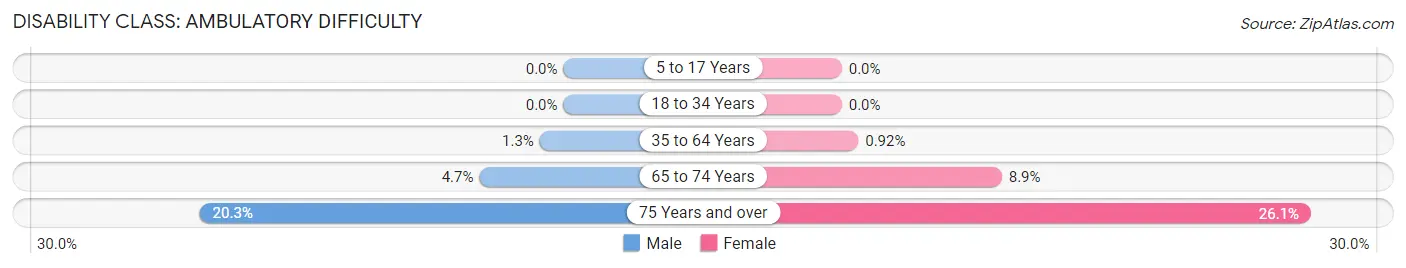
| Age Bracket | Male | Female |
| 5 to 17 Years | 0 (0.0%) | 0 (0.0%) |
| 18 to 34 Years | 0 (0.0%) | 0 (0.0%) |
| 35 to 64 Years | 14 (1.3%) | 14 (0.9%) |
| 65 to 74 Years | 21 (4.7%) | 44 (8.9%) |
| 75 Years and over | 48 (20.3%) | 152 (26.1%) |
Disability Class: Self-Care Difficulty
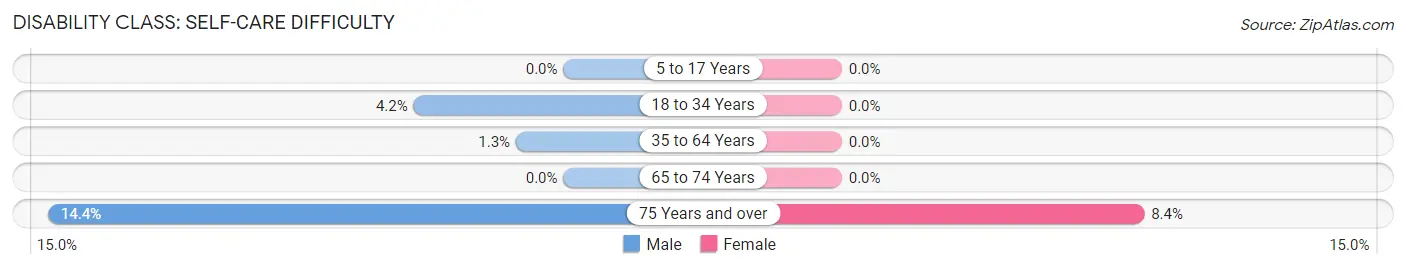
| Age Bracket | Male | Female |
| 5 to 17 Years | 0 (0.0%) | 0 (0.0%) |
| 18 to 34 Years | 10 (4.2%) | 0 (0.0%) |
| 35 to 64 Years | 14 (1.3%) | 0 (0.0%) |
| 65 to 74 Years | 0 (0.0%) | 0 (0.0%) |
| 75 Years and over | 34 (14.3%) | 49 (8.4%) |
Technology Access in Lucas Valley Marinwood
Computing Device Access in Lucas Valley Marinwood
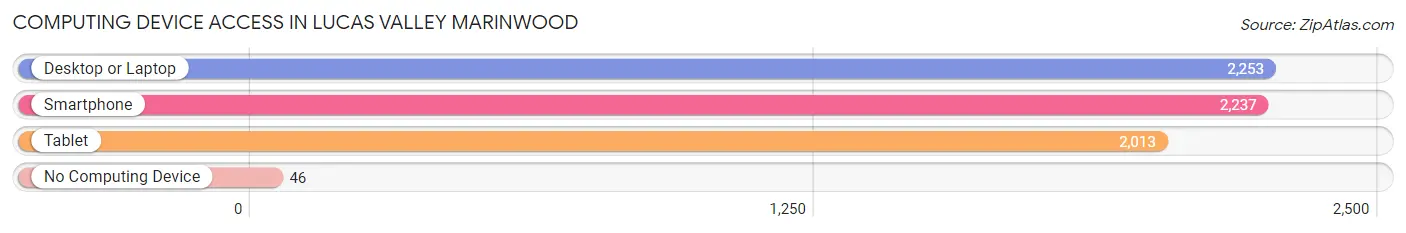
| Device Type | # Households | % Households |
| Desktop or Laptop | 2,253 | 93.1% |
| Smartphone | 2,237 | 92.4% |
| Tablet | 2,013 | 83.2% |
| No Computing Device | 46 | 1.9% |
| Total | 2,420 | 100.0% |
Internet Access in Lucas Valley Marinwood
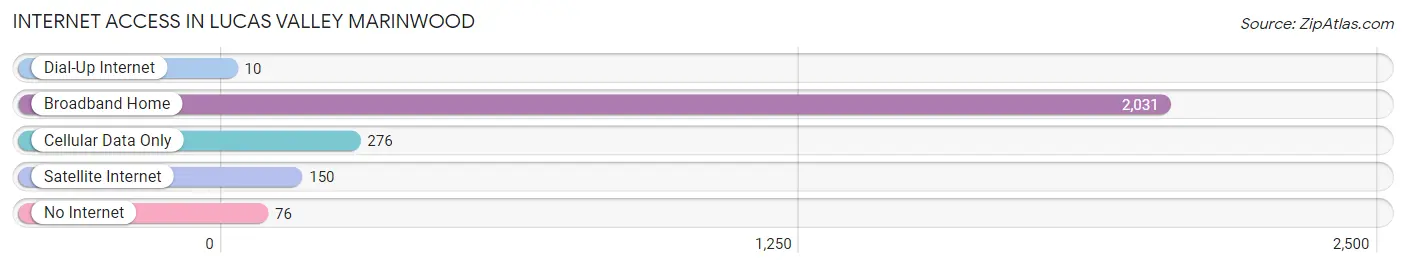
| Internet Type | # Households | % Households |
| Dial-Up Internet | 10 | 0.4% |
| Broadband Home | 2,031 | 83.9% |
| Cellular Data Only | 276 | 11.4% |
| Satellite Internet | 150 | 6.2% |
| No Internet | 76 | 3.1% |
| Total | 2,420 | 100.0% |
Lucas Valley Marinwood Summary
Lucas Valley Marinwood is a census-designated place (CDP) located in Marin County, California. It is situated in the San Francisco Bay Area, approximately 10 miles north of San Francisco. The population of Lucas Valley Marinwood was 6,094 at the 2010 census.
History
Lucas Valley Marinwood was originally inhabited by the Coast Miwok Native American tribe. The area was first settled by Europeans in the late 19th century. The area was named after George Lucas, who purchased the land in the 1970s. Lucas Valley Marinwood was incorporated as a CDP in 1980.
Geography
Lucas Valley Marinwood is located at 37°53'N 122°33'W. It is situated in the San Francisco Bay Area, approximately 10 miles north of San Francisco. The CDP has a total area of 4.2 square miles, all of which is land.
Economy
The economy of Lucas Valley Marinwood is largely based on the service industry. The area is home to a variety of restaurants, retail stores, and other businesses. The area is also home to a number of technology companies, including Autodesk, Lucasfilm, and Industrial Light & Magic.
Demographics
As of the 2010 census, the population of Lucas Valley Marinwood was 6,094. The racial makeup of the CDP was 79.2% White, 8.2% Asian, 6.3% Hispanic or Latino, 4.2% African American, and 2.1% other. The median household income was $107,917, and the median family income was $118,917. The per capita income was $50,917.
Conclusion
Lucas Valley Marinwood is a census-designated place located in Marin County, California. It is situated in the San Francisco Bay Area, approximately 10 miles north of San Francisco. The area was originally inhabited by the Coast Miwok Native American tribe and was first settled by Europeans in the late 19th century. The economy of Lucas Valley Marinwood is largely based on the service industry, and the area is home to a variety of restaurants, retail stores, and other businesses. As of the 2010 census, the population of Lucas Valley Marinwood was 6,094. The racial makeup of the CDP was 79.2% White, 8.2% Asian, 6.3% Hispanic or Latino, 4.2% African American, and 2.1% other. The median household income was $107,917, and the median family income was $118,917.
Common Questions
What is Per Capita Income in Lucas Valley Marinwood?
Per Capita income in Lucas Valley Marinwood is $105,657.
What is the Median Family Income in Lucas Valley Marinwood?
Median Family Income in Lucas Valley Marinwood is $250,001.
What is the Median Household income in Lucas Valley Marinwood?
Median Household Income in Lucas Valley Marinwood is $216,524.
What is Income or Wage Gap in Lucas Valley Marinwood?
Income or Wage Gap in Lucas Valley Marinwood is 53.3%.
Women in Lucas Valley Marinwood earn 46.7 cents for every dollar earned by a man.
What is Inequality or Gini Index in Lucas Valley Marinwood?
Inequality or Gini Index in Lucas Valley Marinwood is 0.46.
What is the Total Population of Lucas Valley Marinwood?
Total Population of Lucas Valley Marinwood is 6,334.
What is the Total Male Population of Lucas Valley Marinwood?
Total Male Population of Lucas Valley Marinwood is 2,561.
What is the Total Female Population of Lucas Valley Marinwood?
Total Female Population of Lucas Valley Marinwood is 3,773.
What is the Ratio of Males per 100 Females in Lucas Valley Marinwood?
There are 67.88 Males per 100 Females in Lucas Valley Marinwood.
What is the Ratio of Females per 100 Males in Lucas Valley Marinwood?
There are 147.33 Females per 100 Males in Lucas Valley Marinwood.
What is the Median Population Age in Lucas Valley Marinwood?
Median Population Age in Lucas Valley Marinwood is 49.5 Years.
What is the Average Family Size in Lucas Valley Marinwood
Average Family Size in Lucas Valley Marinwood is 3.1 People.
What is the Average Household Size in Lucas Valley Marinwood
Average Household Size in Lucas Valley Marinwood is 2.6 People.
How Large is the Labor Force in Lucas Valley Marinwood?
There are 3,320 People in the Labor Forcein in Lucas Valley Marinwood.
What is the Percentage of People in the Labor Force in Lucas Valley Marinwood?
62.6% of People are in the Labor Force in Lucas Valley Marinwood.
What is the Unemployment Rate in Lucas Valley Marinwood?
Unemployment Rate in Lucas Valley Marinwood is 2.4%.