Coto de Caza, CA Map & Demographics
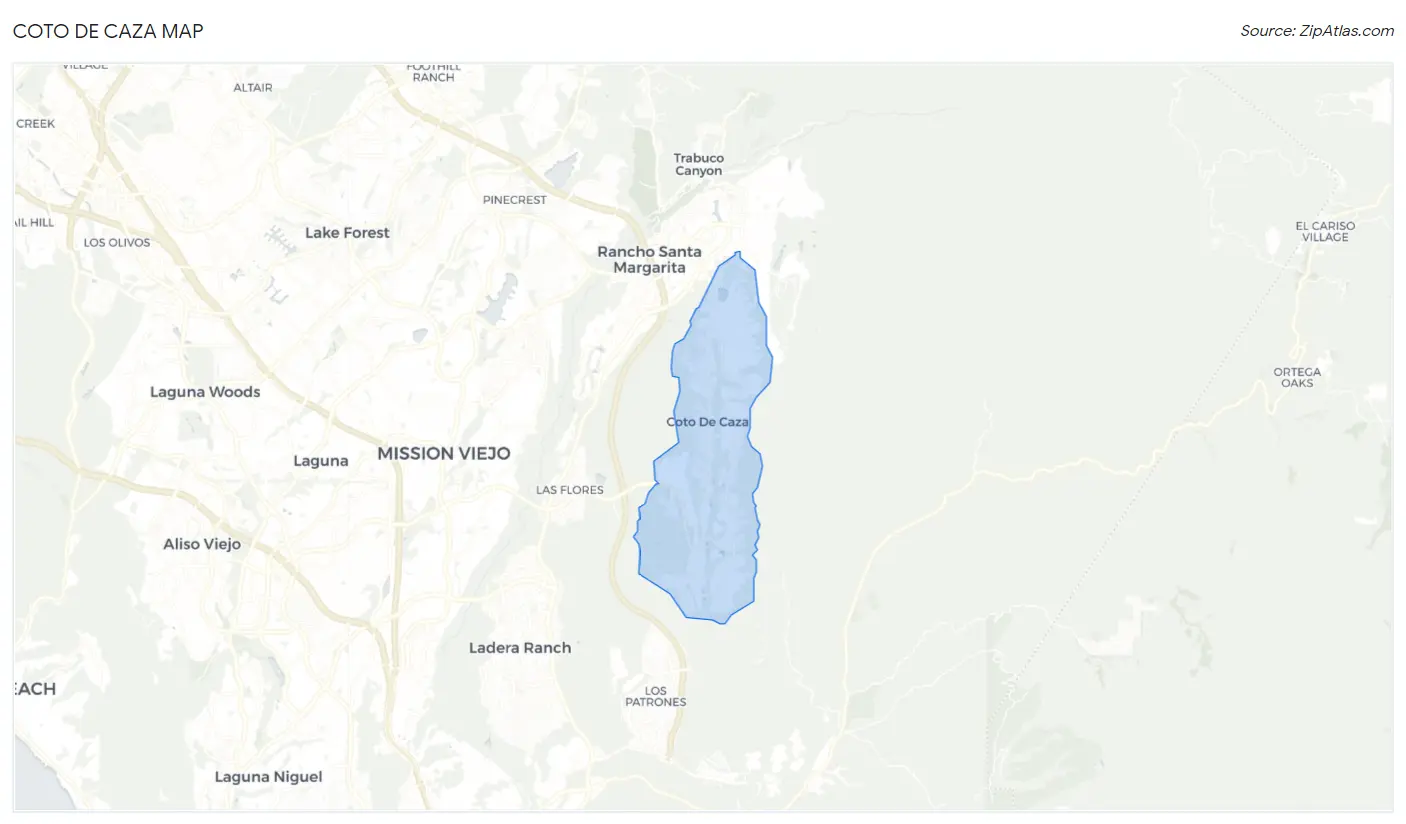
Coto de Caza Map
Coto de Caza Overview
$99,083
PER CAPITA INCOME
$234,861
AVG FAMILY INCOME
$227,593
AVG HOUSEHOLD INCOME
56.6%
WAGE / INCOME GAP [ % ]
43.4¢/ $1
WAGE / INCOME GAP [ $ ]
$11,387
FAMILY INCOME DEFICIT
0.45
INEQUALITY / GINI INDEX
15,632
TOTAL POPULATION
7,913
MALE POPULATION
7,719
FEMALE POPULATION
102.51
MALES / 100 FEMALES
97.55
FEMALES / 100 MALES
45.6
MEDIAN AGE
3.3
AVG FAMILY SIZE
3.1
AVG HOUSEHOLD SIZE
8,583
LABOR FORCE [ PEOPLE ]
67.0%
PERCENT IN LABOR FORCE
4.2%
UNEMPLOYMENT RATE
Coto de Caza Area Codes
Income in Coto de Caza
Income Overview in Coto de Caza
Per Capita Income in Coto de Caza is $99,083, while median incomes of families and households are $234,861 and $227,593 respectively.
| Characteristic | Number | Measure |
| Per Capita Income | 15,632 | $99,083 |
| Median Family Income | 4,480 | $234,861 |
| Mean Family Income | 4,480 | $317,164 |
| Median Household Income | 4,986 | $227,593 |
| Mean Household Income | 4,986 | $305,887 |
| Income Deficit | 4,480 | $11,387 |
| Wage / Income Gap (%) | 15,632 | 56.56% |
| Wage / Income Gap ($) | 15,632 | 43.44¢ per $1 |
| Gini / Inequality Index | 15,632 | 0.45 |
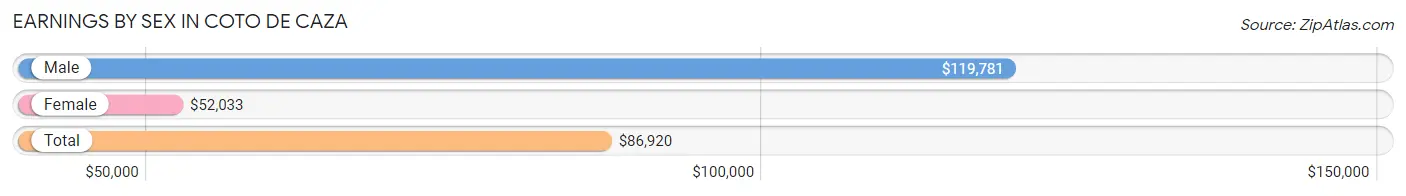
Earnings by Sex in Coto de Caza
Average Earnings in Coto de Caza are $86,920, $119,781 for men and $52,033 for women, a difference of 56.6%.
| Sex | Number | Average Earnings |
| Male | 4,900 (56.0%) | $119,781 |
| Female | 3,842 (44.0%) | $52,033 |
| Total | 8,742 (100.0%) | $86,920 |
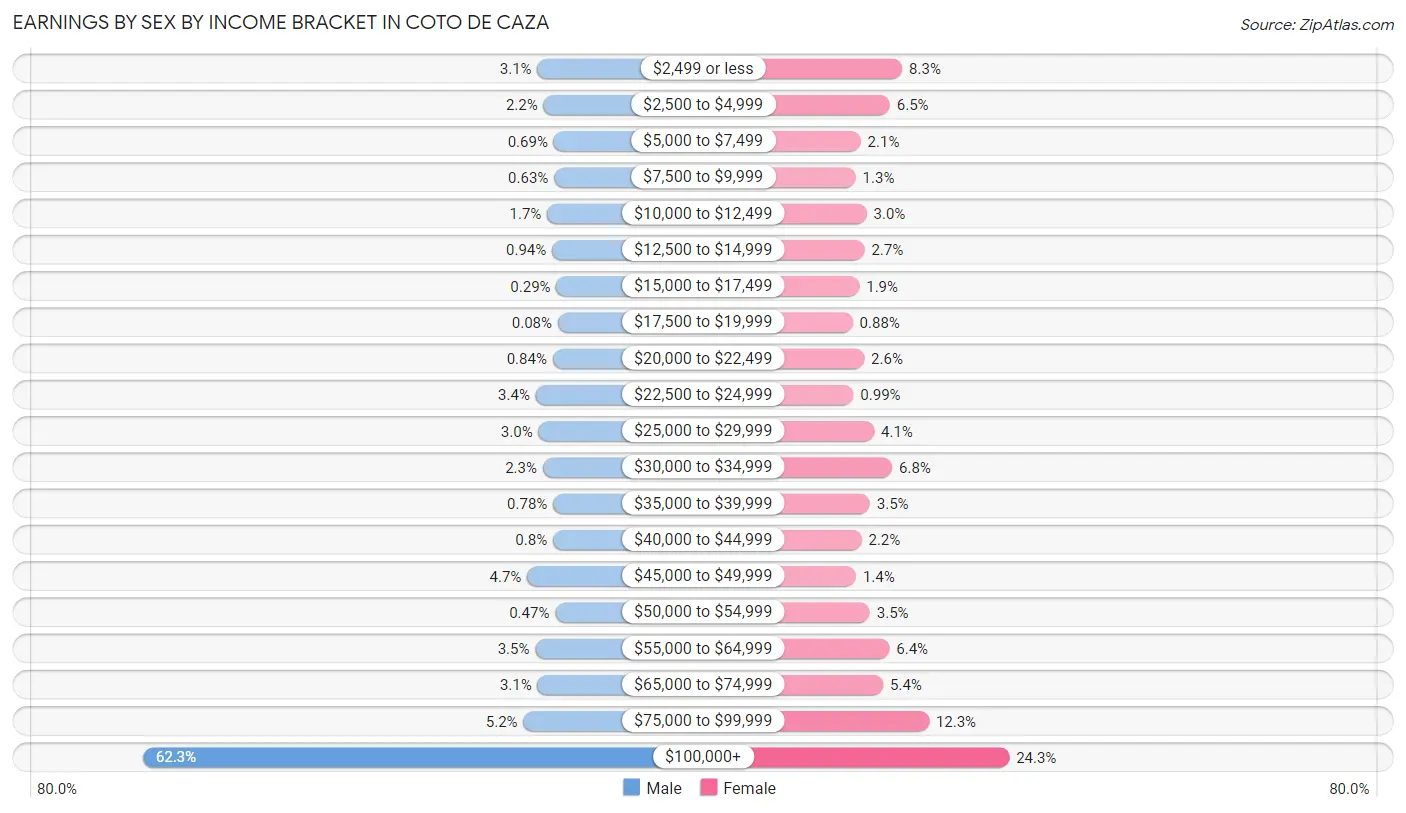
Earnings by Sex by Income Bracket in Coto de Caza
The most common earnings brackets in Coto de Caza are $100,000+ for men (3,051 | 62.3%) and $100,000+ for women (935 | 24.3%).
| Income | Male | Female |
| $2,499 or less | 154 (3.1%) | 319 (8.3%) |
| $2,500 to $4,999 | 109 (2.2%) | 248 (6.5%) |
| $5,000 to $7,499 | 34 (0.7%) | 80 (2.1%) |
| $7,500 to $9,999 | 31 (0.6%) | 51 (1.3%) |
| $10,000 to $12,499 | 82 (1.7%) | 114 (3.0%) |
| $12,500 to $14,999 | 46 (0.9%) | 102 (2.6%) |
| $15,000 to $17,499 | 14 (0.3%) | 72 (1.9%) |
| $17,500 to $19,999 | 4 (0.1%) | 34 (0.9%) |
| $20,000 to $22,499 | 41 (0.8%) | 100 (2.6%) |
| $22,500 to $24,999 | 166 (3.4%) | 38 (1.0%) |
| $25,000 to $29,999 | 146 (3.0%) | 157 (4.1%) |
| $30,000 to $34,999 | 114 (2.3%) | 261 (6.8%) |
| $35,000 to $39,999 | 38 (0.8%) | 133 (3.5%) |
| $40,000 to $44,999 | 39 (0.8%) | 85 (2.2%) |
| $45,000 to $49,999 | 229 (4.7%) | 53 (1.4%) |
| $50,000 to $54,999 | 23 (0.5%) | 133 (3.5%) |
| $55,000 to $64,999 | 169 (3.5%) | 245 (6.4%) |
| $65,000 to $74,999 | 153 (3.1%) | 209 (5.4%) |
| $75,000 to $99,999 | 257 (5.2%) | 473 (12.3%) |
| $100,000+ | 3,051 (62.3%) | 935 (24.3%) |
| Total | 4,900 (100.0%) | 3,842 (100.0%) |
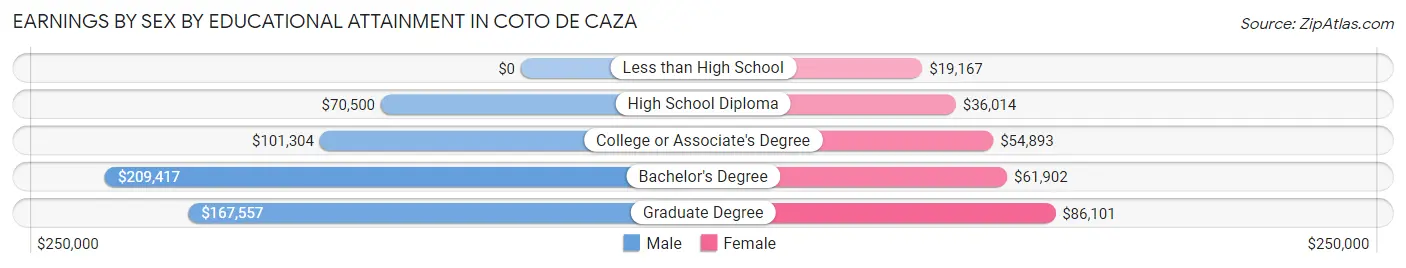
Earnings by Sex by Educational Attainment in Coto de Caza
Average earnings in Coto de Caza are $140,250 for men and $63,906 for women, a difference of 54.4%. Men with an educational attainment of bachelor's degree enjoy the highest average annual earnings of $209,417, while those with high school diploma education earn the least with $70,500. Women with an educational attainment of graduate degree earn the most with the average annual earnings of $86,101, while those with less than high school education have the smallest earnings of $19,167.
| Educational Attainment | Male Income | Female Income |
| Less than High School | - | - |
| High School Diploma | $70,500 | $36,014 |
| College or Associate's Degree | $101,304 | $54,893 |
| Bachelor's Degree | $209,417 | $61,902 |
| Graduate Degree | $167,557 | $86,101 |
| Total | $140,250 | $63,906 |
Family Income in Coto de Caza
Family Income Brackets in Coto de Caza
According to the Coto de Caza family income data, there are 2,764 families falling into the $200,000+ income range, which is the most common income bracket and makes up 61.7% of all families. Conversely, the $10,000 to $14,999 income bracket is the least frequent group with only 13 families (0.3%) belonging to this category.
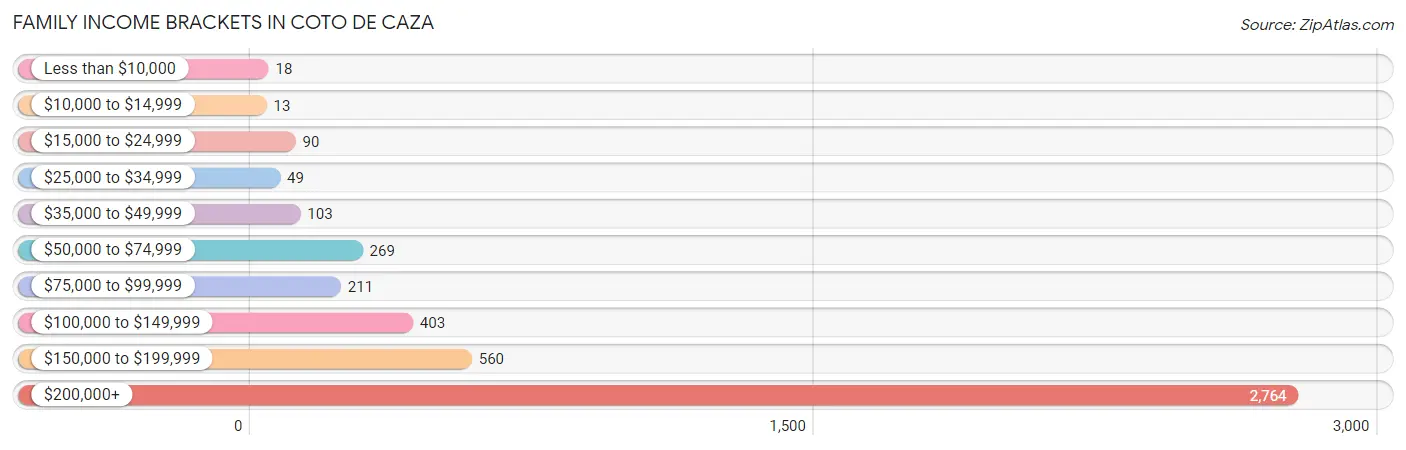
| Income Bracket | # Families | % Families |
| Less than $10,000 | 18 | 0.4% |
| $10,000 to $14,999 | 13 | 0.3% |
| $15,000 to $24,999 | 90 | 2.0% |
| $25,000 to $34,999 | 49 | 1.1% |
| $35,000 to $49,999 | 103 | 2.3% |
| $50,000 to $74,999 | 269 | 6.0% |
| $75,000 to $99,999 | 211 | 4.7% |
| $100,000 to $149,999 | 403 | 9.0% |
| $150,000 to $199,999 | 560 | 12.5% |
| $200,000+ | 2,764 | 61.7% |
Family Income by Famaliy Size in Coto de Caza
4-person families (975 | 21.8%) account for the highest median family income in Coto de Caza with $250,001 per family, while 2-person families (1,901 | 42.4%) have the highest median income of $99,943 per family member.
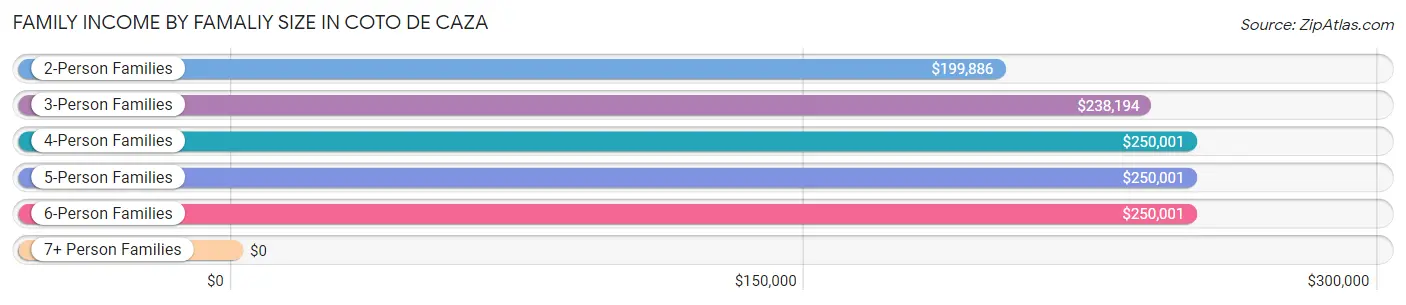
| Income Bracket | # Families | Median Income |
| 2-Person Families | 1,901 (42.4%) | $199,886 |
| 3-Person Families | 950 (21.2%) | $238,194 |
| 4-Person Families | 975 (21.8%) | $250,001 |
| 5-Person Families | 461 (10.3%) | $250,001 |
| 6-Person Families | 150 (3.4%) | $250,001 |
| 7+ Person Families | 43 (1.0%) | $0 |
| Total | 4,480 (100.0%) | $234,861 |
Family Income by Number of Earners in Coto de Caza
The median family income in Coto de Caza is $234,861, with families comprising 2 earners (1,940) having the highest median family income of $250,001, while families with no earners (427) have the lowest median family income of $84,570, accounting for 43.3% and 9.5% of families, respectively.
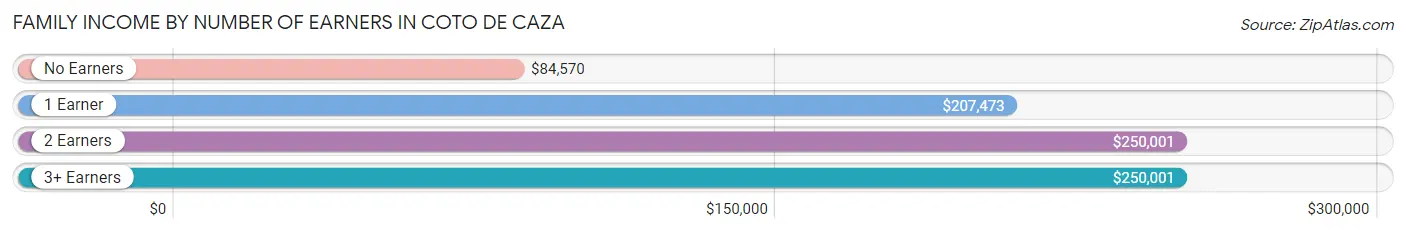
| Number of Earners | # Families | Median Income |
| No Earners | 427 (9.5%) | $84,570 |
| 1 Earner | 1,413 (31.5%) | $207,473 |
| 2 Earners | 1,940 (43.3%) | $250,001 |
| 3+ Earners | 700 (15.6%) | $250,001 |
| Total | 4,480 (100.0%) | $234,861 |
Household Income in Coto de Caza
Household Income Brackets in Coto de Caza
With 2,922 households falling in the category, the $200,000+ income range is the most frequent in Coto de Caza, accounting for 58.6% of all households. In contrast, only 15 households (0.3%) fall into the $10,000 to $14,999 income bracket, making it the least populous group.
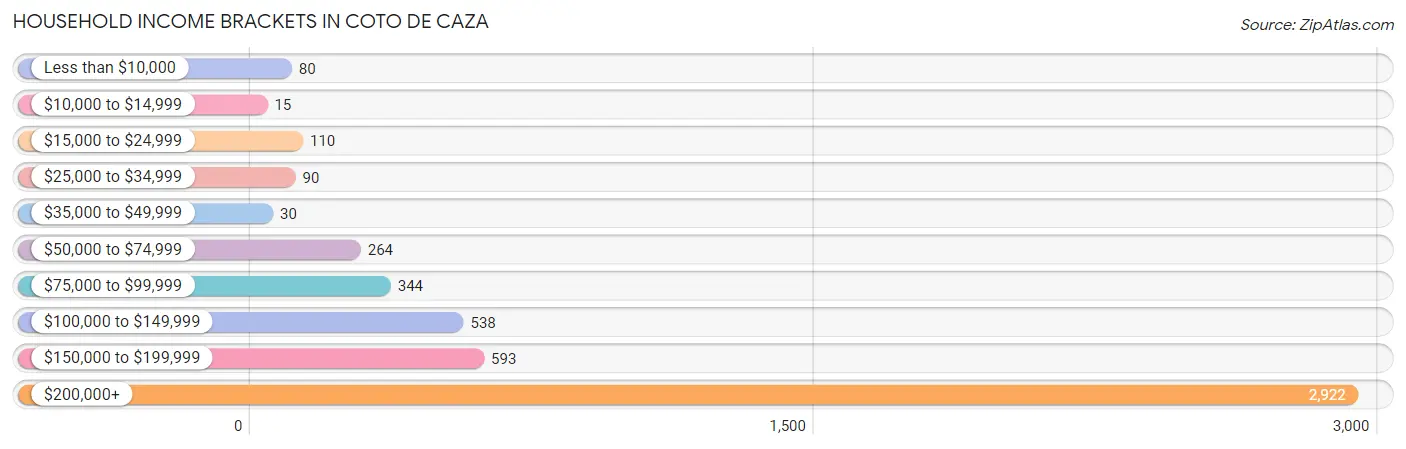
| Income Bracket | # Households | % Households |
| Less than $10,000 | 80 | 1.6% |
| $10,000 to $14,999 | 15 | 0.3% |
| $15,000 to $24,999 | 110 | 2.2% |
| $25,000 to $34,999 | 90 | 1.8% |
| $35,000 to $49,999 | 30 | 0.6% |
| $50,000 to $74,999 | 264 | 5.3% |
| $75,000 to $99,999 | 344 | 6.9% |
| $100,000 to $149,999 | 538 | 10.8% |
| $150,000 to $199,999 | 593 | 11.9% |
| $200,000+ | 2,922 | 58.6% |
Household Income by Householder Age in Coto de Caza
The median household income in Coto de Caza is $227,593, with the highest median household income of $244,688 found in the 45 to 64 years age bracket for the primary householder. A total of 2,900 households (58.2%) fall into this category. Meanwhile, the 15 to 24 years age bracket for the primary householder has the lowest median household income of $0, with 6 households (0.1%) in this group.
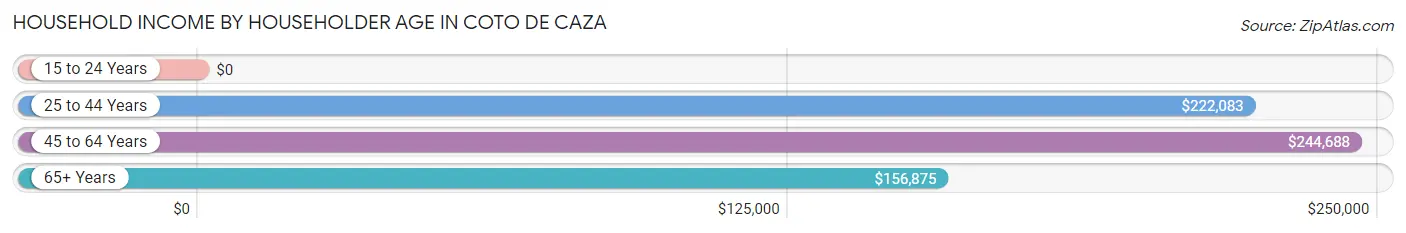
| Income Bracket | # Households | Median Income |
| 15 to 24 Years | 6 (0.1%) | $0 |
| 25 to 44 Years | 939 (18.8%) | $222,083 |
| 45 to 64 Years | 2,900 (58.2%) | $244,688 |
| 65+ Years | 1,141 (22.9%) | $156,875 |
| Total | 4,986 (100.0%) | $227,593 |
Poverty in Coto de Caza
Income Below Poverty by Sex and Age in Coto de Caza
With 2.0% poverty level for males and 4.5% for females among the residents of Coto de Caza, 65 to 74 year old males and under 5 year old females are the most vulnerable to poverty, with 50 males (5.9%) and 69 females (25.8%) in their respective age groups living below the poverty level.
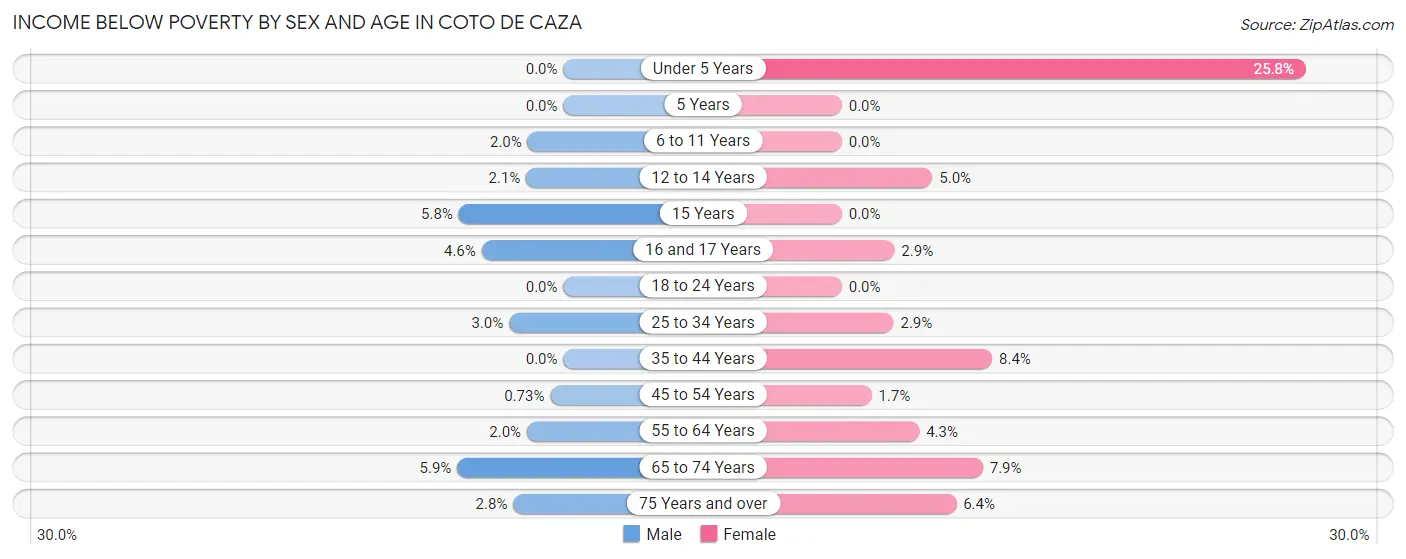
| Age Bracket | Male | Female |
| Under 5 Years | 0 (0.0%) | 69 (25.8%) |
| 5 Years | 0 (0.0%) | 0 (0.0%) |
| 6 to 11 Years | 11 (2.0%) | 0 (0.0%) |
| 12 to 14 Years | 5 (2.1%) | 27 (5.0%) |
| 15 Years | 6 (5.8%) | 0 (0.0%) |
| 16 and 17 Years | 13 (4.5%) | 12 (2.9%) |
| 18 to 24 Years | 0 (0.0%) | 0 (0.0%) |
| 25 to 34 Years | 27 (3.0%) | 16 (2.9%) |
| 35 to 44 Years | 0 (0.0%) | 62 (8.4%) |
| 45 to 54 Years | 11 (0.7%) | 22 (1.7%) |
| 55 to 64 Years | 27 (2.0%) | 70 (4.3%) |
| 65 to 74 Years | 50 (5.9%) | 51 (7.9%) |
| 75 Years and over | 11 (2.8%) | 17 (6.4%) |
| Total | 161 (2.0%) | 346 (4.5%) |
Income Above Poverty by Sex and Age in Coto de Caza
According to the poverty statistics in Coto de Caza, males aged under 5 years and females aged 5 years are the age groups that are most secure financially, with 100.0% of males and 100.0% of females in these age groups living above the poverty line.
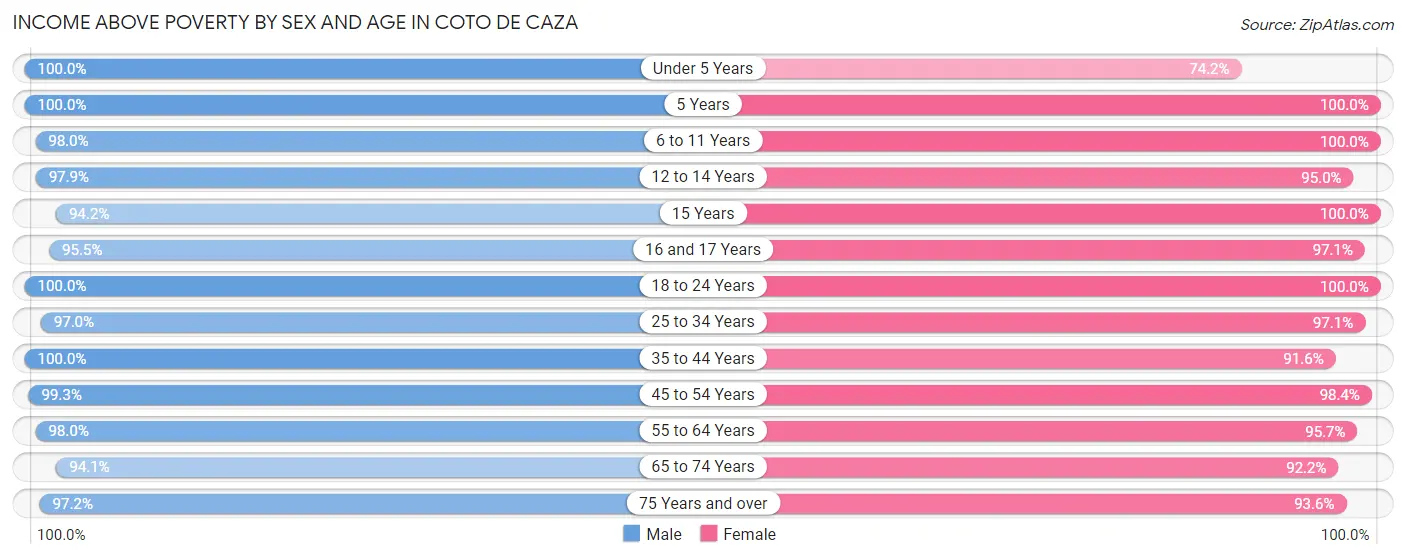
| Age Bracket | Male | Female |
| Under 5 Years | 339 (100.0%) | 198 (74.2%) |
| 5 Years | 64 (100.0%) | 81 (100.0%) |
| 6 to 11 Years | 542 (98.0%) | 429 (100.0%) |
| 12 to 14 Years | 236 (97.9%) | 509 (95.0%) |
| 15 Years | 97 (94.2%) | 167 (100.0%) |
| 16 and 17 Years | 273 (95.5%) | 398 (97.1%) |
| 18 to 24 Years | 589 (100.0%) | 654 (100.0%) |
| 25 to 34 Years | 866 (97.0%) | 540 (97.1%) |
| 35 to 44 Years | 732 (100.0%) | 679 (91.6%) |
| 45 to 54 Years | 1,500 (99.3%) | 1,309 (98.4%) |
| 55 to 64 Years | 1,300 (98.0%) | 1,553 (95.7%) |
| 65 to 74 Years | 796 (94.1%) | 599 (92.1%) |
| 75 Years and over | 383 (97.2%) | 250 (93.6%) |
| Total | 7,717 (98.0%) | 7,366 (95.5%) |
Income Below Poverty Among Married-Couple Families in Coto de Caza
The poverty statistics for married-couple families in Coto de Caza show that 0.5% or 20 of the total 3,998 families live below the poverty line. Families with 1 or 2 children have the highest poverty rate of 0.9%, comprising of 11 families. On the other hand, families with 3 or 4 children have the lowest poverty rate of 0.0%, which includes 0 families.
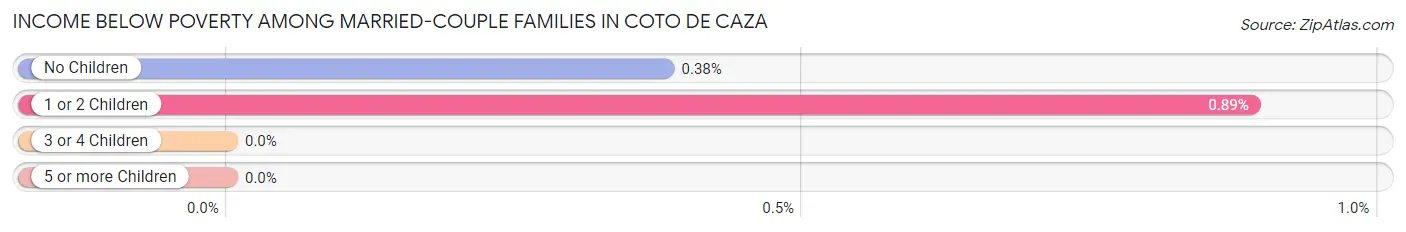
| Children | Above Poverty | Below Poverty |
| No Children | 2,331 (99.6%) | 9 (0.4%) |
| 1 or 2 Children | 1,228 (99.1%) | 11 (0.9%) |
| 3 or 4 Children | 405 (100.0%) | 0 (0.0%) |
| 5 or more Children | 14 (100.0%) | 0 (0.0%) |
| Total | 3,978 (99.5%) | 20 (0.5%) |
Income Below Poverty Among Single-Parent Households in Coto de Caza
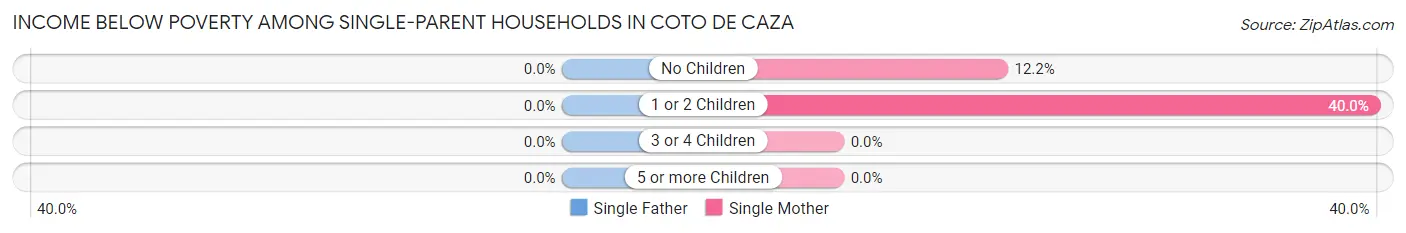
| Children | Single Father | Single Mother |
| No Children | 0 (0.0%) | 21 (12.2%) |
| 1 or 2 Children | 0 (0.0%) | 42 (40.0%) |
| 3 or 4 Children | 0 (0.0%) | 0 (0.0%) |
| 5 or more Children | 0 (0.0%) | 0 (0.0%) |
| Total | 0 (0.0%) | 63 (22.7%) |
Income Below Poverty Among Married-Couple vs Single-Parent Households in Coto de Caza
The poverty data for Coto de Caza shows that 20 of the married-couple family households (0.5%) and 63 of the single-parent households (13.1%) are living below the poverty level. Within the married-couple family households, those with 1 or 2 children have the highest poverty rate, with 11 households (0.9%) falling below the poverty line. Among the single-parent households, those with 1 or 2 children have the highest poverty rate, with 42 household (25.5%) living below poverty.
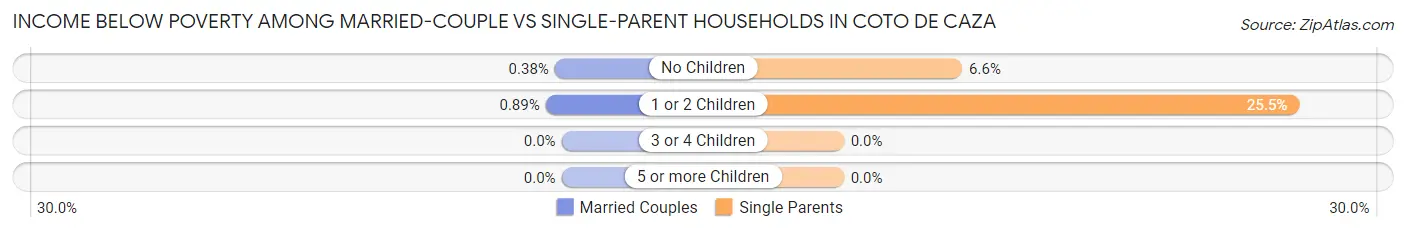
| Children | Married-Couple Families | Single-Parent Households |
| No Children | 9 (0.4%) | 21 (6.6%) |
| 1 or 2 Children | 11 (0.9%) | 42 (25.5%) |
| 3 or 4 Children | 0 (0.0%) | 0 (0.0%) |
| 5 or more Children | 0 (0.0%) | 0 (0.0%) |
| Total | 20 (0.5%) | 63 (13.1%) |
Race in Coto de Caza
The most populous races in Coto de Caza are White / Caucasian (12,068 | 77.2%), Hispanic or Latino (2,130 | 13.6%), and Two or more Races (1,611 | 10.3%).
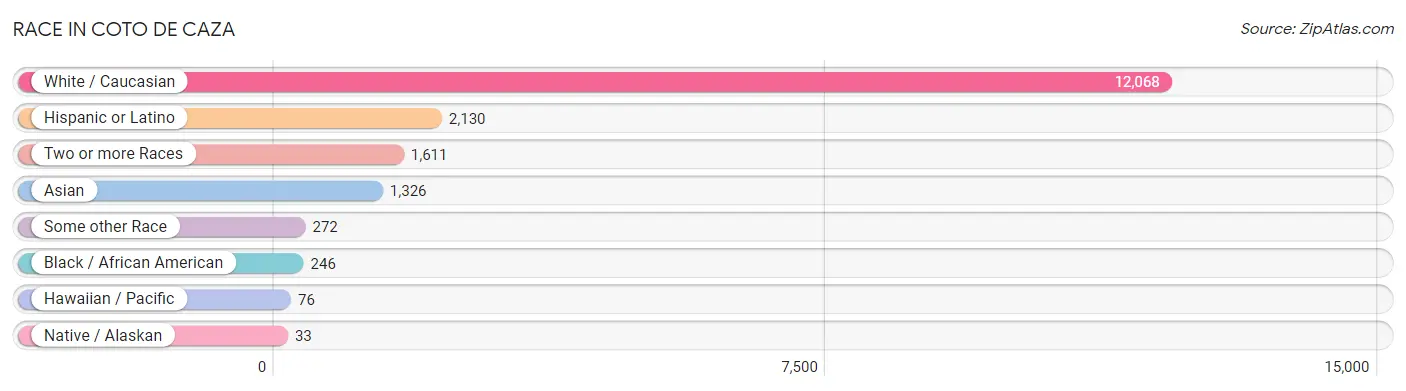
| Race | # Population | % Population |
| Asian | 1,326 | 8.5% |
| Black / African American | 246 | 1.6% |
| Hawaiian / Pacific | 76 | 0.5% |
| Hispanic or Latino | 2,130 | 13.6% |
| Native / Alaskan | 33 | 0.2% |
| White / Caucasian | 12,068 | 77.2% |
| Two or more Races | 1,611 | 10.3% |
| Some other Race | 272 | 1.7% |
| Total | 15,632 | 100.0% |
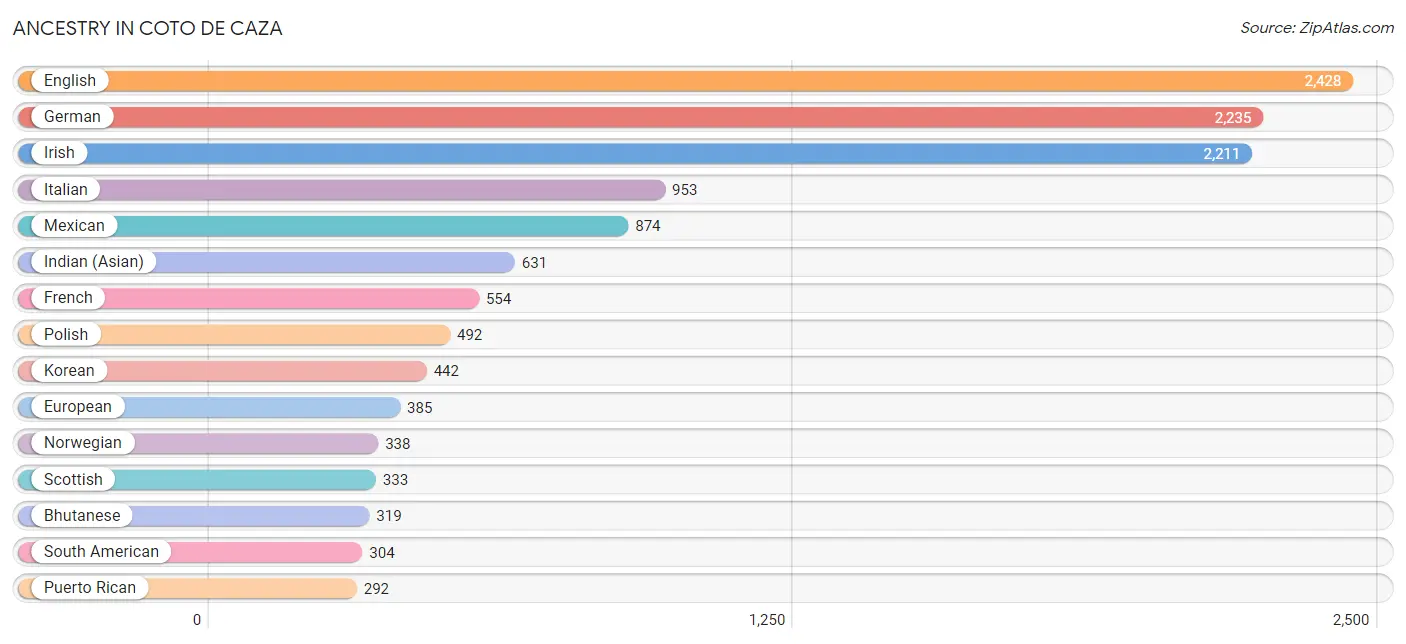
Ancestry in Coto de Caza
The most populous ancestries reported in Coto de Caza are English (2,428 | 15.5%), German (2,235 | 14.3%), Irish (2,211 | 14.1%), Italian (953 | 6.1%), and Mexican (874 | 5.6%), together accounting for 55.7% of all Coto de Caza residents.
| Ancestry | # Population | % Population |
| Afghan | 30 | 0.2% |
| African | 19 | 0.1% |
| American | 247 | 1.6% |
| Arab | 267 | 1.7% |
| Argentinean | 101 | 0.6% |
| Armenian | 82 | 0.5% |
| Australian | 16 | 0.1% |
| Austrian | 57 | 0.4% |
| Belgian | 2 | 0.0% |
| Bhutanese | 319 | 2.0% |
| Blackfeet | 9 | 0.1% |
| Brazilian | 35 | 0.2% |
| British | 169 | 1.1% |
| Burmese | 200 | 1.3% |
| Canadian | 135 | 0.9% |
| Central American | 61 | 0.4% |
| Cherokee | 51 | 0.3% |
| Chippewa | 18 | 0.1% |
| Colombian | 67 | 0.4% |
| Croatian | 62 | 0.4% |
| Cuban | 153 | 1.0% |
| Czech | 24 | 0.2% |
| Danish | 165 | 1.1% |
| Dutch | 83 | 0.5% |
| Eastern European | 29 | 0.2% |
| Ecuadorian | 56 | 0.4% |
| Egyptian | 156 | 1.0% |
| English | 2,428 | 15.5% |
| European | 385 | 2.5% |
| Filipino | 65 | 0.4% |
| Finnish | 37 | 0.2% |
| French | 554 | 3.5% |
| French Canadian | 47 | 0.3% |
| German | 2,235 | 14.3% |
| Greek | 110 | 0.7% |
| Guamanian / Chamorro | 27 | 0.2% |
| Guatemalan | 9 | 0.1% |
| Haitian | 9 | 0.1% |
| Hungarian | 163 | 1.0% |
| Indian (Asian) | 631 | 4.0% |
| Iranian | 215 | 1.4% |
| Irish | 2,211 | 14.1% |
| Italian | 953 | 6.1% |
| Korean | 442 | 2.8% |
| Latvian | 39 | 0.3% |
| Lebanese | 31 | 0.2% |
| Lithuanian | 30 | 0.2% |
| Luxembourger | 52 | 0.3% |
| Mexican | 874 | 5.6% |
| Mexican American Indian | 5 | 0.0% |
| Native Hawaiian | 48 | 0.3% |
| Nicaraguan | 9 | 0.1% |
| Northern European | 102 | 0.6% |
| Norwegian | 338 | 2.2% |
| Pakistani | 8 | 0.1% |
| Panamanian | 8 | 0.1% |
| Pennsylvania German | 12 | 0.1% |
| Peruvian | 80 | 0.5% |
| Polish | 492 | 3.2% |
| Portuguese | 46 | 0.3% |
| Puerto Rican | 292 | 1.9% |
| Romanian | 106 | 0.7% |
| Russian | 93 | 0.6% |
| Salvadoran | 35 | 0.2% |
| Scandinavian | 133 | 0.9% |
| Scotch-Irish | 149 | 0.9% |
| Scottish | 333 | 2.1% |
| Serbian | 10 | 0.1% |
| Slovene | 68 | 0.4% |
| South African | 10 | 0.1% |
| South American | 304 | 1.9% |
| Spaniard | 197 | 1.3% |
| Spanish | 17 | 0.1% |
| Sri Lankan | 57 | 0.4% |
| Subsaharan African | 85 | 0.5% |
| Swedish | 256 | 1.6% |
| Swiss | 71 | 0.4% |
| Thai | 53 | 0.3% |
| Turkish | 6 | 0.0% |
| Ugandan | 75 | 0.5% |
| Ukrainian | 48 | 0.3% |
| Welsh | 19 | 0.1% |
| Yugoslavian | 7 | 0.0% | View All 83 Rows |
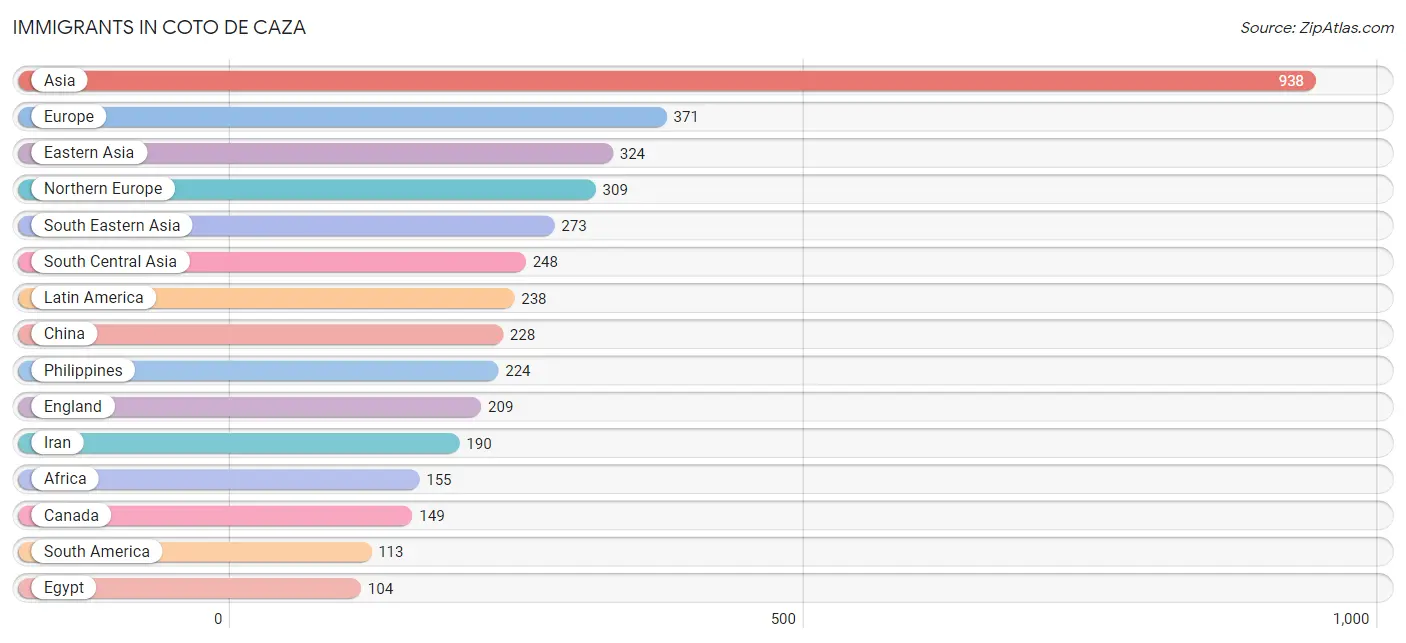
Immigrants in Coto de Caza
The most numerous immigrant groups reported in Coto de Caza came from Asia (938 | 6.0%), Europe (371 | 2.4%), Eastern Asia (324 | 2.1%), Northern Europe (309 | 2.0%), and South Eastern Asia (273 | 1.8%), together accounting for 14.2% of all Coto de Caza residents.
| Immigration Origin | # Population | % Population |
| Afghanistan | 22 | 0.1% |
| Africa | 155 | 1.0% |
| Argentina | 27 | 0.2% |
| Armenia | 28 | 0.2% |
| Asia | 938 | 6.0% |
| Belgium | 2 | 0.0% |
| Brazil | 35 | 0.2% |
| Canada | 149 | 0.9% |
| Caribbean | 35 | 0.2% |
| Central America | 90 | 0.6% |
| China | 228 | 1.5% |
| Colombia | 8 | 0.1% |
| Cuba | 26 | 0.2% |
| Czechoslovakia | 7 | 0.0% |
| Denmark | 9 | 0.1% |
| Eastern Africa | 46 | 0.3% |
| Eastern Asia | 324 | 2.1% |
| Eastern Europe | 60 | 0.4% |
| Ecuador | 22 | 0.1% |
| Egypt | 104 | 0.7% |
| El Salvador | 15 | 0.1% |
| England | 209 | 1.3% |
| Europe | 371 | 2.4% |
| Haiti | 9 | 0.1% |
| Hong Kong | 9 | 0.1% |
| India | 30 | 0.2% |
| Iran | 190 | 1.2% |
| Ireland | 29 | 0.2% |
| Japan | 22 | 0.1% |
| Korea | 74 | 0.5% |
| Kuwait | 6 | 0.0% |
| Latin America | 238 | 1.5% |
| Liberia | 5 | 0.0% |
| Malaysia | 7 | 0.0% |
| Mexico | 66 | 0.4% |
| Nicaragua | 9 | 0.1% |
| Northern Africa | 104 | 0.7% |
| Northern Europe | 309 | 2.0% |
| Peru | 21 | 0.1% |
| Philippines | 224 | 1.4% |
| Romania | 48 | 0.3% |
| Scotland | 18 | 0.1% |
| South America | 113 | 0.7% |
| South Central Asia | 248 | 1.6% |
| South Eastern Asia | 273 | 1.8% |
| Sri Lanka | 6 | 0.0% |
| Syria | 47 | 0.3% |
| Taiwan | 72 | 0.5% |
| Thailand | 8 | 0.1% |
| Uganda | 46 | 0.3% |
| Ukraine | 5 | 0.0% |
| Vietnam | 34 | 0.2% |
| Western Africa | 5 | 0.0% |
| Western Asia | 93 | 0.6% |
| Western Europe | 2 | 0.0% | View All 55 Rows |
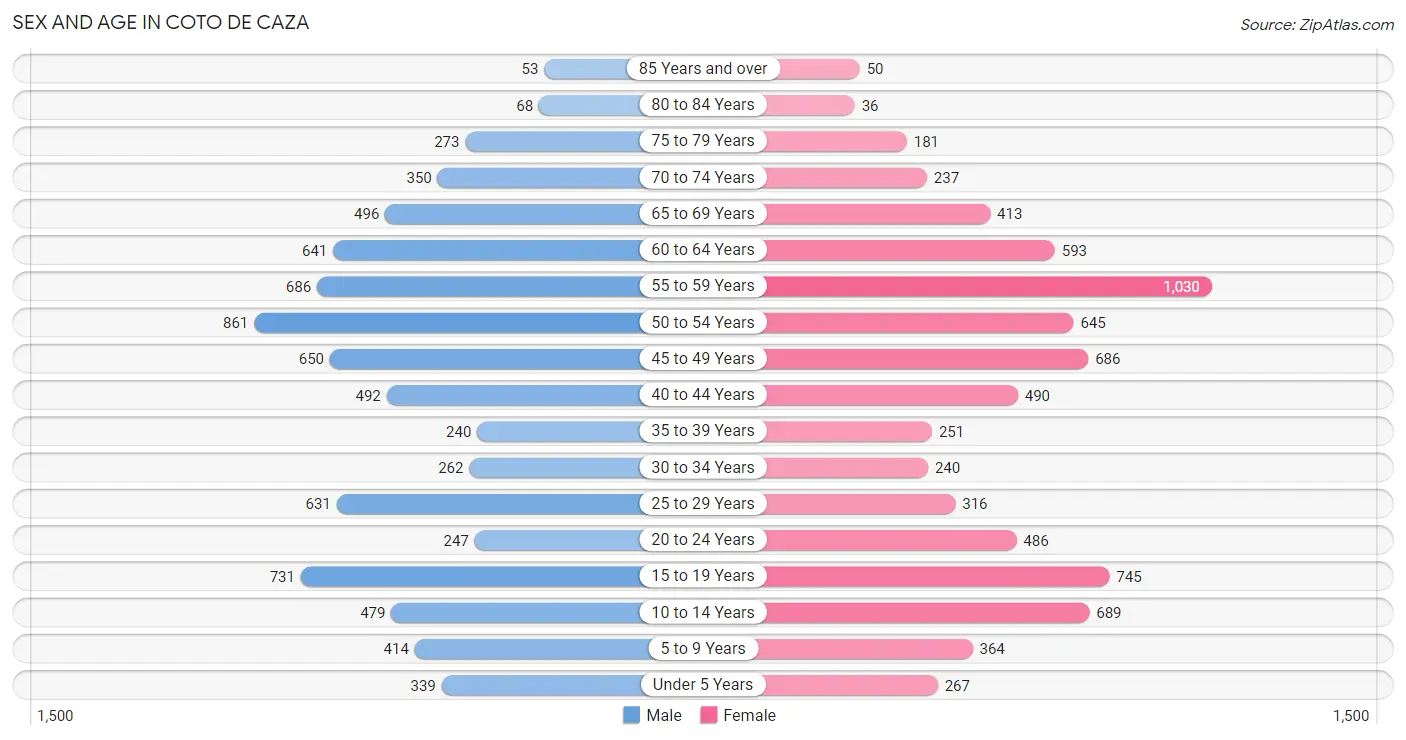
Sex and Age in Coto de Caza
Sex and Age in Coto de Caza
The most populous age groups in Coto de Caza are 50 to 54 Years (861 | 10.9%) for men and 55 to 59 Years (1,030 | 13.3%) for women.
| Age Bracket | Male | Female |
| Under 5 Years | 339 (4.3%) | 267 (3.5%) |
| 5 to 9 Years | 414 (5.2%) | 364 (4.7%) |
| 10 to 14 Years | 479 (6.0%) | 689 (8.9%) |
| 15 to 19 Years | 731 (9.2%) | 745 (9.7%) |
| 20 to 24 Years | 247 (3.1%) | 486 (6.3%) |
| 25 to 29 Years | 631 (8.0%) | 316 (4.1%) |
| 30 to 34 Years | 262 (3.3%) | 240 (3.1%) |
| 35 to 39 Years | 240 (3.0%) | 251 (3.3%) |
| 40 to 44 Years | 492 (6.2%) | 490 (6.4%) |
| 45 to 49 Years | 650 (8.2%) | 686 (8.9%) |
| 50 to 54 Years | 861 (10.9%) | 645 (8.4%) |
| 55 to 59 Years | 686 (8.7%) | 1,030 (13.3%) |
| 60 to 64 Years | 641 (8.1%) | 593 (7.7%) |
| 65 to 69 Years | 496 (6.3%) | 413 (5.3%) |
| 70 to 74 Years | 350 (4.4%) | 237 (3.1%) |
| 75 to 79 Years | 273 (3.5%) | 181 (2.3%) |
| 80 to 84 Years | 68 (0.9%) | 36 (0.5%) |
| 85 Years and over | 53 (0.7%) | 50 (0.6%) |
| Total | 7,913 (100.0%) | 7,719 (100.0%) |
Families and Households in Coto de Caza
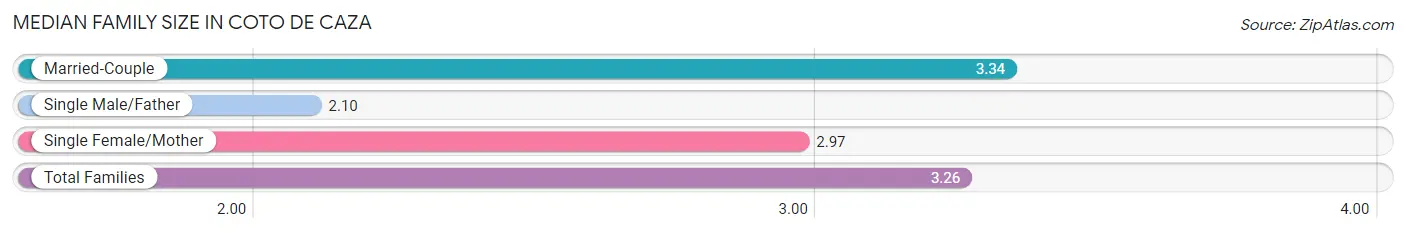
Median Family Size in Coto de Caza
The median family size in Coto de Caza is 3.26 persons per family, with married-couple families (3,998 | 89.2%) accounting for the largest median family size of 3.34 persons per family. On the other hand, single male/father families (205 | 4.6%) represent the smallest median family size with 2.10 persons per family.
| Family Type | # Families | Family Size |
| Married-Couple | 3,998 (89.2%) | 3.34 |
| Single Male/Father | 205 (4.6%) | 2.10 |
| Single Female/Mother | 277 (6.2%) | 2.97 |
| Total Families | 4,480 (100.0%) | 3.26 |
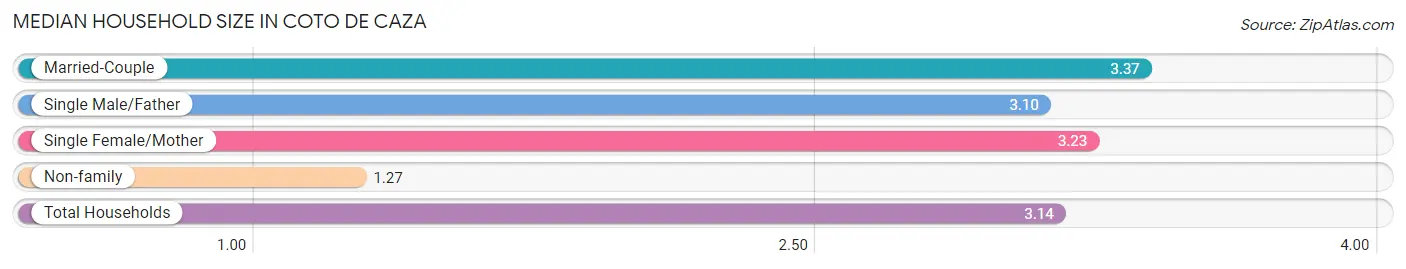
Median Household Size in Coto de Caza
The median household size in Coto de Caza is 3.14 persons per household, with married-couple households (3,998 | 80.2%) accounting for the largest median household size of 3.37 persons per household. non-family households (506 | 10.2%) represent the smallest median household size with 1.27 persons per household.
| Household Type | # Households | Household Size |
| Married-Couple | 3,998 (80.2%) | 3.37 |
| Single Male/Father | 205 (4.1%) | 3.10 |
| Single Female/Mother | 277 (5.6%) | 3.23 |
| Non-family | 506 (10.2%) | 1.27 |
| Total Households | 4,986 (100.0%) | 3.14 |
Household Size by Marriage Status in Coto de Caza
Out of a total of 4,986 households in Coto de Caza, 4,480 (89.8%) are family households, while 506 (10.2%) are nonfamily households. The most numerous type of family households are 2-person households, comprising 1,717, and the most common type of nonfamily households are 1-person households, comprising 399.
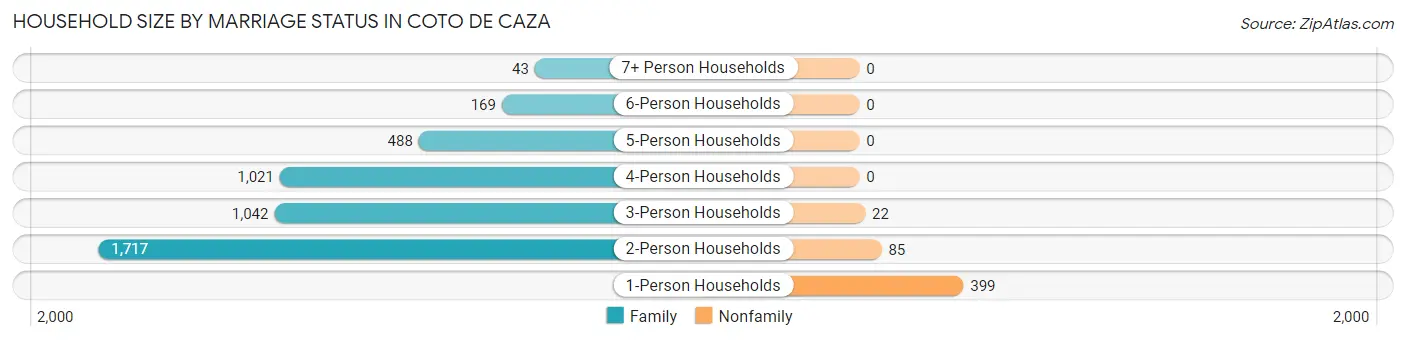
| Household Size | Family Households | Nonfamily Households |
| 1-Person Households | - | 399 (8.0%) |
| 2-Person Households | 1,717 (34.4%) | 85 (1.7%) |
| 3-Person Households | 1,042 (20.9%) | 22 (0.4%) |
| 4-Person Households | 1,021 (20.5%) | 0 (0.0%) |
| 5-Person Households | 488 (9.8%) | 0 (0.0%) |
| 6-Person Households | 169 (3.4%) | 0 (0.0%) |
| 7+ Person Households | 43 (0.9%) | 0 (0.0%) |
| Total | 4,480 (89.8%) | 506 (10.2%) |
Female Fertility in Coto de Caza
Fertility by Age in Coto de Caza
Average fertility rate in Coto de Caza is 63.0 births per 1,000 women. Women in the age bracket of 35 to 50 years have the highest fertility rate with 104.0 births per 1,000 women. Women in the age bracket of 35 to 50 years acount for 77.5% of all women with births.
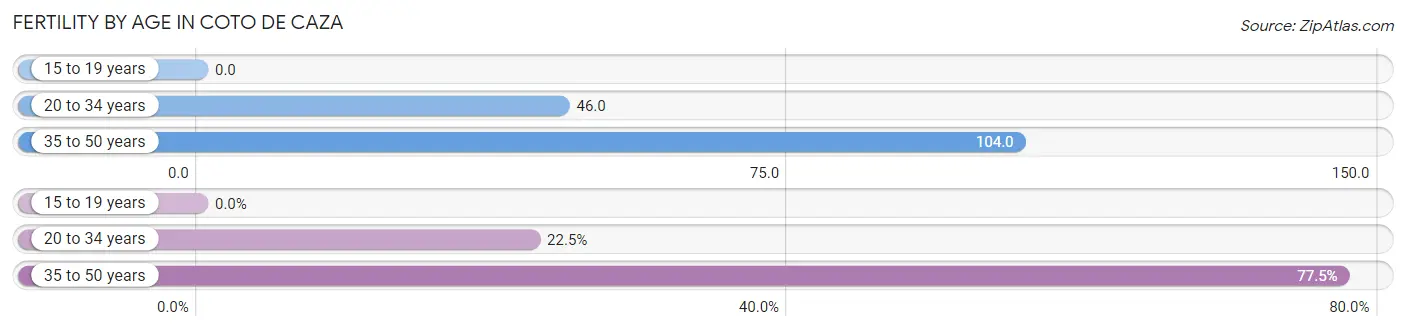
| Age Bracket | Women with Births | Births / 1,000 Women |
| 15 to 19 years | 0 (0.0%) | 0.0 |
| 20 to 34 years | 48 (22.5%) | 46.0 |
| 35 to 50 years | 165 (77.5%) | 104.0 |
| Total | 213 (100.0%) | 63.0 |
Fertility by Age by Marriage Status in Coto de Caza
79.8% of women with births (213) in Coto de Caza are married. The highest percentage of unmarried women with births falls into 20 to 34 years age bracket with 89.6% of them unmarried at the time of birth, while the lowest percentage of unmarried women with births belong to 35 to 50 years age bracket with 0.0% of them unmarried.
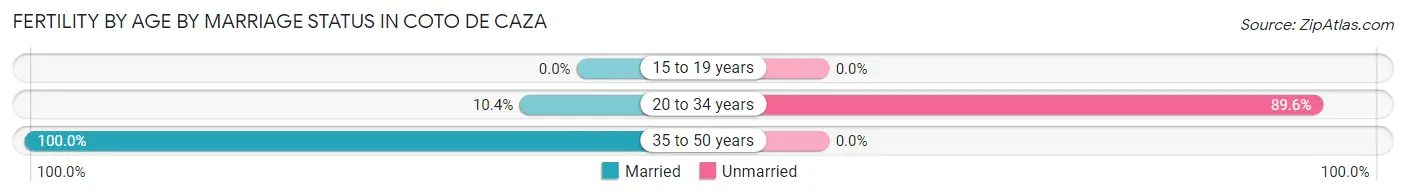
| Age Bracket | Married | Unmarried |
| 15 to 19 years | 0 (0.0%) | 0 (0.0%) |
| 20 to 34 years | 5 (10.4%) | 43 (89.6%) |
| 35 to 50 years | 165 (100.0%) | 0 (0.0%) |
| Total | 170 (79.8%) | 43 (20.2%) |
Fertility by Education in Coto de Caza
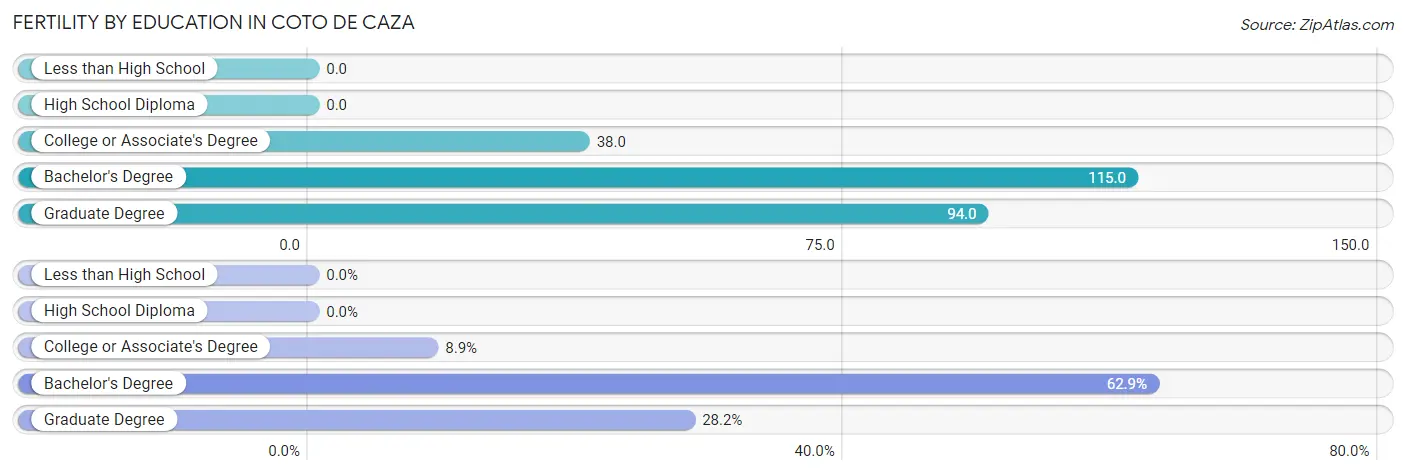
| Educational Attainment | Women with Births | Births / 1,000 Women |
| Less than High School | 0 (0.0%) | 0.0 |
| High School Diploma | 0 (0.0%) | 0.0 |
| College or Associate's Degree | 19 (8.9%) | 38.0 |
| Bachelor's Degree | 134 (62.9%) | 115.0 |
| Graduate Degree | 60 (28.2%) | 94.0 |
| Total | 213 (100.0%) | 63.0 |
Fertility by Education by Marriage Status in Coto de Caza
20.2% of women with births in Coto de Caza are unmarried. Women with the educational attainment of college or associate's degree are most likely to be married with 100.0% of them married at childbirth, while women with the educational attainment of graduate degree are least likely to be married with 71.7% of them unmarried at childbirth.
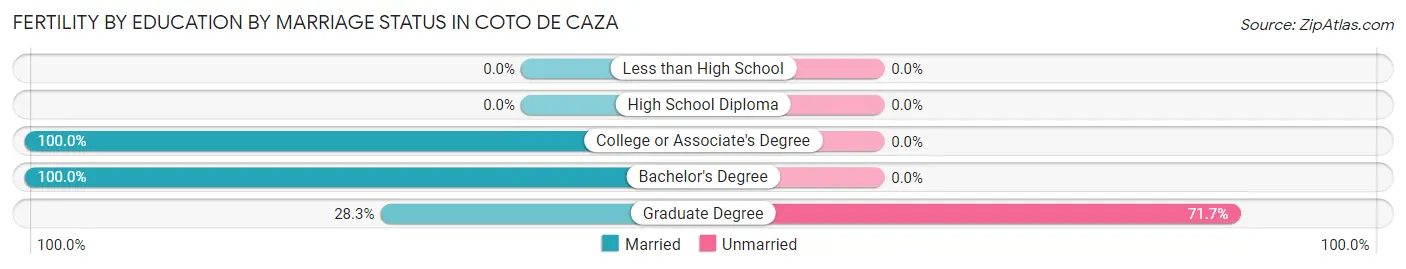
| Educational Attainment | Married | Unmarried |
| Less than High School | 0 (0.0%) | 0 (0.0%) |
| High School Diploma | 0 (0.0%) | 0 (0.0%) |
| College or Associate's Degree | 19 (100.0%) | 0 (0.0%) |
| Bachelor's Degree | 134 (100.0%) | 0 (0.0%) |
| Graduate Degree | 17 (28.3%) | 43 (71.7%) |
| Total | 170 (79.8%) | 43 (20.2%) |
Employment Characteristics in Coto de Caza
Employment by Class of Employer in Coto de Caza
Among the 8,038 employed individuals in Coto de Caza, private company employees (5,046 | 62.8%), self-employed (incorporated) (1,039 | 12.9%), and self-employed (not incorporated) (638 | 7.9%) make up the most common classes of employment.
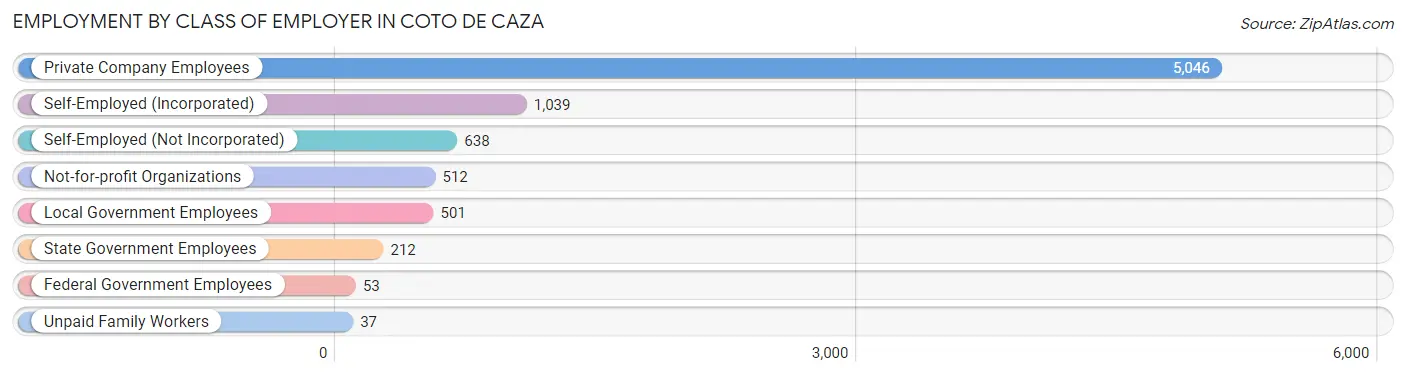
| Employer Class | # Employees | % Employees |
| Private Company Employees | 5,046 | 62.8% |
| Self-Employed (Incorporated) | 1,039 | 12.9% |
| Self-Employed (Not Incorporated) | 638 | 7.9% |
| Not-for-profit Organizations | 512 | 6.4% |
| Local Government Employees | 501 | 6.2% |
| State Government Employees | 212 | 2.6% |
| Federal Government Employees | 53 | 0.7% |
| Unpaid Family Workers | 37 | 0.5% |
| Total | 8,038 | 100.0% |
Employment Status by Age in Coto de Caza
According to the labor force statistics for Coto de Caza, out of the total population over 16 years of age (12,810), 67.0% or 8,583 individuals are in the labor force, with 4.2% or 360 of them unemployed. The age group with the highest labor force participation rate is 30 to 34 years, with 85.3% or 428 individuals in the labor force. Within the labor force, the 30 to 34 years age range has the highest percentage of unemployed individuals, with 25.5% or 109 of them being unemployed.
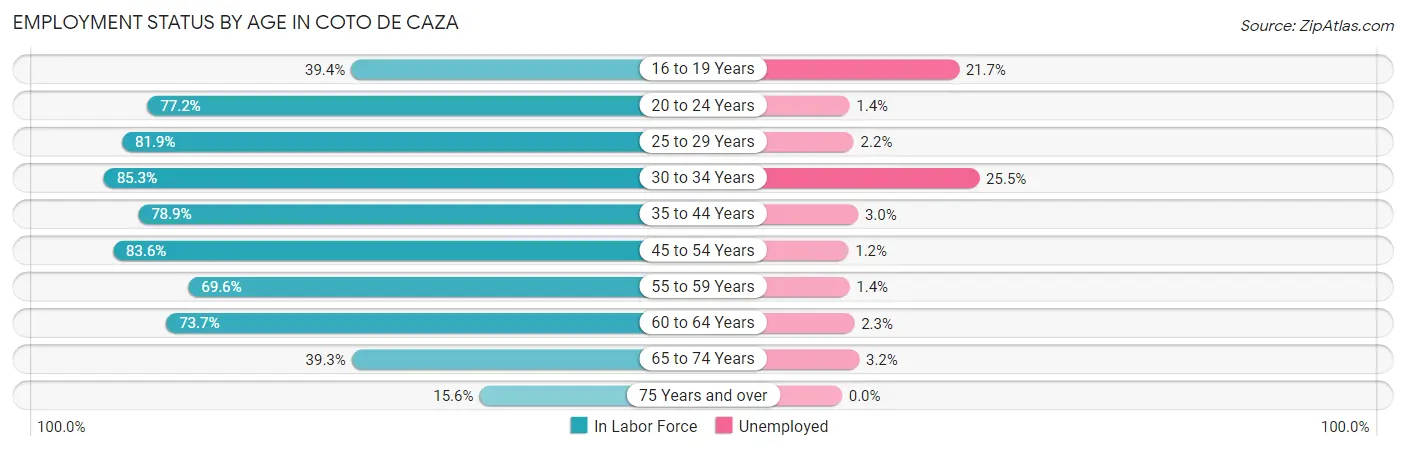
| Age Bracket | In Labor Force | Unemployed |
| 16 to 19 Years | 475 (39.4%) | 103 (21.7%) |
| 20 to 24 Years | 566 (77.2%) | 8 (1.4%) |
| 25 to 29 Years | 776 (81.9%) | 17 (2.2%) |
| 30 to 34 Years | 428 (85.3%) | 109 (25.5%) |
| 35 to 44 Years | 1,162 (78.9%) | 35 (3.0%) |
| 45 to 54 Years | 2,376 (83.6%) | 29 (1.2%) |
| 55 to 59 Years | 1,194 (69.6%) | 17 (1.4%) |
| 60 to 64 Years | 909 (73.7%) | 21 (2.3%) |
| 65 to 74 Years | 588 (39.3%) | 19 (3.2%) |
| 75 Years and over | 103 (15.6%) | 0 (0.0%) |
| Total | 8,583 (67.0%) | 360 (4.2%) |
Employment Status by Educational Attainment in Coto de Caza
According to labor force statistics for Coto de Caza, 78.6% of individuals (6,849) out of the total population between 25 and 64 years of age (8,714) are in the labor force, with 3.3% or 226 of them being unemployed. The group with the highest labor force participation rate are those with the educational attainment of bachelor's degree or higher, with 81.8% or 4,798 individuals in the labor force. Within the labor force, individuals with bachelor's degree or higher education have the highest percentage of unemployment, with 3.8% or 182 of them being unemployed.
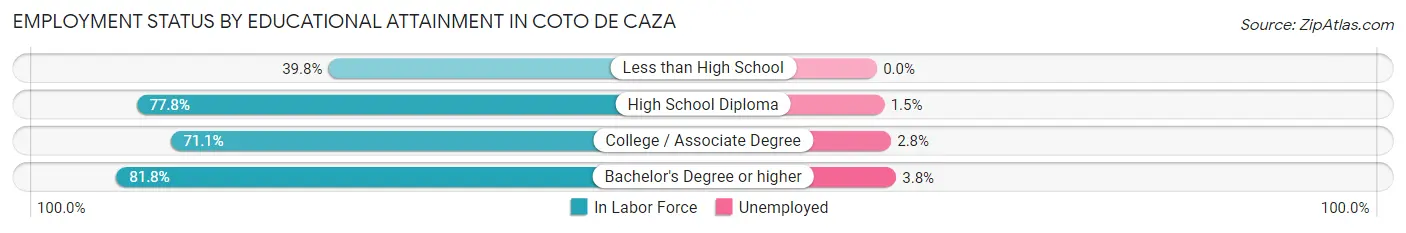
| Educational Attainment | In Labor Force | Unemployed |
| Less than High School | 45 (39.8%) | 0 (0.0%) |
| High School Diploma | 673 (77.8%) | 13 (1.5%) |
| College / Associate Degree | 1,330 (71.1%) | 52 (2.8%) |
| Bachelor's Degree or higher | 4,798 (81.8%) | 223 (3.8%) |
| Total | 6,849 (78.6%) | 288 (3.3%) |
Employment Occupations by Sex in Coto de Caza
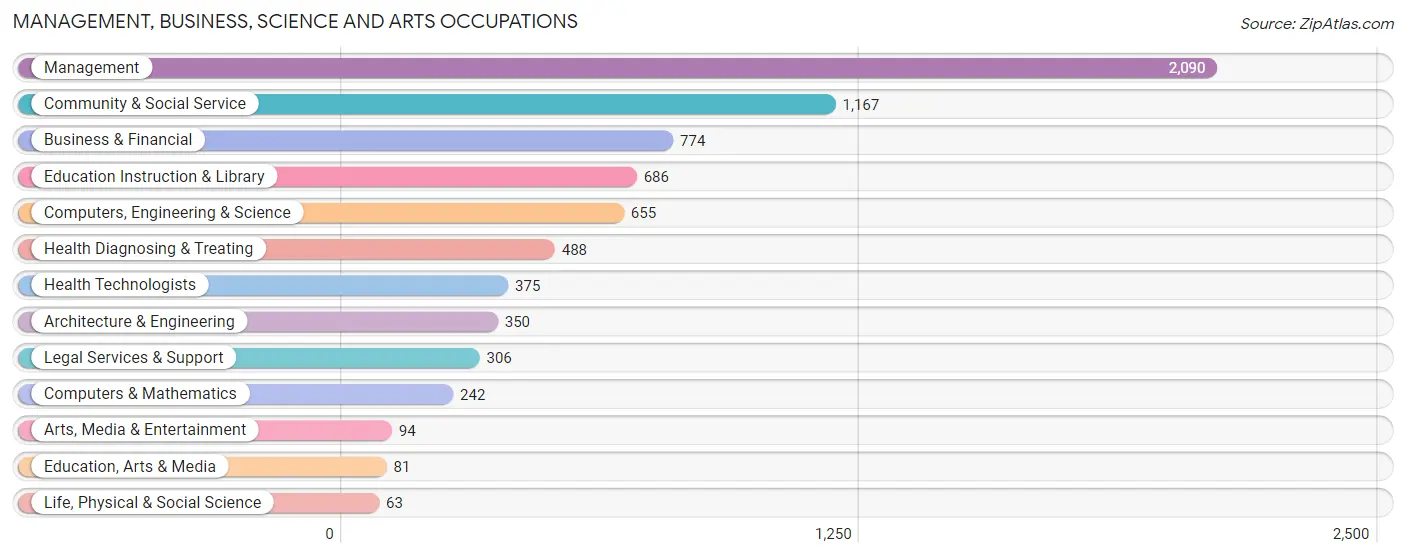
Management, Business, Science and Arts Occupations
The most common Management, Business, Science and Arts occupations in Coto de Caza are Management (2,090 | 25.4%), Community & Social Service (1,167 | 14.2%), Business & Financial (774 | 9.4%), Education Instruction & Library (686 | 8.4%), and Computers, Engineering & Science (655 | 8.0%).
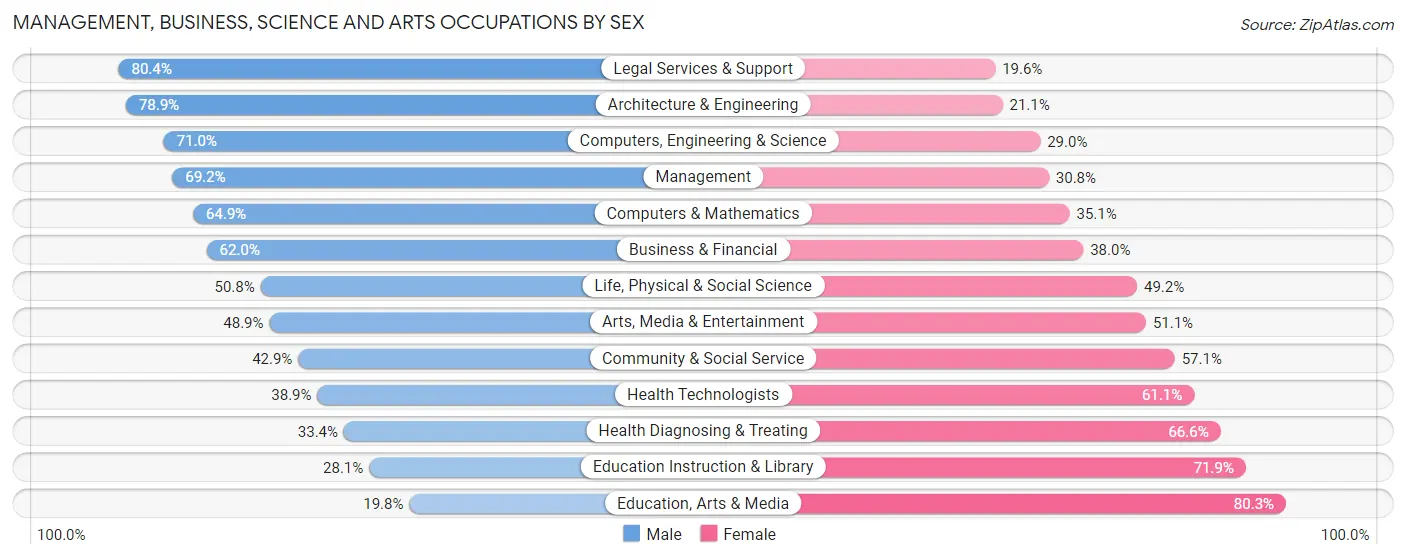
Management, Business, Science and Arts Occupations by Sex
Within the Management, Business, Science and Arts occupations in Coto de Caza, the most male-oriented occupations are Legal Services & Support (80.4%), Architecture & Engineering (78.9%), and Computers, Engineering & Science (71.0%), while the most female-oriented occupations are Education, Arts & Media (80.2%), Education Instruction & Library (71.9%), and Health Diagnosing & Treating (66.6%).
| Occupation | Male | Female |
| Management | 1,446 (69.2%) | 644 (30.8%) |
| Business & Financial | 480 (62.0%) | 294 (38.0%) |
| Computers, Engineering & Science | 465 (71.0%) | 190 (29.0%) |
| Computers & Mathematics | 157 (64.9%) | 85 (35.1%) |
| Architecture & Engineering | 276 (78.9%) | 74 (21.1%) |
| Life, Physical & Social Science | 32 (50.8%) | 31 (49.2%) |
| Community & Social Service | 501 (42.9%) | 666 (57.1%) |
| Education, Arts & Media | 16 (19.8%) | 65 (80.2%) |
| Legal Services & Support | 246 (80.4%) | 60 (19.6%) |
| Education Instruction & Library | 193 (28.1%) | 493 (71.9%) |
| Arts, Media & Entertainment | 46 (48.9%) | 48 (51.1%) |
| Health Diagnosing & Treating | 163 (33.4%) | 325 (66.6%) |
| Health Technologists | 146 (38.9%) | 229 (61.1%) |
| Total (Category) | 3,055 (59.1%) | 2,119 (40.9%) |
| Total (Overall) | 4,648 (56.6%) | 3,571 (43.4%) |
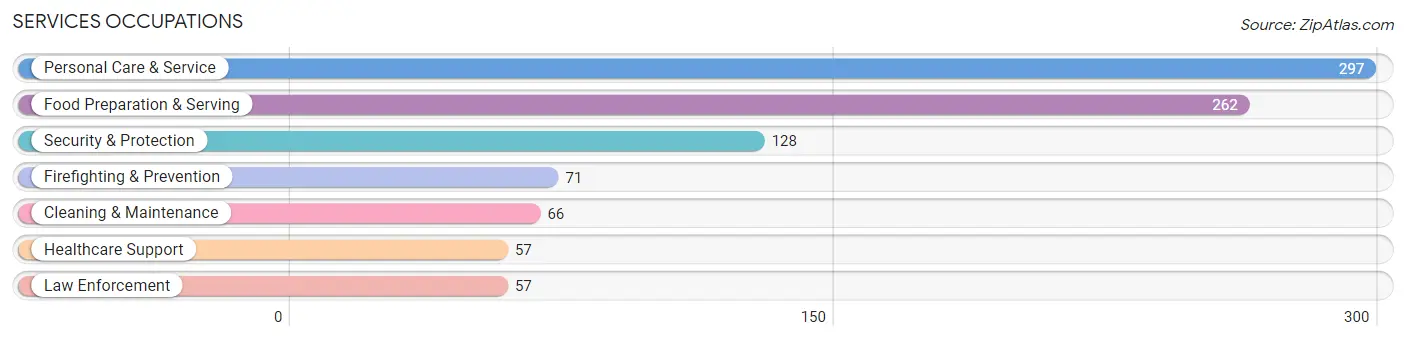
Services Occupations
The most common Services occupations in Coto de Caza are Personal Care & Service (297 | 3.6%), Food Preparation & Serving (262 | 3.2%), Security & Protection (128 | 1.6%), Firefighting & Prevention (71 | 0.9%), and Cleaning & Maintenance (66 | 0.8%).
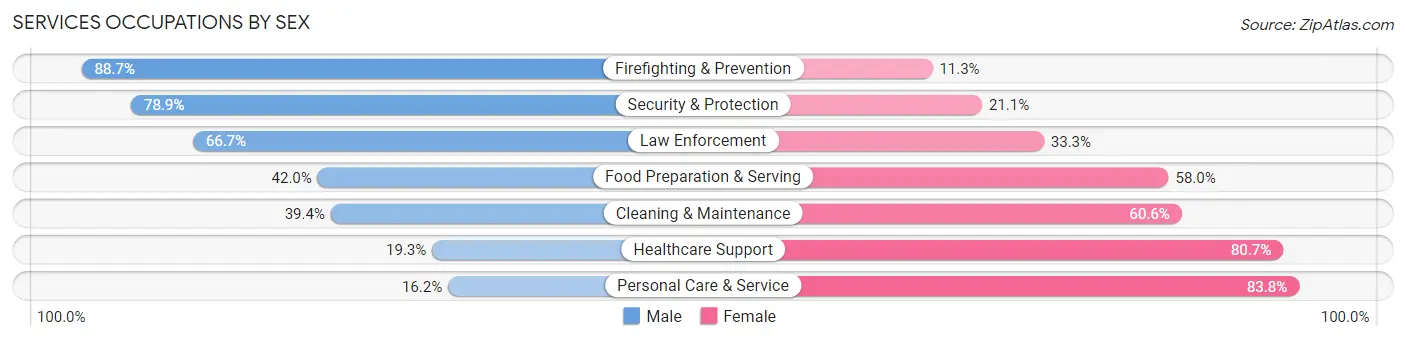
Services Occupations by Sex
Within the Services occupations in Coto de Caza, the most male-oriented occupations are Firefighting & Prevention (88.7%), Security & Protection (78.9%), and Law Enforcement (66.7%), while the most female-oriented occupations are Personal Care & Service (83.8%), Healthcare Support (80.7%), and Cleaning & Maintenance (60.6%).
| Occupation | Male | Female |
| Healthcare Support | 11 (19.3%) | 46 (80.7%) |
| Security & Protection | 101 (78.9%) | 27 (21.1%) |
| Firefighting & Prevention | 63 (88.7%) | 8 (11.3%) |
| Law Enforcement | 38 (66.7%) | 19 (33.3%) |
| Food Preparation & Serving | 110 (42.0%) | 152 (58.0%) |
| Cleaning & Maintenance | 26 (39.4%) | 40 (60.6%) |
| Personal Care & Service | 48 (16.2%) | 249 (83.8%) |
| Total (Category) | 296 (36.5%) | 514 (63.5%) |
| Total (Overall) | 4,648 (56.6%) | 3,571 (43.4%) |
Sales and Office Occupations
The most common Sales and Office occupations in Coto de Caza are Sales & Related (967 | 11.8%), and Office & Administration (751 | 9.1%).

Sales and Office Occupations by Sex
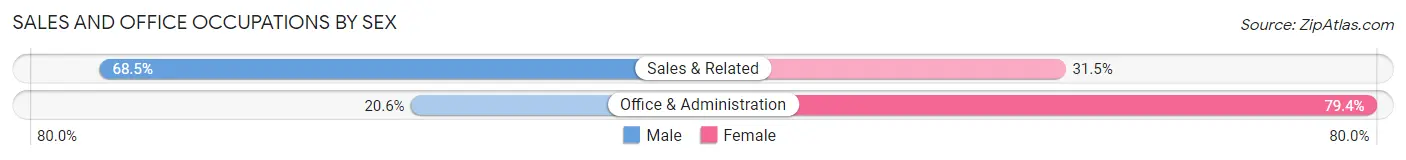
| Occupation | Male | Female |
| Sales & Related | 662 (68.5%) | 305 (31.5%) |
| Office & Administration | 155 (20.6%) | 596 (79.4%) |
| Total (Category) | 817 (47.6%) | 901 (52.4%) |
| Total (Overall) | 4,648 (56.6%) | 3,571 (43.4%) |
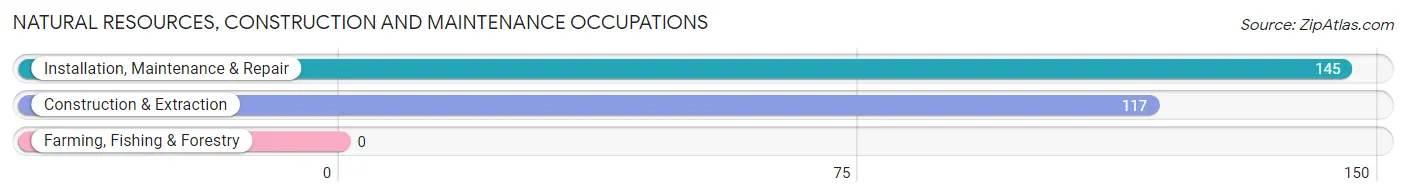
Natural Resources, Construction and Maintenance Occupations
The most common Natural Resources, Construction and Maintenance occupations in Coto de Caza are Installation, Maintenance & Repair (145 | 1.8%), and Construction & Extraction (117 | 1.4%).
Natural Resources, Construction and Maintenance Occupations by Sex
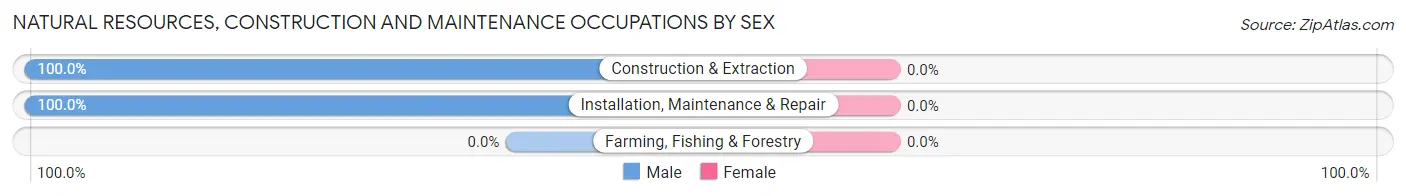
| Occupation | Male | Female |
| Farming, Fishing & Forestry | 0 (0.0%) | 0 (0.0%) |
| Construction & Extraction | 117 (100.0%) | 0 (0.0%) |
| Installation, Maintenance & Repair | 145 (100.0%) | 0 (0.0%) |
| Total (Category) | 262 (100.0%) | 0 (0.0%) |
| Total (Overall) | 4,648 (56.6%) | 3,571 (43.4%) |
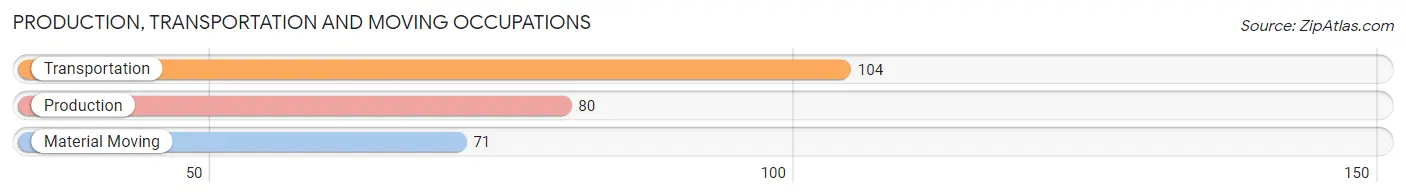
Production, Transportation and Moving Occupations
The most common Production, Transportation and Moving occupations in Coto de Caza are Transportation (104 | 1.3%), Production (80 | 1.0%), and Material Moving (71 | 0.9%).
Production, Transportation and Moving Occupations by Sex
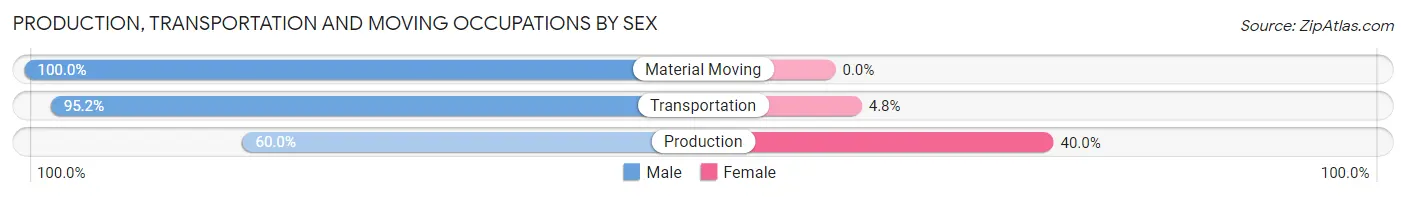
| Occupation | Male | Female |
| Production | 48 (60.0%) | 32 (40.0%) |
| Transportation | 99 (95.2%) | 5 (4.8%) |
| Material Moving | 71 (100.0%) | 0 (0.0%) |
| Total (Category) | 218 (85.5%) | 37 (14.5%) |
| Total (Overall) | 4,648 (56.6%) | 3,571 (43.4%) |
Employment Industries by Sex in Coto de Caza
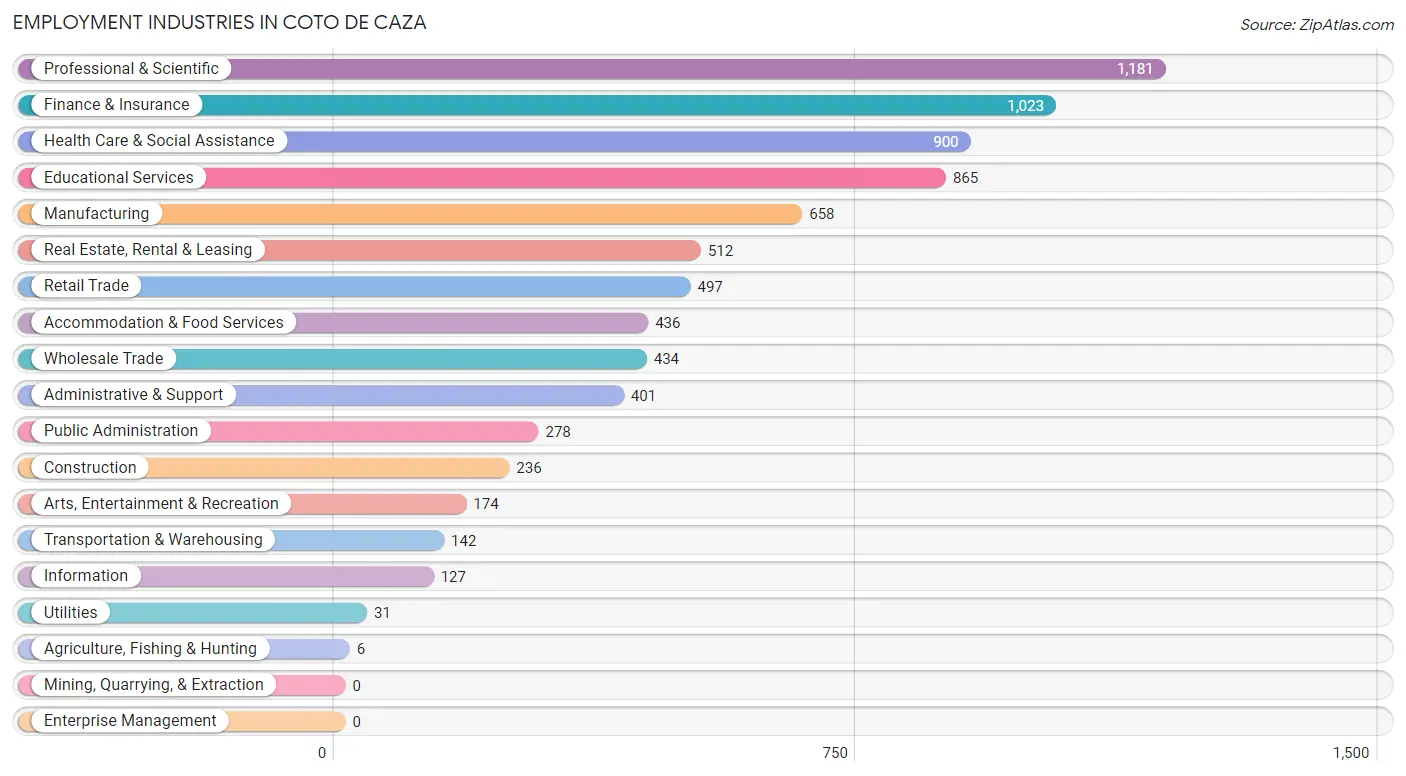
Employment Industries in Coto de Caza
The major employment industries in Coto de Caza include Professional & Scientific (1,181 | 14.4%), Finance & Insurance (1,023 | 12.4%), Health Care & Social Assistance (900 | 11.0%), Educational Services (865 | 10.5%), and Manufacturing (658 | 8.0%).
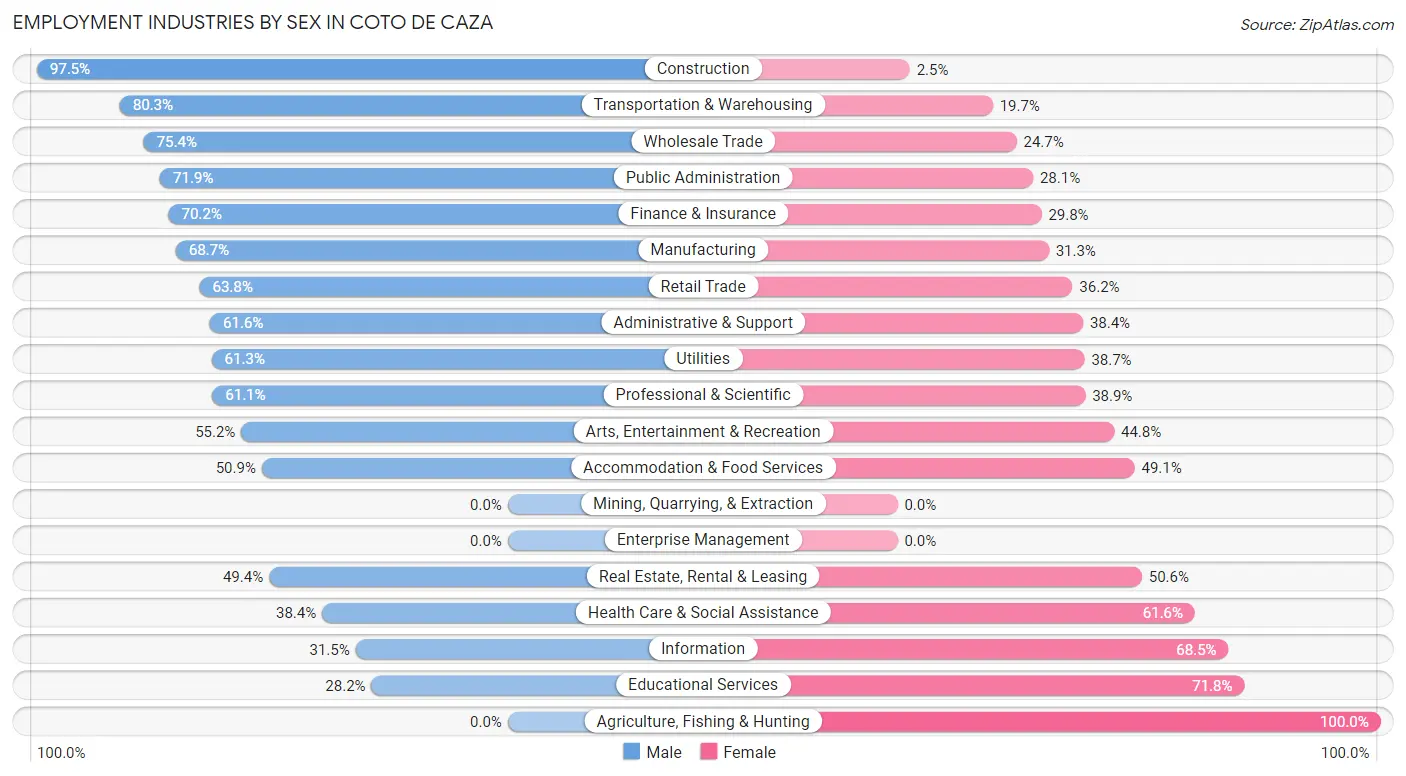
Employment Industries by Sex in Coto de Caza
The Coto de Caza industries that see more men than women are Construction (97.5%), Transportation & Warehousing (80.3%), and Wholesale Trade (75.3%), whereas the industries that tend to have a higher number of women are Agriculture, Fishing & Hunting (100.0%), Educational Services (71.8%), and Information (68.5%).
| Industry | Male | Female |
| Agriculture, Fishing & Hunting | 0 (0.0%) | 6 (100.0%) |
| Mining, Quarrying, & Extraction | 0 (0.0%) | 0 (0.0%) |
| Construction | 230 (97.5%) | 6 (2.5%) |
| Manufacturing | 452 (68.7%) | 206 (31.3%) |
| Wholesale Trade | 327 (75.3%) | 107 (24.6%) |
| Retail Trade | 317 (63.8%) | 180 (36.2%) |
| Transportation & Warehousing | 114 (80.3%) | 28 (19.7%) |
| Utilities | 19 (61.3%) | 12 (38.7%) |
| Information | 40 (31.5%) | 87 (68.5%) |
| Finance & Insurance | 718 (70.2%) | 305 (29.8%) |
| Real Estate, Rental & Leasing | 253 (49.4%) | 259 (50.6%) |
| Professional & Scientific | 722 (61.1%) | 459 (38.9%) |
| Enterprise Management | 0 (0.0%) | 0 (0.0%) |
| Administrative & Support | 247 (61.6%) | 154 (38.4%) |
| Educational Services | 244 (28.2%) | 621 (71.8%) |
| Health Care & Social Assistance | 346 (38.4%) | 554 (61.6%) |
| Arts, Entertainment & Recreation | 96 (55.2%) | 78 (44.8%) |
| Accommodation & Food Services | 222 (50.9%) | 214 (49.1%) |
| Public Administration | 200 (71.9%) | 78 (28.1%) |
| Total | 4,648 (56.6%) | 3,571 (43.4%) |
Education in Coto de Caza
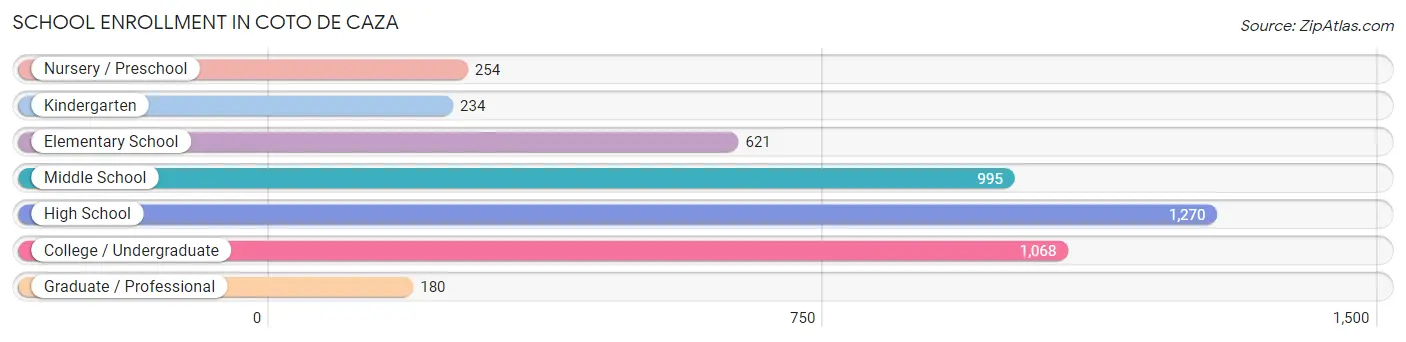
School Enrollment in Coto de Caza
The most common levels of schooling among the 4,622 students in Coto de Caza are high school (1,270 | 27.5%), college / undergraduate (1,068 | 23.1%), and middle school (995 | 21.5%).
| School Level | # Students | % Students |
| Nursery / Preschool | 254 | 5.5% |
| Kindergarten | 234 | 5.1% |
| Elementary School | 621 | 13.4% |
| Middle School | 995 | 21.5% |
| High School | 1,270 | 27.5% |
| College / Undergraduate | 1,068 | 23.1% |
| Graduate / Professional | 180 | 3.9% |
| Total | 4,622 | 100.0% |
School Enrollment by Age by Funding Source in Coto de Caza
Out of a total of 4,622 students who are enrolled in schools in Coto de Caza, 1,285 (27.8%) attend a private institution, while the remaining 3,337 (72.2%) are enrolled in public schools. The age group of 3 to 4 year olds has the highest likelihood of being enrolled in private schools, with 213 (91.8% in the age bracket) enrolled. Conversely, the age group of 20 to 24 year olds has the lowest likelihood of being enrolled in a private school, with 349 (88.1% in the age bracket) attending a public institution.
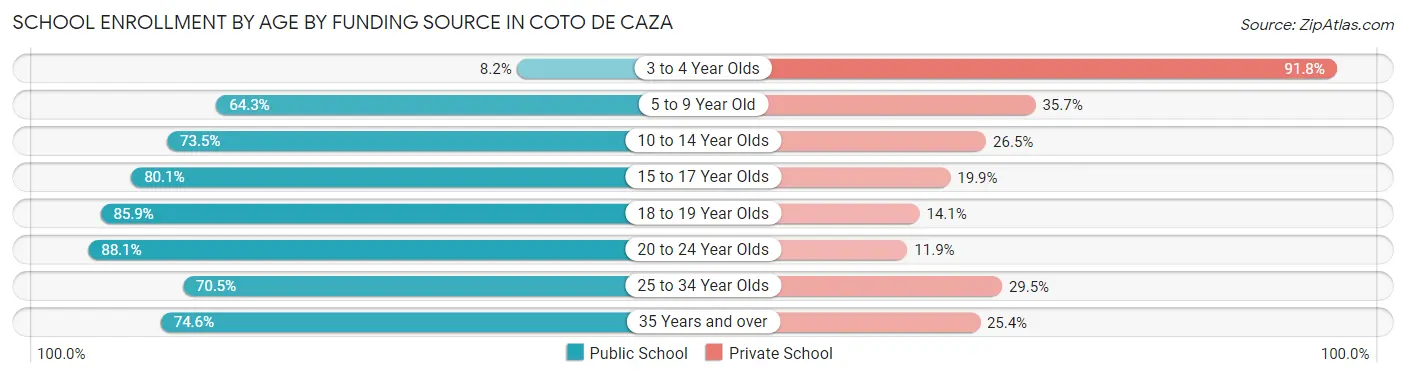
| Age Bracket | Public School | Private School |
| 3 to 4 Year Olds | 19 (8.2%) | 213 (91.8%) |
| 5 to 9 Year Old | 500 (64.3%) | 278 (35.7%) |
| 10 to 14 Year Olds | 858 (73.5%) | 310 (26.5%) |
| 15 to 17 Year Olds | 758 (80.1%) | 188 (19.9%) |
| 18 to 19 Year Olds | 389 (85.9%) | 64 (14.1%) |
| 20 to 24 Year Olds | 349 (88.1%) | 47 (11.9%) |
| 25 to 34 Year Olds | 366 (70.5%) | 153 (29.5%) |
| 35 Years and over | 97 (74.6%) | 33 (25.4%) |
| Total | 3,337 (72.2%) | 1,285 (27.8%) |
Educational Attainment by Field of Study in Coto de Caza
Business (1,779 | 23.1%), social sciences (952 | 12.3%), engineering (688 | 8.9%), psychology (657 | 8.5%), and science & technology (586 | 7.6%) are the most common fields of study among 7,717 individuals in Coto de Caza who have obtained a bachelor's degree or higher.
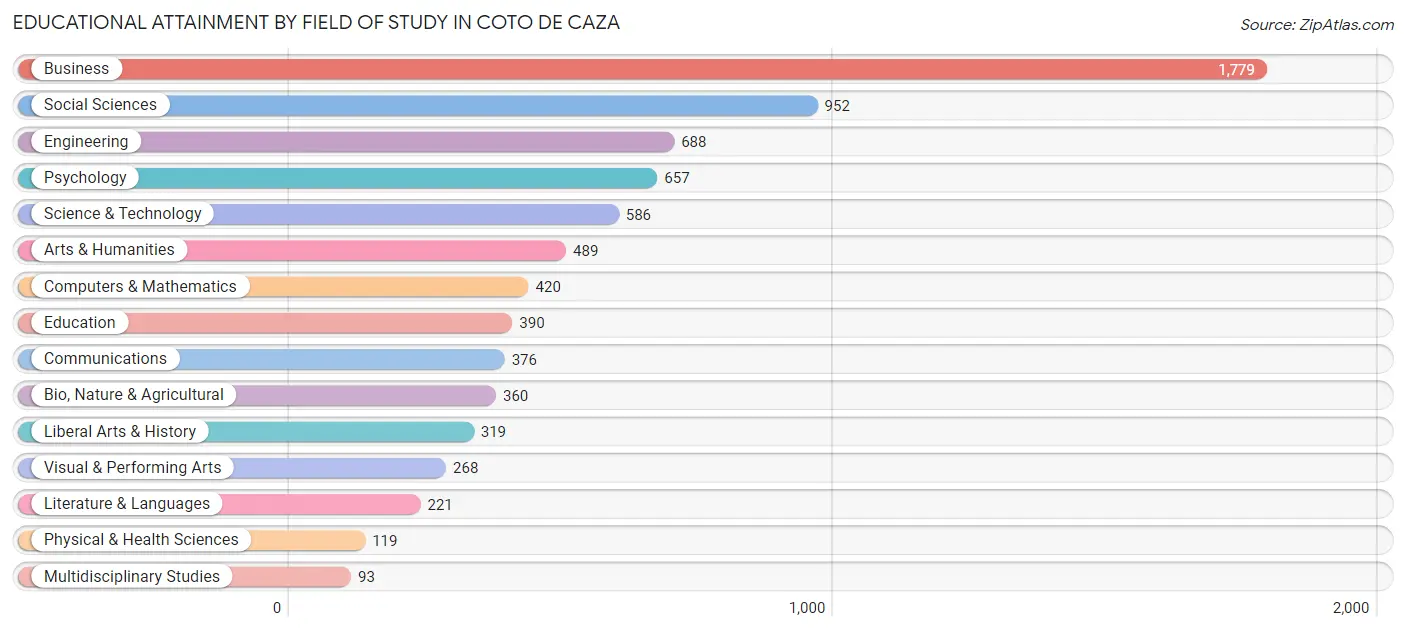
| Field of Study | # Graduates | % Graduates |
| Computers & Mathematics | 420 | 5.4% |
| Bio, Nature & Agricultural | 360 | 4.7% |
| Physical & Health Sciences | 119 | 1.5% |
| Psychology | 657 | 8.5% |
| Social Sciences | 952 | 12.3% |
| Engineering | 688 | 8.9% |
| Multidisciplinary Studies | 93 | 1.2% |
| Science & Technology | 586 | 7.6% |
| Business | 1,779 | 23.1% |
| Education | 390 | 5.1% |
| Literature & Languages | 221 | 2.9% |
| Liberal Arts & History | 319 | 4.1% |
| Visual & Performing Arts | 268 | 3.5% |
| Communications | 376 | 4.9% |
| Arts & Humanities | 489 | 6.3% |
| Total | 7,717 | 100.0% |
Transportation & Commute in Coto de Caza
Vehicle Availability by Sex in Coto de Caza
The most prevalent vehicle ownership categories in Coto de Caza are males with 2 vehicles (1,774, accounting for 38.8%) and females with 2 vehicles (1,282, making up 51.1%).
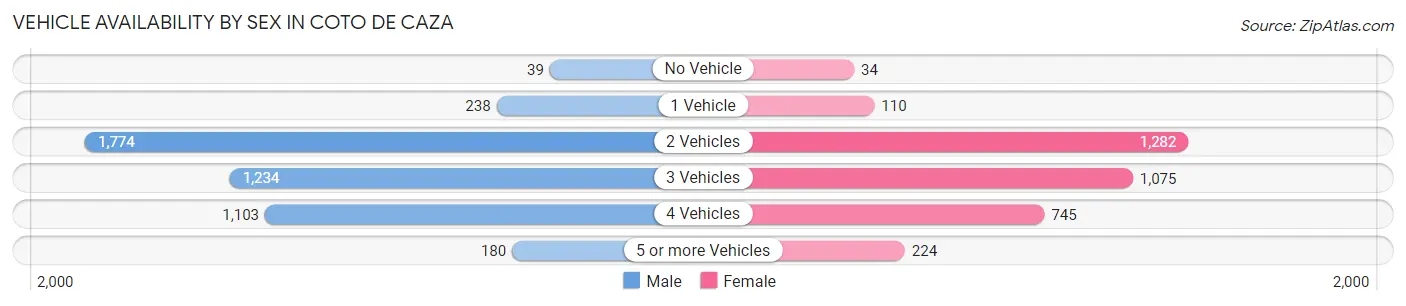
| Vehicles Available | Male | Female |
| No Vehicle | 39 (0.9%) | 34 (1.0%) |
| 1 Vehicle | 238 (5.2%) | 110 (3.2%) |
| 2 Vehicles | 1,774 (38.8%) | 1,282 (36.9%) |
| 3 Vehicles | 1,234 (27.0%) | 1,075 (31.0%) |
| 4 Vehicles | 1,103 (24.1%) | 745 (21.5%) |
| 5 or more Vehicles | 180 (3.9%) | 224 (6.5%) |
| Total | 4,568 (100.0%) | 3,470 (100.0%) |
Commute Time in Coto de Caza
The most frequently occuring commute durations in Coto de Caza are 30 to 34 minutes (1,058 commuters, 17.9%), 20 to 24 minutes (935 commuters, 15.8%), and 15 to 19 minutes (679 commuters, 11.5%).
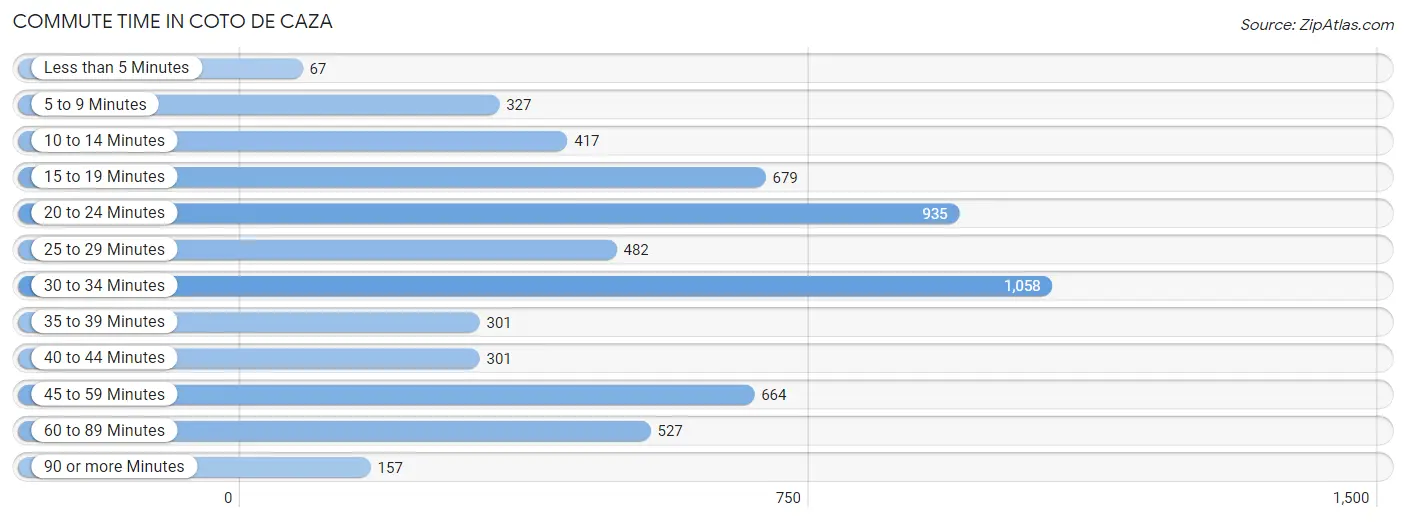
| Commute Time | # Commuters | % Commuters |
| Less than 5 Minutes | 67 | 1.1% |
| 5 to 9 Minutes | 327 | 5.5% |
| 10 to 14 Minutes | 417 | 7.0% |
| 15 to 19 Minutes | 679 | 11.5% |
| 20 to 24 Minutes | 935 | 15.8% |
| 25 to 29 Minutes | 482 | 8.2% |
| 30 to 34 Minutes | 1,058 | 17.9% |
| 35 to 39 Minutes | 301 | 5.1% |
| 40 to 44 Minutes | 301 | 5.1% |
| 45 to 59 Minutes | 664 | 11.2% |
| 60 to 89 Minutes | 527 | 8.9% |
| 90 or more Minutes | 157 | 2.6% |
Commute Time by Sex in Coto de Caza
The most common commute times in Coto de Caza are 30 to 34 minutes (757 commuters, 21.2%) for males and 20 to 24 minutes (390 commuters, 16.6%) for females.
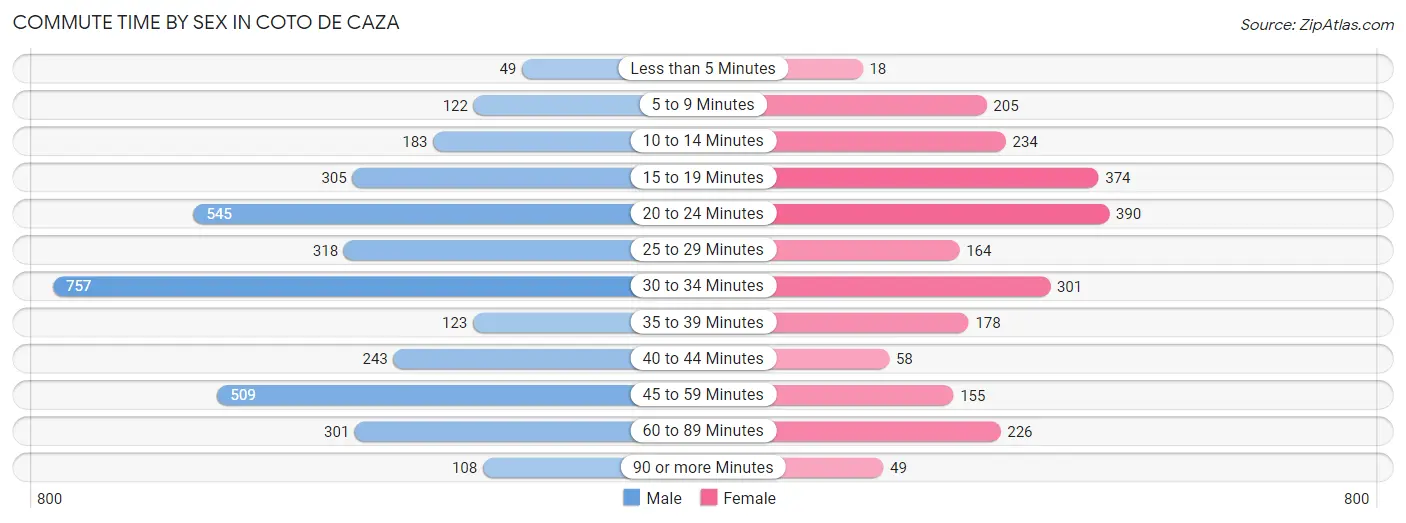
| Commute Time | Male | Female |
| Less than 5 Minutes | 49 (1.4%) | 18 (0.8%) |
| 5 to 9 Minutes | 122 (3.4%) | 205 (8.7%) |
| 10 to 14 Minutes | 183 (5.1%) | 234 (10.0%) |
| 15 to 19 Minutes | 305 (8.6%) | 374 (15.9%) |
| 20 to 24 Minutes | 545 (15.3%) | 390 (16.6%) |
| 25 to 29 Minutes | 318 (8.9%) | 164 (7.0%) |
| 30 to 34 Minutes | 757 (21.2%) | 301 (12.8%) |
| 35 to 39 Minutes | 123 (3.5%) | 178 (7.6%) |
| 40 to 44 Minutes | 243 (6.8%) | 58 (2.5%) |
| 45 to 59 Minutes | 509 (14.3%) | 155 (6.6%) |
| 60 to 89 Minutes | 301 (8.5%) | 226 (9.6%) |
| 90 or more Minutes | 108 (3.0%) | 49 (2.1%) |
Time of Departure to Work by Sex in Coto de Caza
The most frequent times of departure to work in Coto de Caza are 7:30 AM to 7:59 AM (617, 17.3%) for males and 7:00 AM to 7:29 AM (420, 17.9%) for females.
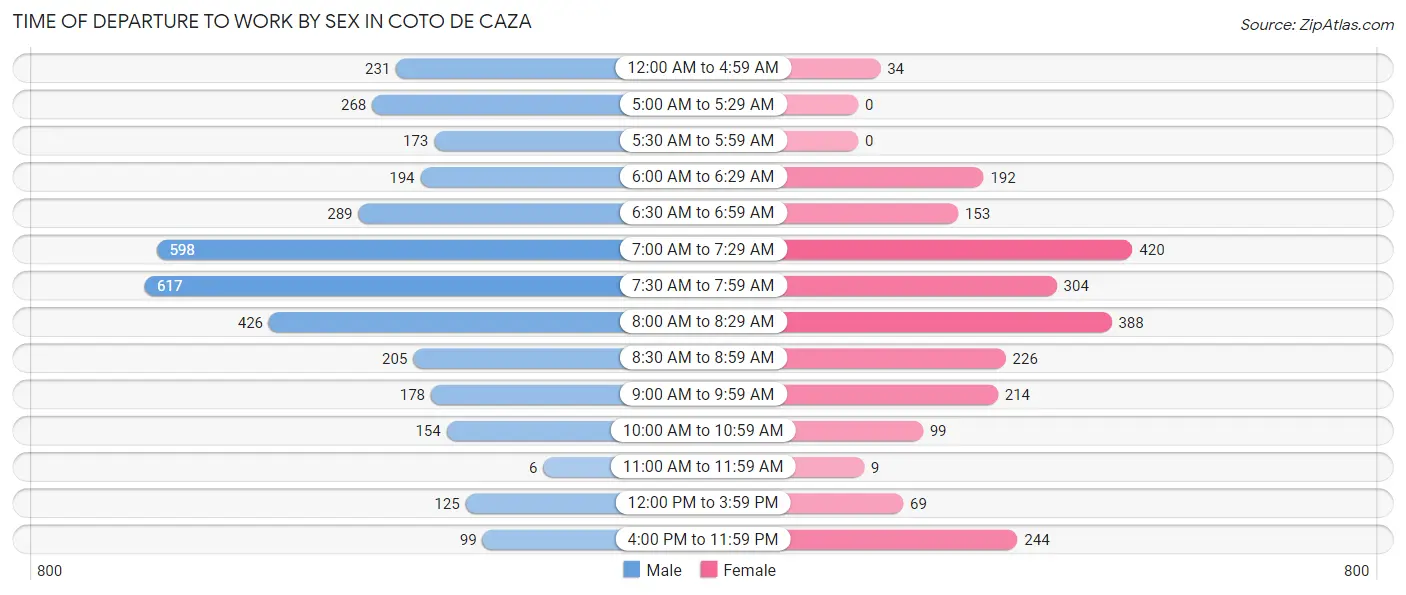
| Time of Departure | Male | Female |
| 12:00 AM to 4:59 AM | 231 (6.5%) | 34 (1.5%) |
| 5:00 AM to 5:29 AM | 268 (7.5%) | 0 (0.0%) |
| 5:30 AM to 5:59 AM | 173 (4.9%) | 0 (0.0%) |
| 6:00 AM to 6:29 AM | 194 (5.4%) | 192 (8.2%) |
| 6:30 AM to 6:59 AM | 289 (8.1%) | 153 (6.5%) |
| 7:00 AM to 7:29 AM | 598 (16.8%) | 420 (17.9%) |
| 7:30 AM to 7:59 AM | 617 (17.3%) | 304 (12.9%) |
| 8:00 AM to 8:29 AM | 426 (12.0%) | 388 (16.5%) |
| 8:30 AM to 8:59 AM | 205 (5.8%) | 226 (9.6%) |
| 9:00 AM to 9:59 AM | 178 (5.0%) | 214 (9.1%) |
| 10:00 AM to 10:59 AM | 154 (4.3%) | 99 (4.2%) |
| 11:00 AM to 11:59 AM | 6 (0.2%) | 9 (0.4%) |
| 12:00 PM to 3:59 PM | 125 (3.5%) | 69 (2.9%) |
| 4:00 PM to 11:59 PM | 99 (2.8%) | 244 (10.4%) |
| Total | 3,563 (100.0%) | 2,352 (100.0%) |
Housing Occupancy in Coto de Caza
Occupancy by Ownership in Coto de Caza
Of the total 4,986 dwellings in Coto de Caza, owner-occupied units account for 4,500 (90.2%), while renter-occupied units make up 486 (9.8%).
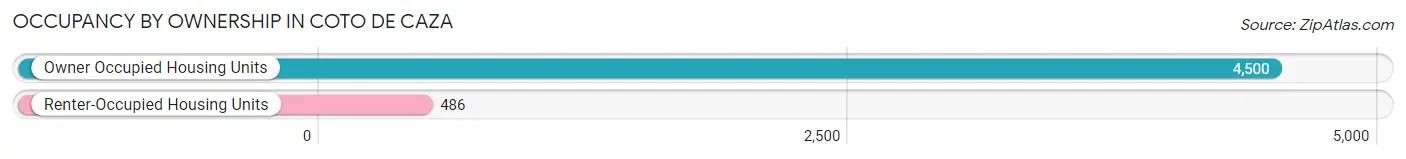
| Occupancy | # Housing Units | % Housing Units |
| Owner Occupied Housing Units | 4,500 | 90.2% |
| Renter-Occupied Housing Units | 486 | 9.8% |
| Total Occupied Housing Units | 4,986 | 100.0% |
Occupancy by Household Size in Coto de Caza
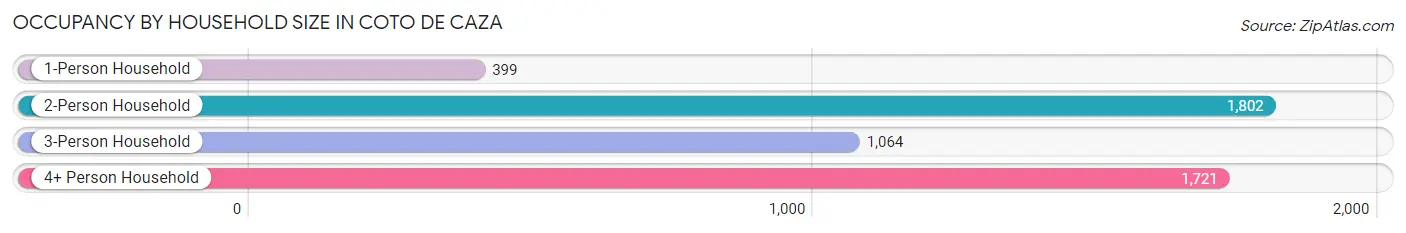
| Household Size | # Housing Units | % Housing Units |
| 1-Person Household | 399 | 8.0% |
| 2-Person Household | 1,802 | 36.1% |
| 3-Person Household | 1,064 | 21.3% |
| 4+ Person Household | 1,721 | 34.5% |
| Total Housing Units | 4,986 | 100.0% |
Occupancy by Ownership by Household Size in Coto de Caza
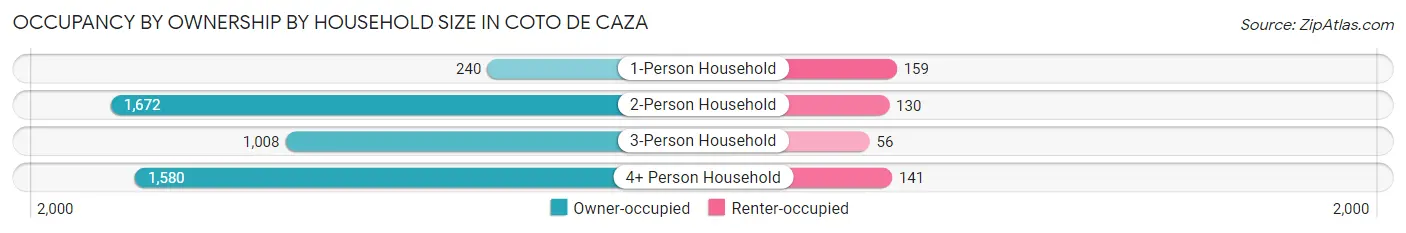
| Household Size | Owner-occupied | Renter-occupied |
| 1-Person Household | 240 (60.2%) | 159 (39.9%) |
| 2-Person Household | 1,672 (92.8%) | 130 (7.2%) |
| 3-Person Household | 1,008 (94.7%) | 56 (5.3%) |
| 4+ Person Household | 1,580 (91.8%) | 141 (8.2%) |
| Total Housing Units | 4,500 (90.2%) | 486 (9.8%) |
Occupancy by Educational Attainment in Coto de Caza
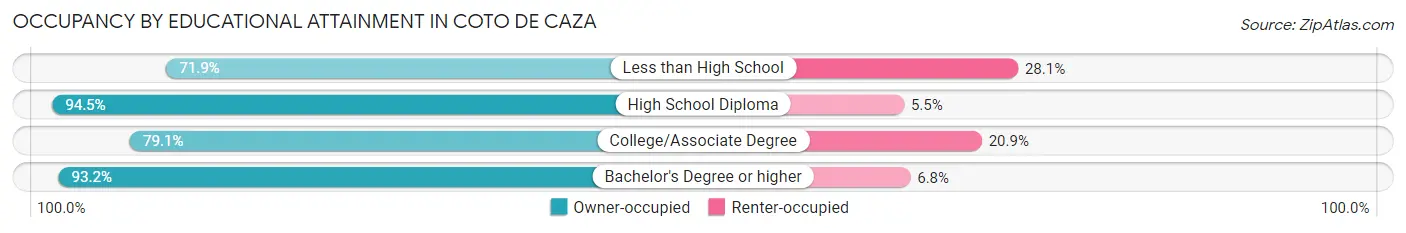
| Household Size | Owner-occupied | Renter-occupied |
| Less than High School | 23 (71.9%) | 9 (28.1%) |
| High School Diploma | 257 (94.5%) | 15 (5.5%) |
| College/Associate Degree | 812 (79.1%) | 215 (20.9%) |
| Bachelor's Degree or higher | 3,408 (93.2%) | 247 (6.8%) |
Occupancy by Age of Householder in Coto de Caza
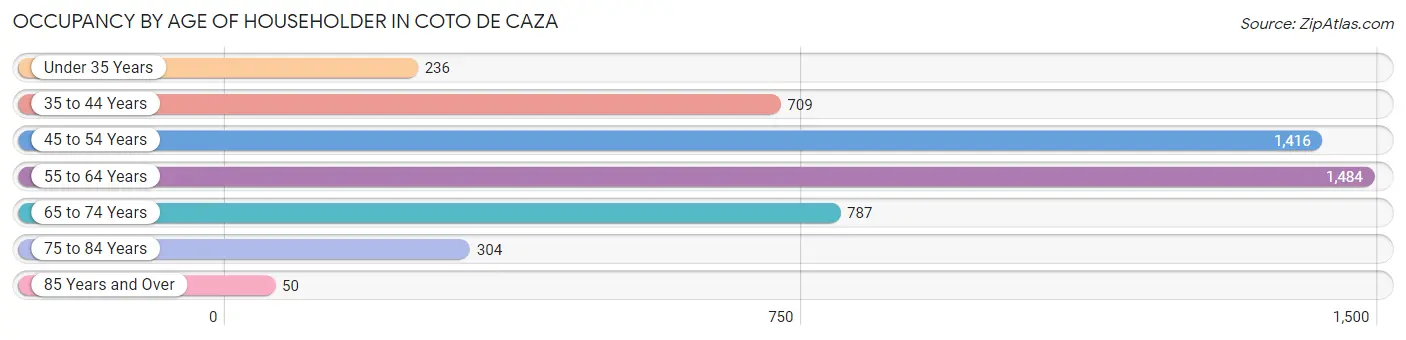
| Age Bracket | # Households | % Households |
| Under 35 Years | 236 | 4.7% |
| 35 to 44 Years | 709 | 14.2% |
| 45 to 54 Years | 1,416 | 28.4% |
| 55 to 64 Years | 1,484 | 29.8% |
| 65 to 74 Years | 787 | 15.8% |
| 75 to 84 Years | 304 | 6.1% |
| 85 Years and Over | 50 | 1.0% |
| Total | 4,986 | 100.0% |
Housing Finances in Coto de Caza
Median Income by Occupancy in Coto de Caza
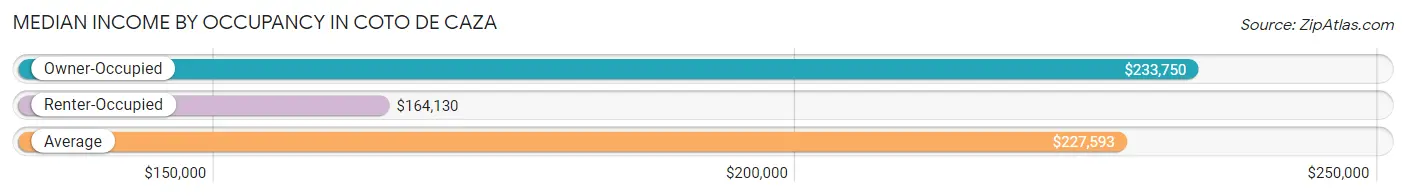
| Occupancy Type | # Households | Median Income |
| Owner-Occupied | 4,500 (90.2%) | $233,750 |
| Renter-Occupied | 486 (9.8%) | $164,130 |
| Average | 4,986 (100.0%) | $227,593 |
Occupancy by Householder Income Bracket in Coto de Caza
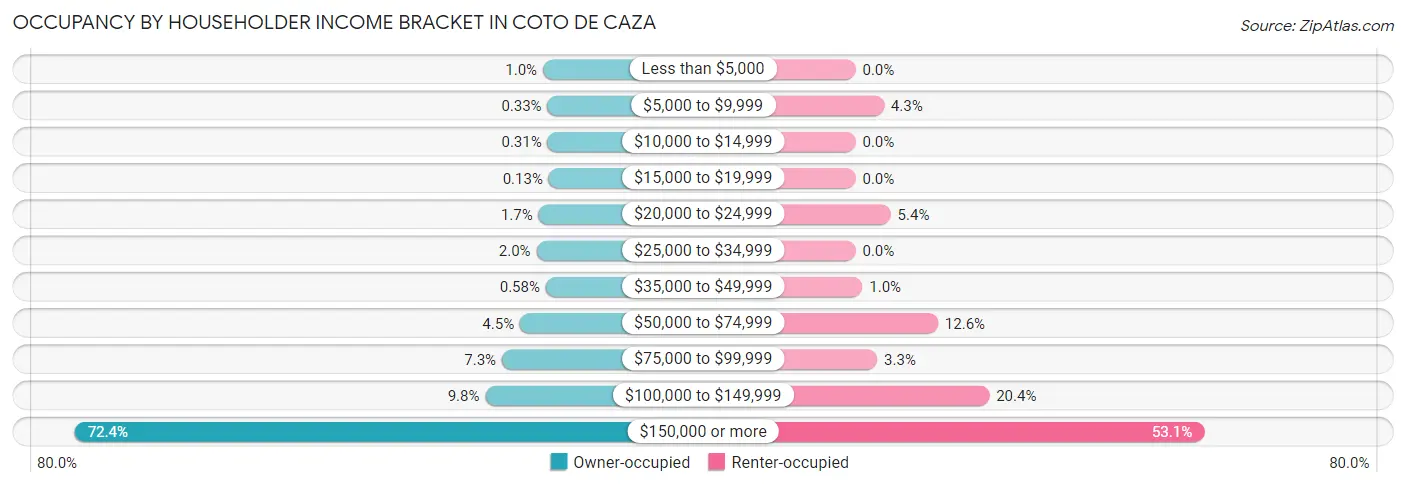
| Income Bracket | Owner-occupied | Renter-occupied |
| Less than $5,000 | 46 (1.0%) | 0 (0.0%) |
| $5,000 to $9,999 | 15 (0.3%) | 21 (4.3%) |
| $10,000 to $14,999 | 14 (0.3%) | 0 (0.0%) |
| $15,000 to $19,999 | 6 (0.1%) | 0 (0.0%) |
| $20,000 to $24,999 | 76 (1.7%) | 26 (5.3%) |
| $25,000 to $34,999 | 90 (2.0%) | 0 (0.0%) |
| $35,000 to $49,999 | 26 (0.6%) | 5 (1.0%) |
| $50,000 to $74,999 | 203 (4.5%) | 61 (12.6%) |
| $75,000 to $99,999 | 327 (7.3%) | 16 (3.3%) |
| $100,000 to $149,999 | 441 (9.8%) | 99 (20.4%) |
| $150,000 or more | 3,256 (72.4%) | 258 (53.1%) |
| Total | 4,500 (100.0%) | 486 (100.0%) |
Monthly Housing Cost Tiers in Coto de Caza
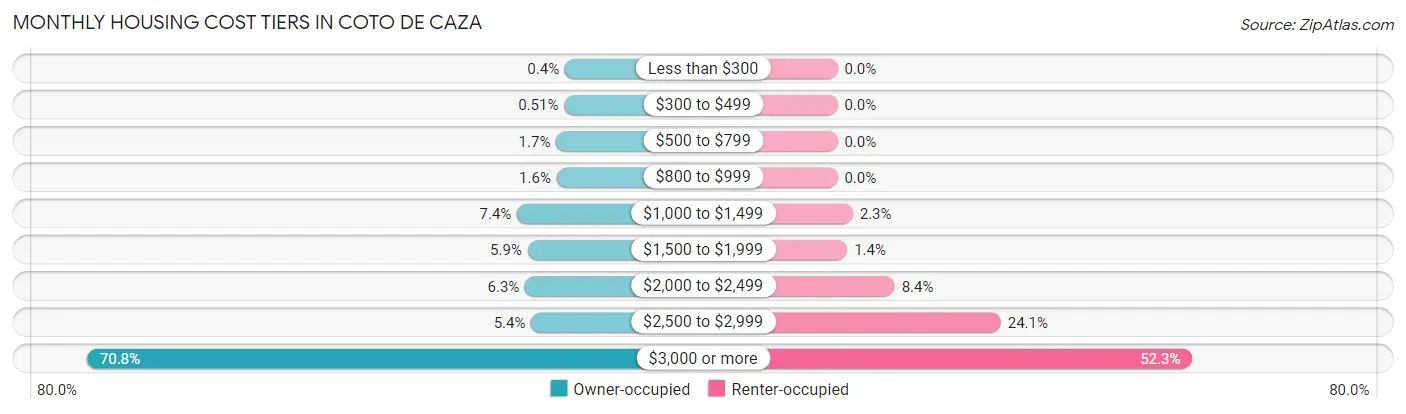
| Monthly Cost | Owner-occupied | Renter-occupied |
| Less than $300 | 18 (0.4%) | 0 (0.0%) |
| $300 to $499 | 23 (0.5%) | 0 (0.0%) |
| $500 to $799 | 76 (1.7%) | 0 (0.0%) |
| $800 to $999 | 73 (1.6%) | 0 (0.0%) |
| $1,000 to $1,499 | 335 (7.4%) | 11 (2.3%) |
| $1,500 to $1,999 | 265 (5.9%) | 7 (1.4%) |
| $2,000 to $2,499 | 282 (6.3%) | 41 (8.4%) |
| $2,500 to $2,999 | 241 (5.4%) | 117 (24.1%) |
| $3,000 or more | 3,187 (70.8%) | 254 (52.3%) |
| Total | 4,500 (100.0%) | 486 (100.0%) |
Physical Housing Characteristics in Coto de Caza
Housing Structures in Coto de Caza
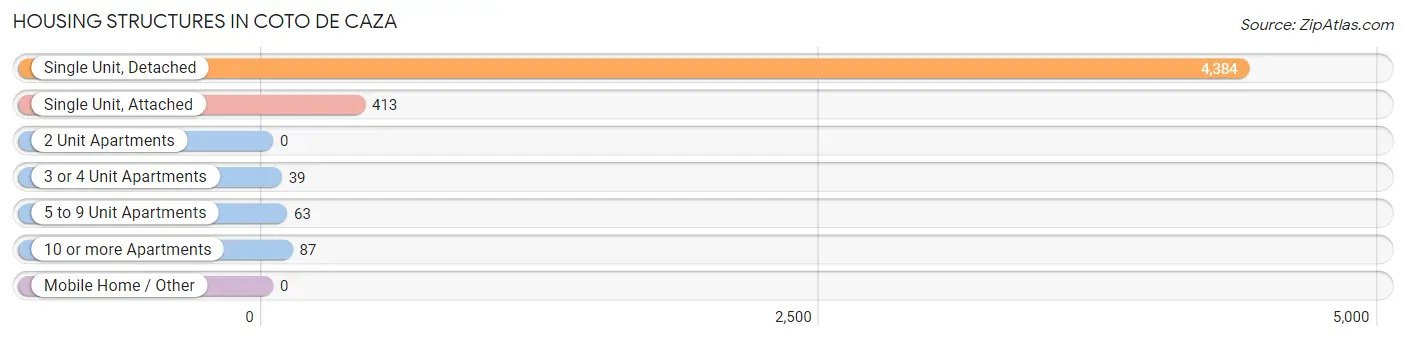
| Structure Type | # Housing Units | % Housing Units |
| Single Unit, Detached | 4,384 | 87.9% |
| Single Unit, Attached | 413 | 8.3% |
| 2 Unit Apartments | 0 | 0.0% |
| 3 or 4 Unit Apartments | 39 | 0.8% |
| 5 to 9 Unit Apartments | 63 | 1.3% |
| 10 or more Apartments | 87 | 1.7% |
| Mobile Home / Other | 0 | 0.0% |
| Total | 4,986 | 100.0% |
Housing Structures by Occupancy in Coto de Caza
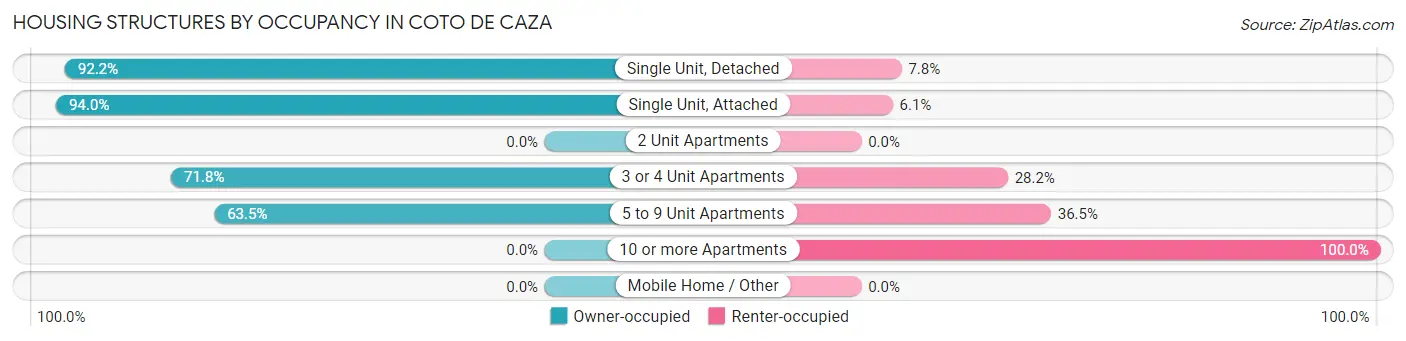
| Structure Type | Owner-occupied | Renter-occupied |
| Single Unit, Detached | 4,044 (92.2%) | 340 (7.8%) |
| Single Unit, Attached | 388 (94.0%) | 25 (6.0%) |
| 2 Unit Apartments | 0 (0.0%) | 0 (0.0%) |
| 3 or 4 Unit Apartments | 28 (71.8%) | 11 (28.2%) |
| 5 to 9 Unit Apartments | 40 (63.5%) | 23 (36.5%) |
| 10 or more Apartments | 0 (0.0%) | 87 (100.0%) |
| Mobile Home / Other | 0 (0.0%) | 0 (0.0%) |
| Total | 4,500 (90.2%) | 486 (9.8%) |
Housing Structures by Number of Rooms in Coto de Caza
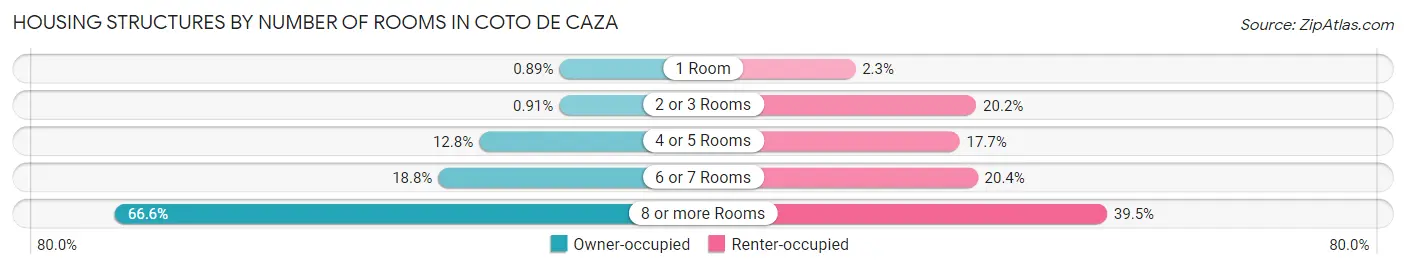
| Number of Rooms | Owner-occupied | Renter-occupied |
| 1 Room | 40 (0.9%) | 11 (2.3%) |
| 2 or 3 Rooms | 41 (0.9%) | 98 (20.2%) |
| 4 or 5 Rooms | 574 (12.8%) | 86 (17.7%) |
| 6 or 7 Rooms | 846 (18.8%) | 99 (20.4%) |
| 8 or more Rooms | 2,999 (66.6%) | 192 (39.5%) |
| Total | 4,500 (100.0%) | 486 (100.0%) |
Housing Structure by Heating Type in Coto de Caza
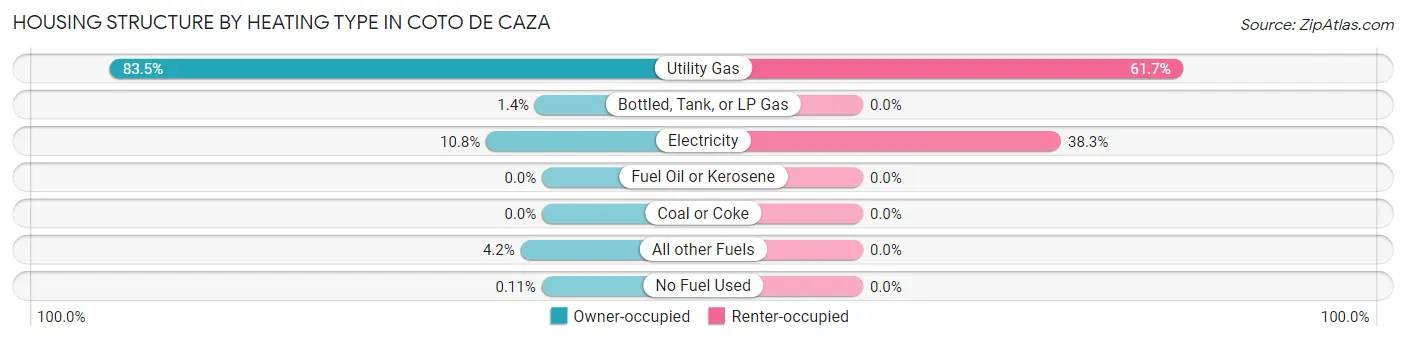
| Heating Type | Owner-occupied | Renter-occupied |
| Utility Gas | 3,759 (83.5%) | 300 (61.7%) |
| Bottled, Tank, or LP Gas | 62 (1.4%) | 0 (0.0%) |
| Electricity | 487 (10.8%) | 186 (38.3%) |
| Fuel Oil or Kerosene | 0 (0.0%) | 0 (0.0%) |
| Coal or Coke | 0 (0.0%) | 0 (0.0%) |
| All other Fuels | 187 (4.2%) | 0 (0.0%) |
| No Fuel Used | 5 (0.1%) | 0 (0.0%) |
| Total | 4,500 (100.0%) | 486 (100.0%) |
Household Vehicle Usage in Coto de Caza
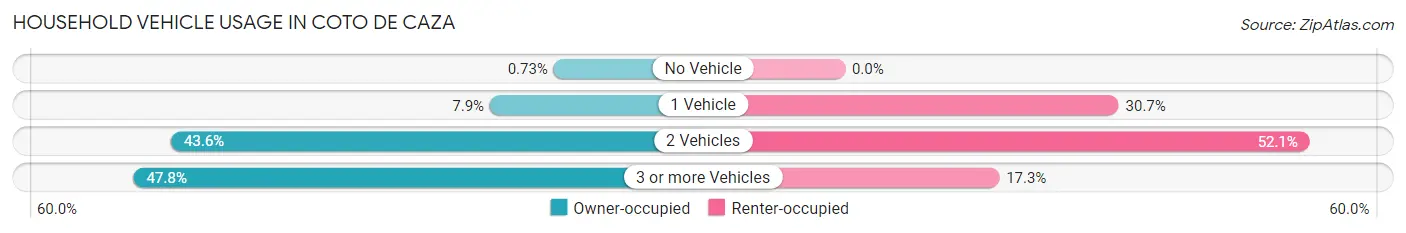
| Vehicles per Household | Owner-occupied | Renter-occupied |
| No Vehicle | 33 (0.7%) | 0 (0.0%) |
| 1 Vehicle | 354 (7.9%) | 149 (30.7%) |
| 2 Vehicles | 1,962 (43.6%) | 253 (52.1%) |
| 3 or more Vehicles | 2,151 (47.8%) | 84 (17.3%) |
| Total | 4,500 (100.0%) | 486 (100.0%) |
Real Estate & Mortgages in Coto de Caza
Real Estate and Mortgage Overview in Coto de Caza
| Characteristic | Without Mortgage | With Mortgage |
| Housing Units | 868 | 3,632 |
| Median Property Value | $1,411,800 | $1,334,300 |
| Median Household Income | $201,250 | $2,742 |
| Monthly Housing Costs | $1,489 | $3,071 |
| Real Estate Taxes | $9,752 | $169 |
Property Value by Mortgage Status in Coto de Caza
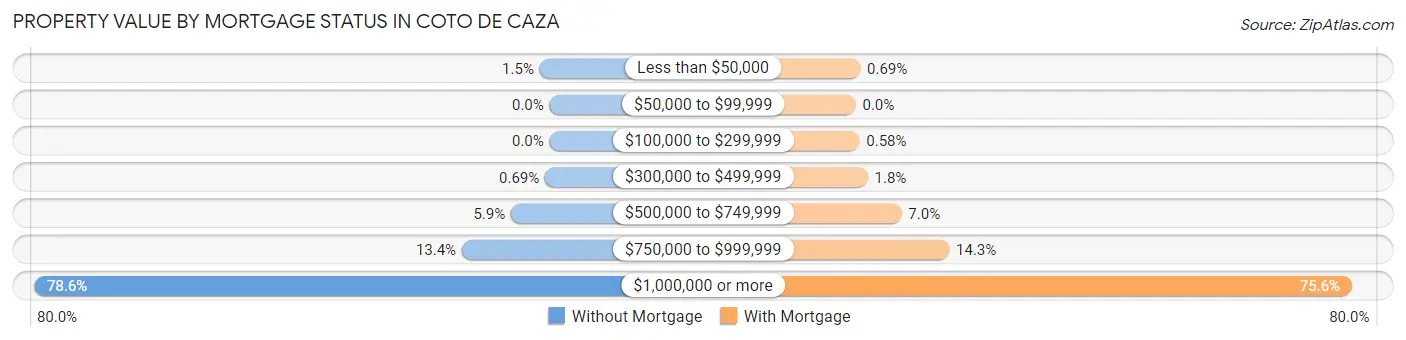
| Property Value | Without Mortgage | With Mortgage |
| Less than $50,000 | 13 (1.5%) | 25 (0.7%) |
| $50,000 to $99,999 | 0 (0.0%) | 0 (0.0%) |
| $100,000 to $299,999 | 0 (0.0%) | 21 (0.6%) |
| $300,000 to $499,999 | 6 (0.7%) | 67 (1.8%) |
| $500,000 to $749,999 | 51 (5.9%) | 254 (7.0%) |
| $750,000 to $999,999 | 116 (13.4%) | 518 (14.3%) |
| $1,000,000 or more | 682 (78.6%) | 2,747 (75.6%) |
| Total | 868 (100.0%) | 3,632 (100.0%) |
Household Income by Mortgage Status in Coto de Caza
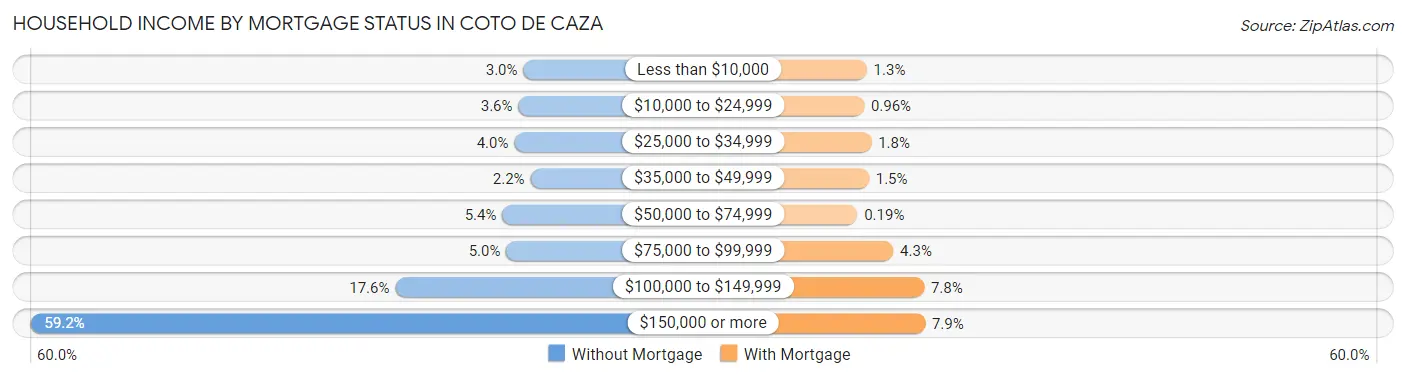
| Household Income | Without Mortgage | With Mortgage |
| Less than $10,000 | 26 (3.0%) | 46 (1.3%) |
| $10,000 to $24,999 | 31 (3.6%) | 35 (1.0%) |
| $25,000 to $34,999 | 35 (4.0%) | 65 (1.8%) |
| $35,000 to $49,999 | 19 (2.2%) | 55 (1.5%) |
| $50,000 to $74,999 | 47 (5.4%) | 7 (0.2%) |
| $75,000 to $99,999 | 43 (5.0%) | 156 (4.3%) |
| $100,000 to $149,999 | 153 (17.6%) | 284 (7.8%) |
| $150,000 or more | 514 (59.2%) | 288 (7.9%) |
| Total | 868 (100.0%) | 3,632 (100.0%) |
Property Value to Household Income Ratio in Coto de Caza
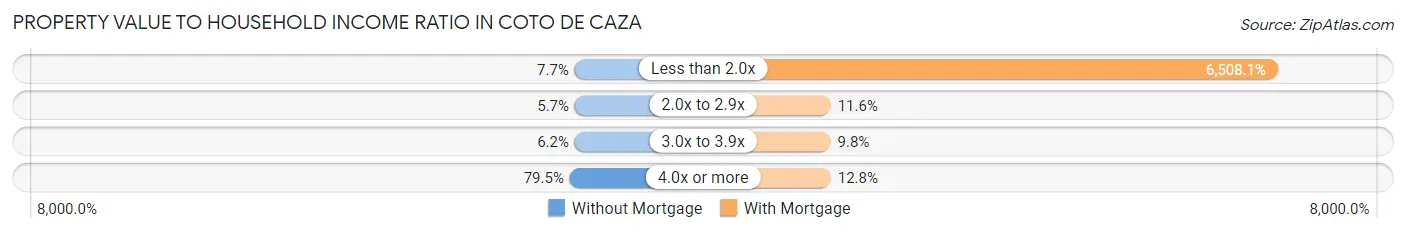
| Value-to-Income Ratio | Without Mortgage | With Mortgage |
| Less than 2.0x | 67 (7.7%) | 236,375 (6,508.1%) |
| 2.0x to 2.9x | 49 (5.7%) | 421 (11.6%) |
| 3.0x to 3.9x | 54 (6.2%) | 356 (9.8%) |
| 4.0x or more | 690 (79.5%) | 464 (12.8%) |
| Total | 868 (100.0%) | 3,632 (100.0%) |
Real Estate Taxes by Mortgage Status in Coto de Caza
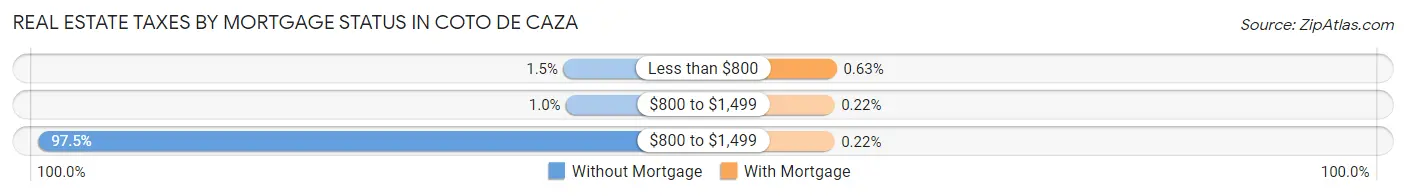
| Property Taxes | Without Mortgage | With Mortgage |
| Less than $800 | 13 (1.5%) | 23 (0.6%) |
| $800 to $1,499 | 9 (1.0%) | 8 (0.2%) |
| $800 to $1,499 | 846 (97.5%) | 8 (0.2%) |
| Total | 868 (100.0%) | 3,632 (100.0%) |
Health & Disability in Coto de Caza
Health Insurance Coverage by Age in Coto de Caza
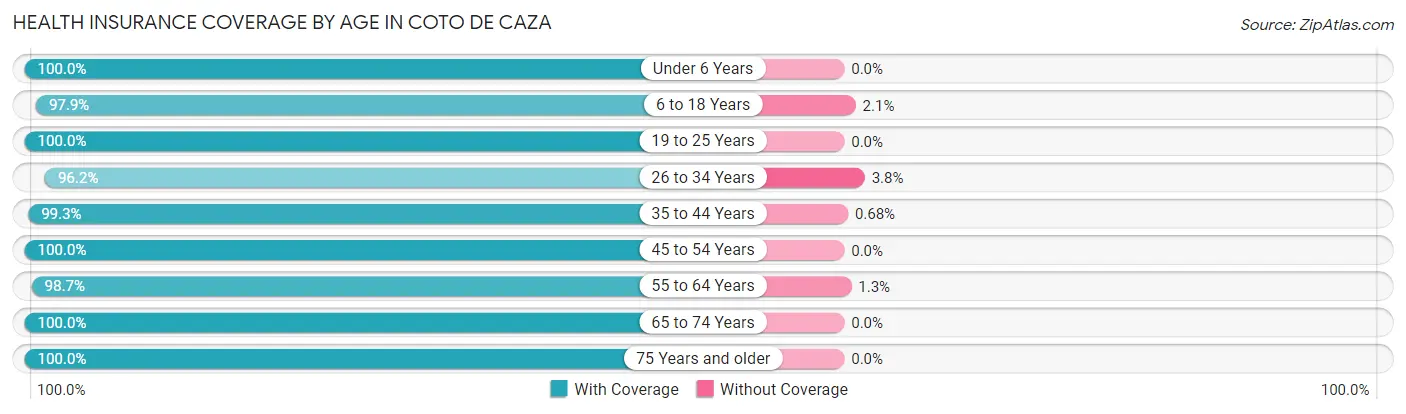
| Age Bracket | With Coverage | Without Coverage |
| Under 6 Years | 751 (100.0%) | 0 (0.0%) |
| 6 to 18 Years | 3,097 (97.9%) | 67 (2.1%) |
| 19 to 25 Years | 929 (100.0%) | 0 (0.0%) |
| 26 to 34 Years | 1,314 (96.2%) | 52 (3.8%) |
| 35 to 44 Years | 1,463 (99.3%) | 10 (0.7%) |
| 45 to 54 Years | 2,842 (100.0%) | 0 (0.0%) |
| 55 to 64 Years | 2,911 (98.7%) | 39 (1.3%) |
| 65 to 74 Years | 1,496 (100.0%) | 0 (0.0%) |
| 75 Years and older | 661 (100.0%) | 0 (0.0%) |
| Total | 15,464 (98.9%) | 168 (1.1%) |
Health Insurance Coverage by Citizenship Status in Coto de Caza

| Citizenship Status | With Coverage | Without Coverage |
| Native Born | 751 (100.0%) | 0 (0.0%) |
| Foreign Born, Citizen | 3,097 (97.9%) | 67 (2.1%) |
| Foreign Born, not a Citizen | 929 (100.0%) | 0 (0.0%) |
Health Insurance Coverage by Household Income in Coto de Caza
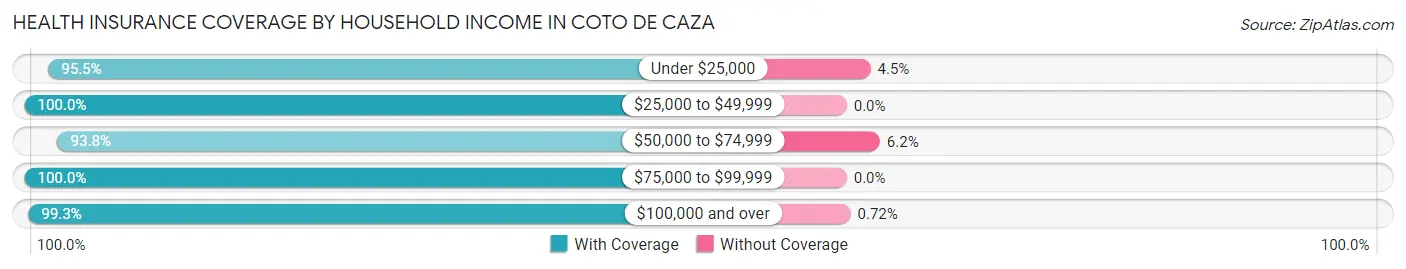
| Household Income | With Coverage | Without Coverage |
| Under $25,000 | 493 (95.5%) | 23 (4.5%) |
| $25,000 to $49,999 | 218 (100.0%) | 0 (0.0%) |
| $50,000 to $74,999 | 772 (93.8%) | 51 (6.2%) |
| $75,000 to $99,999 | 975 (100.0%) | 0 (0.0%) |
| $100,000 and over | 13,006 (99.3%) | 94 (0.7%) |
Public vs Private Health Insurance Coverage by Age in Coto de Caza
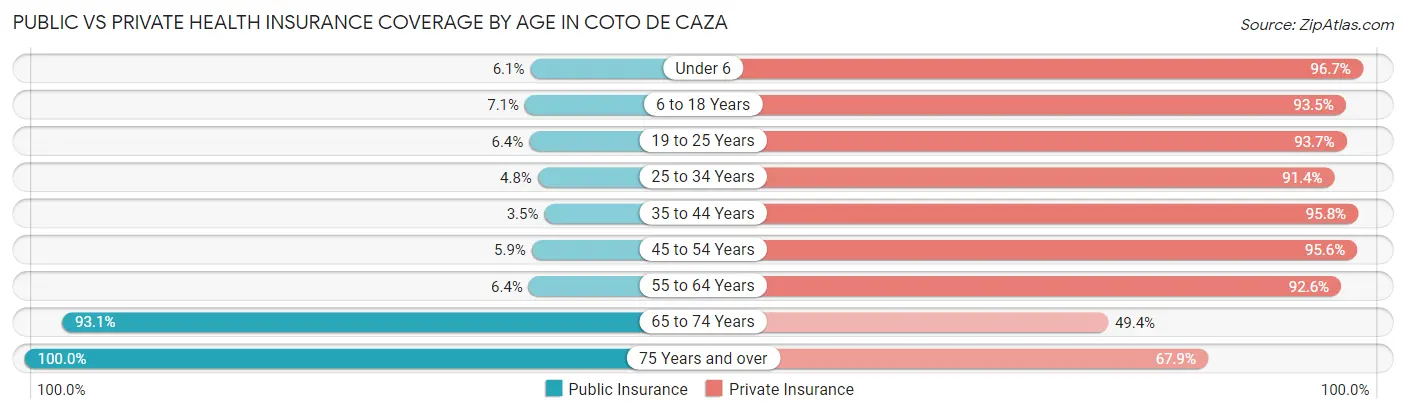
| Age Bracket | Public Insurance | Private Insurance |
| Under 6 | 46 (6.1%) | 726 (96.7%) |
| 6 to 18 Years | 226 (7.1%) | 2,958 (93.5%) |
| 19 to 25 Years | 59 (6.4%) | 870 (93.6%) |
| 25 to 34 Years | 65 (4.8%) | 1,249 (91.4%) |
| 35 to 44 Years | 52 (3.5%) | 1,411 (95.8%) |
| 45 to 54 Years | 167 (5.9%) | 2,718 (95.6%) |
| 55 to 64 Years | 190 (6.4%) | 2,733 (92.6%) |
| 65 to 74 Years | 1,392 (93.0%) | 739 (49.4%) |
| 75 Years and over | 661 (100.0%) | 449 (67.9%) |
| Total | 2,858 (18.3%) | 13,853 (88.6%) |
Disability Status by Sex by Age in Coto de Caza
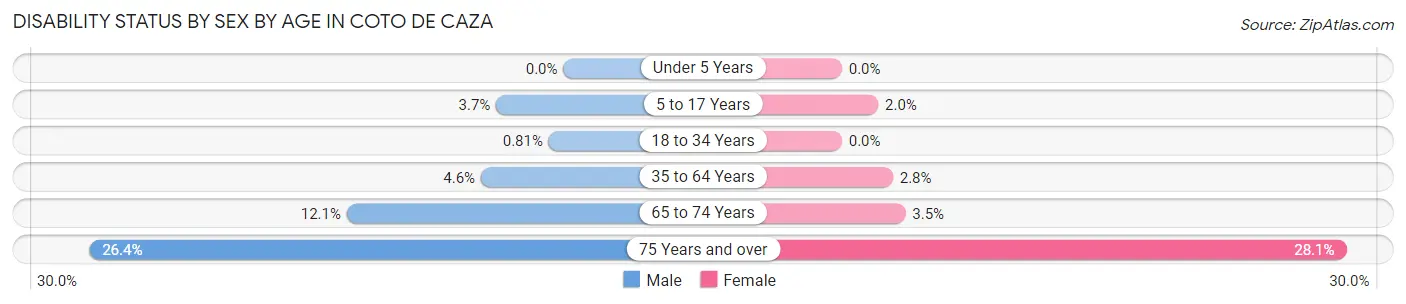
| Age Bracket | Male | Female |
| Under 5 Years | 0 (0.0%) | 0 (0.0%) |
| 5 to 17 Years | 48 (3.7%) | 33 (2.0%) |
| 18 to 34 Years | 12 (0.8%) | 0 (0.0%) |
| 35 to 64 Years | 164 (4.6%) | 105 (2.8%) |
| 65 to 74 Years | 102 (12.1%) | 23 (3.5%) |
| 75 Years and over | 104 (26.4%) | 75 (28.1%) |
Disability Class by Sex by Age in Coto de Caza
Disability Class: Hearing Difficulty
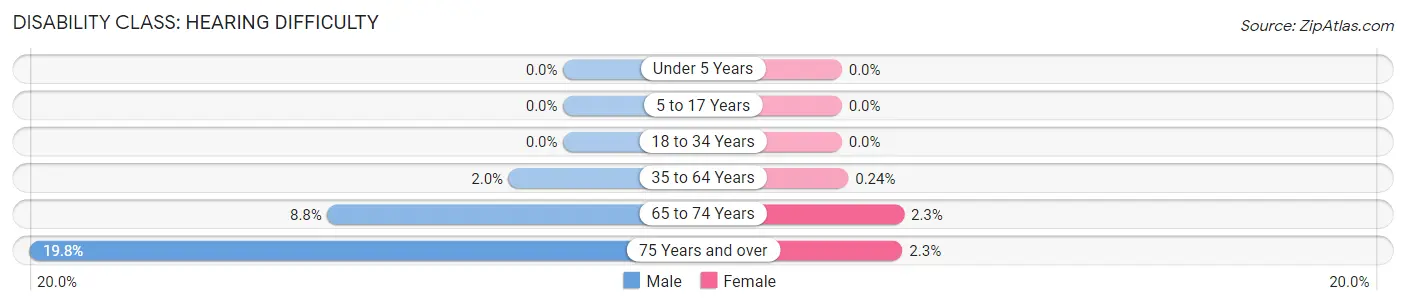
| Age Bracket | Male | Female |
| Under 5 Years | 0 (0.0%) | 0 (0.0%) |
| 5 to 17 Years | 0 (0.0%) | 0 (0.0%) |
| 18 to 34 Years | 0 (0.0%) | 0 (0.0%) |
| 35 to 64 Years | 72 (2.0%) | 9 (0.2%) |
| 65 to 74 Years | 74 (8.7%) | 15 (2.3%) |
| 75 Years and over | 78 (19.8%) | 6 (2.2%) |
Disability Class: Vision Difficulty
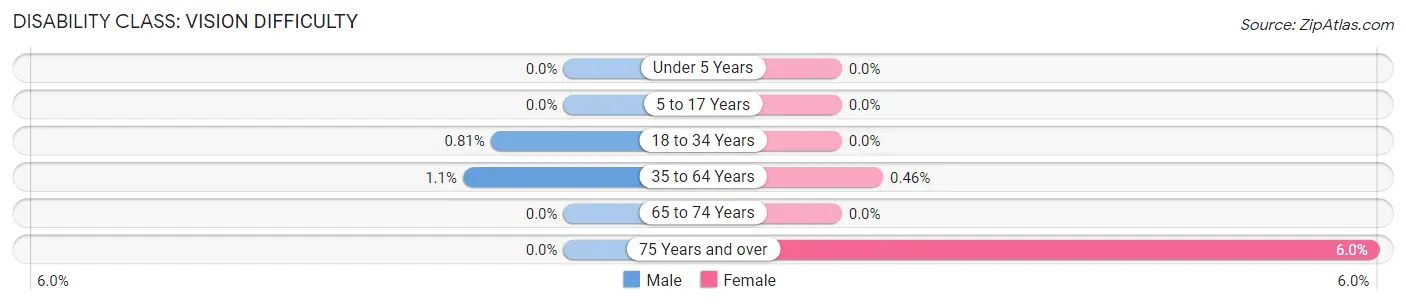
| Age Bracket | Male | Female |
| Under 5 Years | 0 (0.0%) | 0 (0.0%) |
| 5 to 17 Years | 0 (0.0%) | 0 (0.0%) |
| 18 to 34 Years | 12 (0.8%) | 0 (0.0%) |
| 35 to 64 Years | 40 (1.1%) | 17 (0.5%) |
| 65 to 74 Years | 0 (0.0%) | 0 (0.0%) |
| 75 Years and over | 0 (0.0%) | 16 (6.0%) |
Disability Class: Cognitive Difficulty
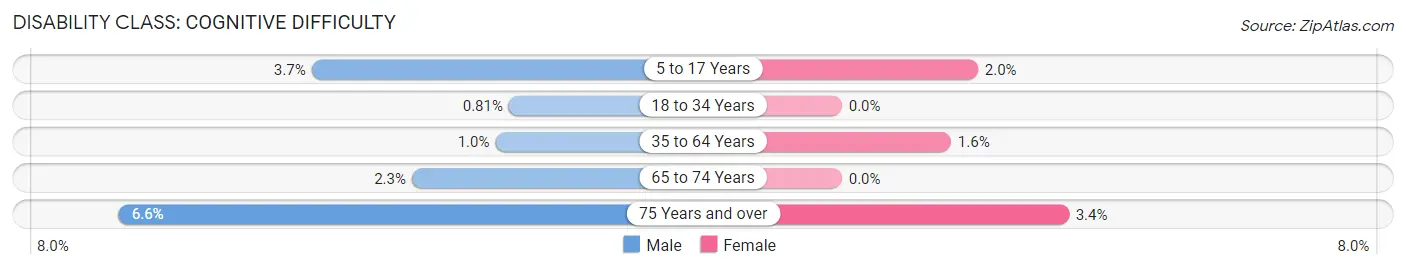
| Age Bracket | Male | Female |
| 5 to 17 Years | 48 (3.7%) | 33 (2.0%) |
| 18 to 34 Years | 12 (0.8%) | 0 (0.0%) |
| 35 to 64 Years | 36 (1.0%) | 60 (1.6%) |
| 65 to 74 Years | 19 (2.2%) | 0 (0.0%) |
| 75 Years and over | 26 (6.6%) | 9 (3.4%) |
Disability Class: Ambulatory Difficulty
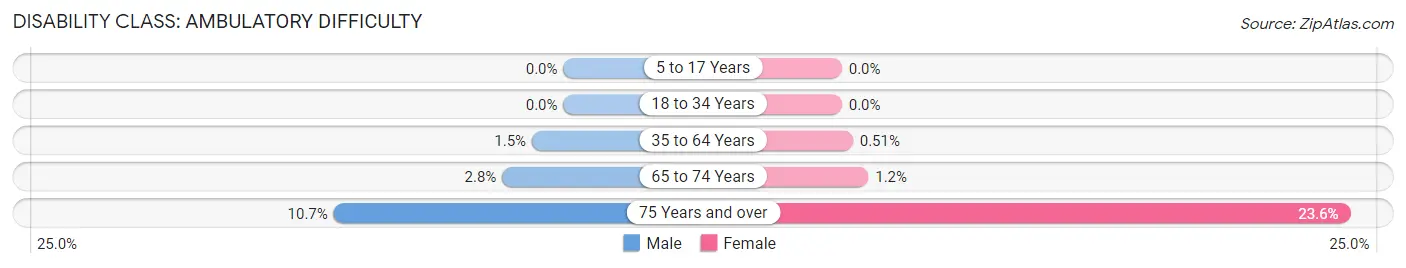
| Age Bracket | Male | Female |
| 5 to 17 Years | 0 (0.0%) | 0 (0.0%) |
| 18 to 34 Years | 0 (0.0%) | 0 (0.0%) |
| 35 to 64 Years | 52 (1.5%) | 19 (0.5%) |
| 65 to 74 Years | 24 (2.8%) | 8 (1.2%) |
| 75 Years and over | 42 (10.7%) | 63 (23.6%) |
Disability Class: Self-Care Difficulty
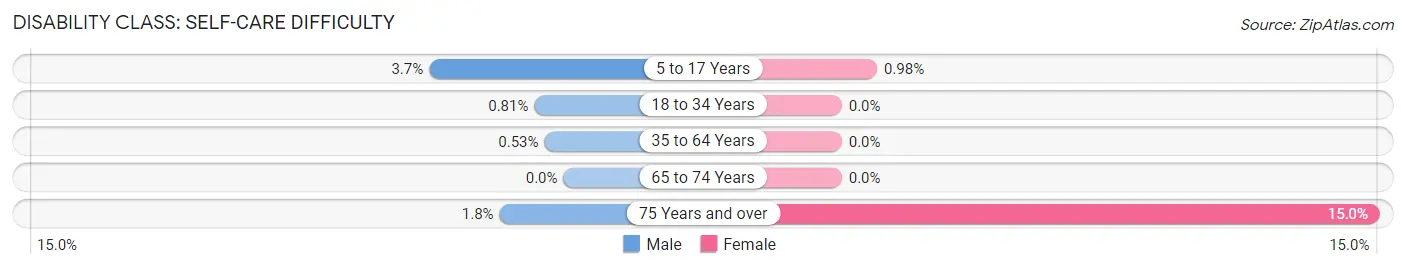
| Age Bracket | Male | Female |
| 5 to 17 Years | 48 (3.7%) | 16 (1.0%) |
| 18 to 34 Years | 12 (0.8%) | 0 (0.0%) |
| 35 to 64 Years | 19 (0.5%) | 0 (0.0%) |
| 65 to 74 Years | 0 (0.0%) | 0 (0.0%) |
| 75 Years and over | 7 (1.8%) | 40 (15.0%) |
Technology Access in Coto de Caza
Computing Device Access in Coto de Caza
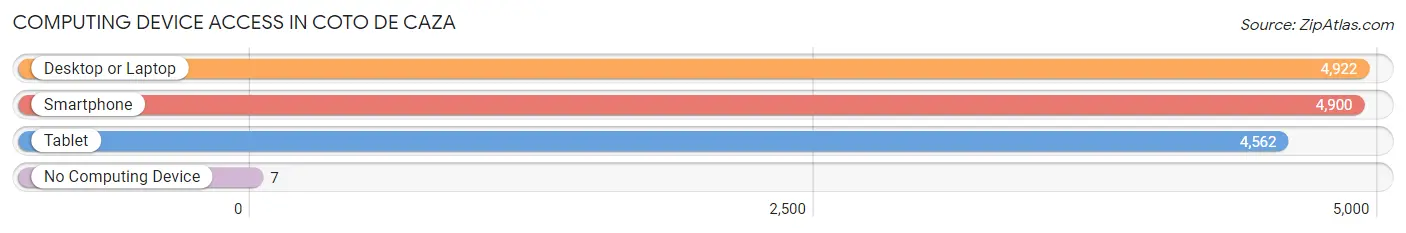
| Device Type | # Households | % Households |
| Desktop or Laptop | 4,922 | 98.7% |
| Smartphone | 4,900 | 98.3% |
| Tablet | 4,562 | 91.5% |
| No Computing Device | 7 | 0.1% |
| Total | 4,986 | 100.0% |
Internet Access in Coto de Caza
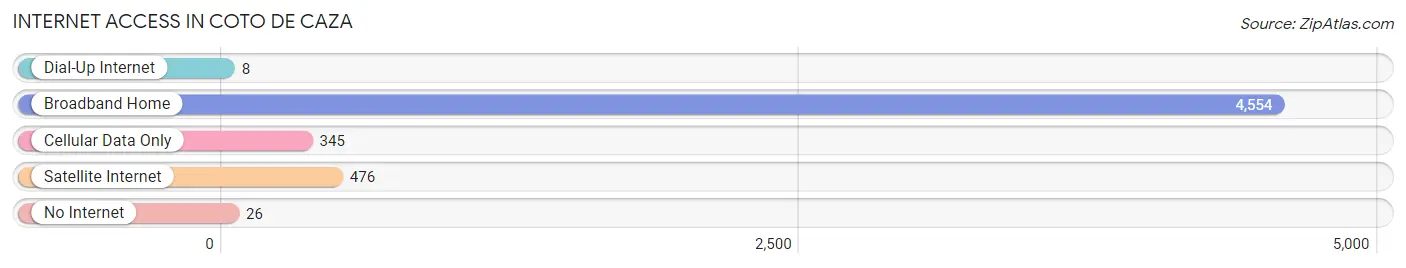
| Internet Type | # Households | % Households |
| Dial-Up Internet | 8 | 0.2% |
| Broadband Home | 4,554 | 91.3% |
| Cellular Data Only | 345 | 6.9% |
| Satellite Internet | 476 | 9.6% |
| No Internet | 26 | 0.5% |
| Total | 4,986 | 100.0% |
Coto de Caza Summary
Coto De Caza is a census-designated place located in Orange County, California. It is situated in the foothills of the Santa Ana Mountains, and is bordered by the cities of Mission Viejo, Rancho Santa Margarita, and San Juan Capistrano. The population of Coto De Caza was 14,866 at the 2010 census.
History
Coto De Caza was originally part of the Rancho Mission Viejo, a large Spanish land grant given to the Mission San Juan Capistrano in 1845. The land was used for cattle grazing and farming until the 1960s, when it was purchased by the Catellus Corporation. Catellus developed the area into a master-planned community, and in 1976, the first homes were built. The community was named Coto De Caza, which translates to “hunting preserve” in Spanish.
Geography
Coto De Caza is located in the foothills of the Santa Ana Mountains, and is bordered by the cities of Mission Viejo, Rancho Santa Margarita, and San Juan Capistrano. The community is situated on 4,000 acres of rolling hills and canyons, and is home to two golf courses, a polo field, and a private equestrian center.
Economy
Coto De Caza is a primarily residential community, and the majority of its residents are employed in the nearby cities of Mission Viejo, Rancho Santa Margarita, and San Juan Capistrano. The community is home to several small businesses, including a grocery store, a gas station, and a few restaurants.
Demographics
As of the 2010 census, the population of Coto De Caza was 14,866. The racial makeup of the community was 79.2% White, 8.2% Asian, 6.2% Hispanic or Latino, and 4.2% African American. The median household income was $133,867, and the median age was 44.7 years.
Conclusion
Coto De Caza is a census-designated place located in Orange County, California. It is situated in the foothills of the Santa Ana Mountains, and is bordered by the cities of Mission Viejo, Rancho Santa Margarita, and San Juan Capistrano. The community was originally part of the Rancho Mission Viejo, and was developed into a master-planned community in the 1960s. The population of Coto De Caza was 14,866 at the 2010 census, and the racial makeup of the community was 79.2% White, 8.2% Asian, 6.2% Hispanic or Latino, and 4.2% African American. The median household income was $133,867, and the median age was 44.7 years. Coto De Caza is a primarily residential community, and the majority of its residents are employed in the nearby cities. The community is home to several small businesses, including a grocery store, a gas station, and a few restaurants.
Common Questions
What is Per Capita Income in Coto de Caza?
Per Capita income in Coto de Caza is $99,083.
What is the Median Family Income in Coto de Caza?
Median Family Income in Coto de Caza is $234,861.
What is the Median Household income in Coto de Caza?
Median Household Income in Coto de Caza is $227,593.
What is Income or Wage Gap in Coto de Caza?
Income or Wage Gap in Coto de Caza is 56.6%.
Women in Coto de Caza earn 43.4 cents for every dollar earned by a man.
What is Family Income Deficit in Coto de Caza?
Family Income Deficit in Coto de Caza is $11,387.
Families that are below poverty line in Coto de Caza earn $11,387 less on average than the poverty threshold level.
What is Inequality or Gini Index in Coto de Caza?
Inequality or Gini Index in Coto de Caza is 0.45.
What is the Total Population of Coto de Caza?
Total Population of Coto de Caza is 15,632.
What is the Total Male Population of Coto de Caza?
Total Male Population of Coto de Caza is 7,913.
What is the Total Female Population of Coto de Caza?
Total Female Population of Coto de Caza is 7,719.
What is the Ratio of Males per 100 Females in Coto de Caza?
There are 102.51 Males per 100 Females in Coto de Caza.
What is the Ratio of Females per 100 Males in Coto de Caza?
There are 97.55 Females per 100 Males in Coto de Caza.
What is the Median Population Age in Coto de Caza?
Median Population Age in Coto de Caza is 45.6 Years.
What is the Average Family Size in Coto de Caza
Average Family Size in Coto de Caza is 3.3 People.
What is the Average Household Size in Coto de Caza
Average Household Size in Coto de Caza is 3.1 People.
How Large is the Labor Force in Coto de Caza?
There are 8,583 People in the Labor Forcein in Coto de Caza.
What is the Percentage of People in the Labor Force in Coto de Caza?
67.0% of People are in the Labor Force in Coto de Caza.
What is the Unemployment Rate in Coto de Caza?
Unemployment Rate in Coto de Caza is 4.2%.