El Granada, CA Map & Demographics
El Granada Map
El Granada Overview
$95,459
PER CAPITA INCOME
$215,980
AVG FAMILY INCOME
$216,104
AVG HOUSEHOLD INCOME
32.2%
WAGE / INCOME GAP [ % ]
67.8¢/ $1
WAGE / INCOME GAP [ $ ]
0.43
INEQUALITY / GINI INDEX
5,651
TOTAL POPULATION
2,999
MALE POPULATION
2,652
FEMALE POPULATION
113.08
MALES / 100 FEMALES
88.43
FEMALES / 100 MALES
48.4
MEDIAN AGE
2.8
AVG FAMILY SIZE
2.6
AVG HOUSEHOLD SIZE
3,151
LABOR FORCE [ PEOPLE ]
65.0%
PERCENT IN LABOR FORCE
8.3%
UNEMPLOYMENT RATE
El Granada Zip Codes
Income in El Granada
Income Overview in El Granada
Per Capita Income in El Granada is $95,459, while median incomes of families and households are $215,980 and $216,104 respectively.
| Characteristic | Number | Measure |
| Per Capita Income | 5,651 | $95,459 |
| Median Family Income | 1,703 | $215,980 |
| Mean Family Income | 1,703 | $272,105 |
| Median Household Income | 2,125 | $216,104 |
| Mean Household Income | 2,125 | $254,432 |
| Income Deficit | 1,703 | $0 |
| Wage / Income Gap (%) | 5,651 | 32.18% |
| Wage / Income Gap ($) | 5,651 | 67.82¢ per $1 |
| Gini / Inequality Index | 5,651 | 0.43 |
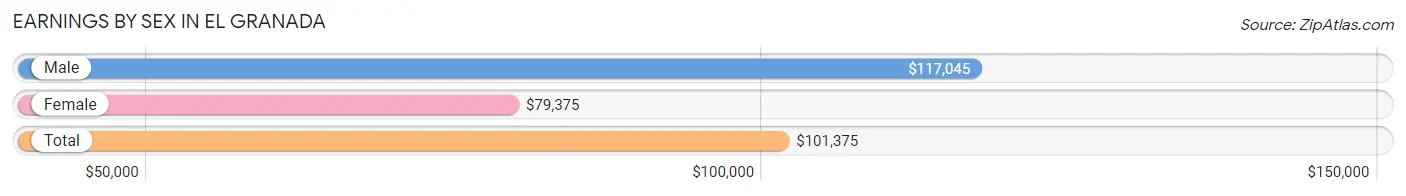
Earnings by Sex in El Granada
Average Earnings in El Granada are $101,375, $117,045 for men and $79,375 for women, a difference of 32.2%.
| Sex | Number | Average Earnings |
| Male | 1,578 (51.0%) | $117,045 |
| Female | 1,518 (49.0%) | $79,375 |
| Total | 3,096 (100.0%) | $101,375 |
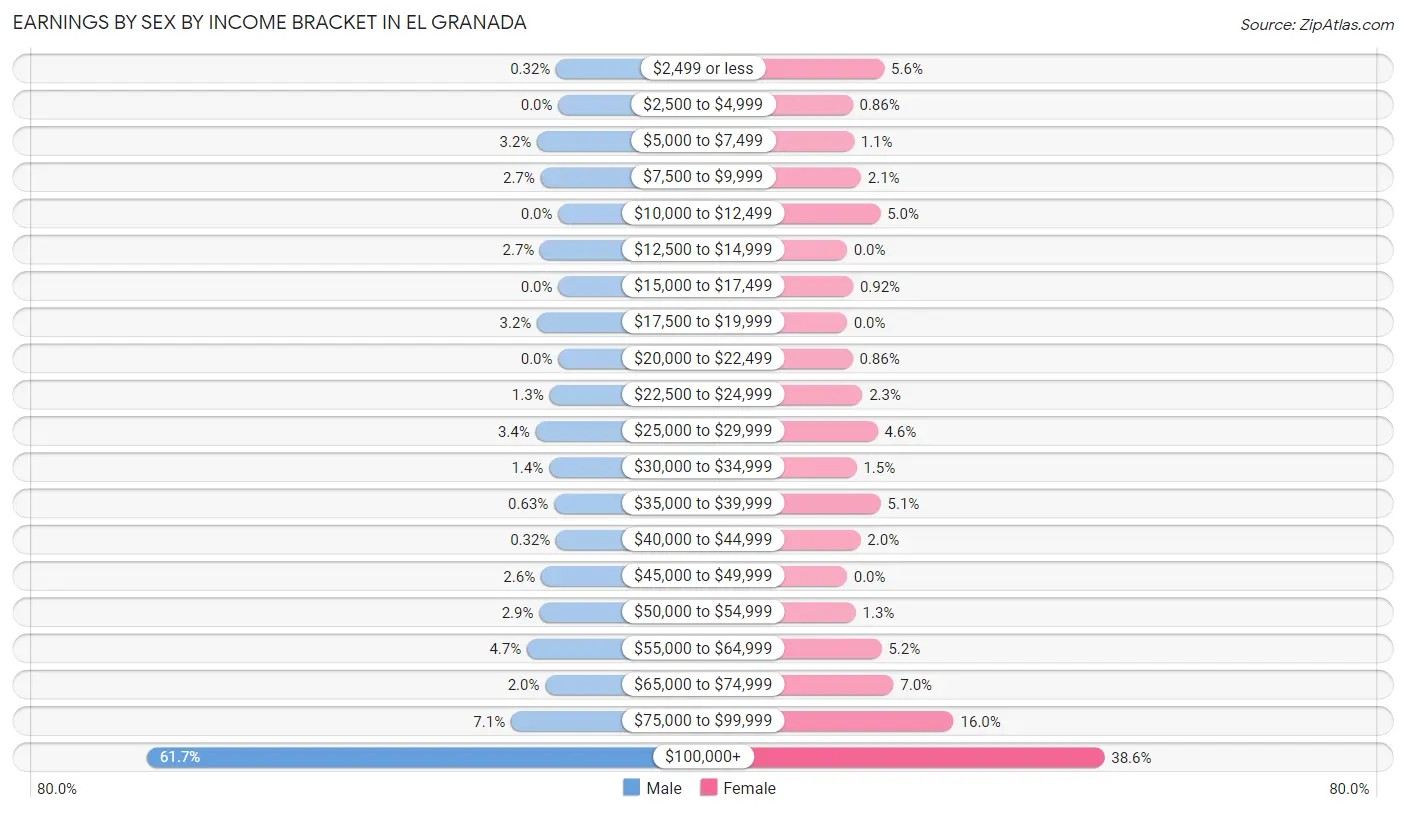
Earnings by Sex by Income Bracket in El Granada
The most common earnings brackets in El Granada are $100,000+ for men (973 | 61.7%) and $100,000+ for women (586 | 38.6%).
| Income | Male | Female |
| $2,499 or less | 5 (0.3%) | 85 (5.6%) |
| $2,500 to $4,999 | 0 (0.0%) | 13 (0.9%) |
| $5,000 to $7,499 | 50 (3.2%) | 16 (1.1%) |
| $7,500 to $9,999 | 42 (2.7%) | 32 (2.1%) |
| $10,000 to $12,499 | 0 (0.0%) | 76 (5.0%) |
| $12,500 to $14,999 | 43 (2.7%) | 0 (0.0%) |
| $15,000 to $17,499 | 0 (0.0%) | 14 (0.9%) |
| $17,500 to $19,999 | 50 (3.2%) | 0 (0.0%) |
| $20,000 to $22,499 | 0 (0.0%) | 13 (0.9%) |
| $22,500 to $24,999 | 21 (1.3%) | 35 (2.3%) |
| $25,000 to $29,999 | 54 (3.4%) | 70 (4.6%) |
| $30,000 to $34,999 | 22 (1.4%) | 22 (1.5%) |
| $35,000 to $39,999 | 10 (0.6%) | 77 (5.1%) |
| $40,000 to $44,999 | 5 (0.3%) | 31 (2.0%) |
| $45,000 to $49,999 | 41 (2.6%) | 0 (0.0%) |
| $50,000 to $54,999 | 45 (2.9%) | 20 (1.3%) |
| $55,000 to $64,999 | 74 (4.7%) | 79 (5.2%) |
| $65,000 to $74,999 | 31 (2.0%) | 106 (7.0%) |
| $75,000 to $99,999 | 112 (7.1%) | 243 (16.0%) |
| $100,000+ | 973 (61.7%) | 586 (38.6%) |
| Total | 1,578 (100.0%) | 1,518 (100.0%) |
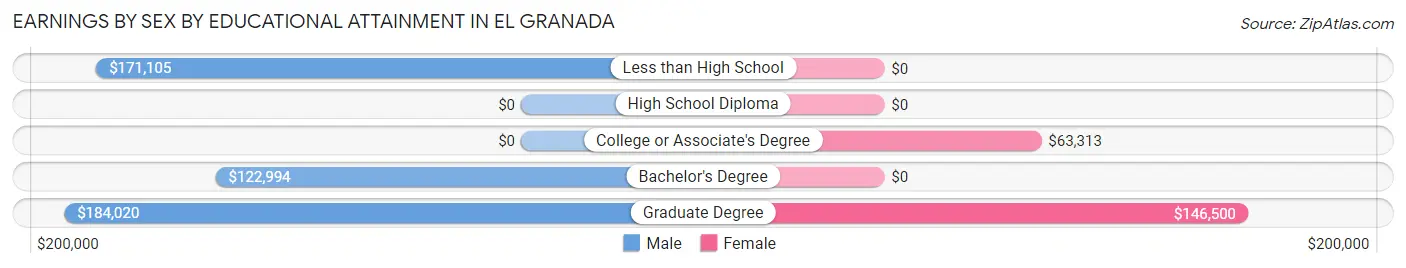
Earnings by Sex by Educational Attainment in El Granada
Average earnings in El Granada are $127,530 for men and $87,792 for women, a difference of 31.2%. Men with an educational attainment of graduate degree enjoy the highest average annual earnings of $184,020, while those with bachelor's degree education earn the least with $122,994. Women with an educational attainment of graduate degree earn the most with the average annual earnings of $146,500, while those with college or associate's degree education have the smallest earnings of $63,313.
| Educational Attainment | Male Income | Female Income |
| Less than High School | $171,105 | $0 |
| High School Diploma | - | - |
| College or Associate's Degree | - | - |
| Bachelor's Degree | $122,994 | $0 |
| Graduate Degree | $184,020 | $146,500 |
| Total | $127,530 | $87,792 |
Family Income in El Granada
Family Income Brackets in El Granada
According to the El Granada family income data, there are 979 families falling into the $200,000+ income range, which is the most common income bracket and makes up 57.5% of all families.
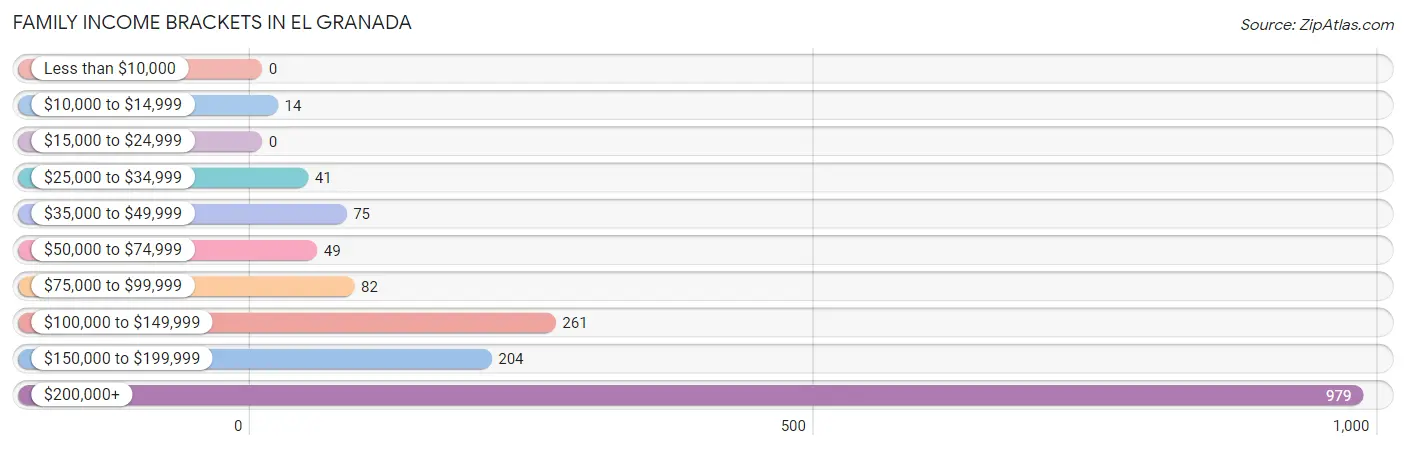
| Income Bracket | # Families | % Families |
| Less than $10,000 | 0 | 0.0% |
| $10,000 to $14,999 | 14 | 0.8% |
| $15,000 to $24,999 | 0 | 0.0% |
| $25,000 to $34,999 | 41 | 2.4% |
| $35,000 to $49,999 | 75 | 4.4% |
| $50,000 to $74,999 | 49 | 2.9% |
| $75,000 to $99,999 | 82 | 4.8% |
| $100,000 to $149,999 | 261 | 15.3% |
| $150,000 to $199,999 | 204 | 12.0% |
| $200,000+ | 979 | 57.5% |
Family Income by Famaliy Size in El Granada
4-person families (168 | 9.9%) account for the highest median family income in El Granada with $250,001 per family, while 2-person families (919 | 54.0%) have the highest median income of $107,780 per family member.
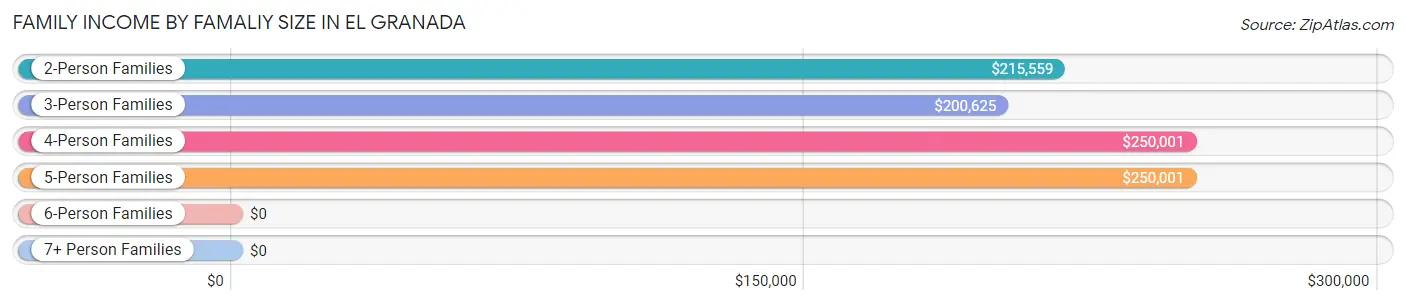
| Income Bracket | # Families | Median Income |
| 2-Person Families | 919 (54.0%) | $215,559 |
| 3-Person Families | 479 (28.1%) | $200,625 |
| 4-Person Families | 168 (9.9%) | $250,001 |
| 5-Person Families | 129 (7.6%) | $250,001 |
| 6-Person Families | 0 (0.0%) | $0 |
| 7+ Person Families | 8 (0.5%) | $0 |
| Total | 1,703 (100.0%) | $215,980 |
Family Income by Number of Earners in El Granada
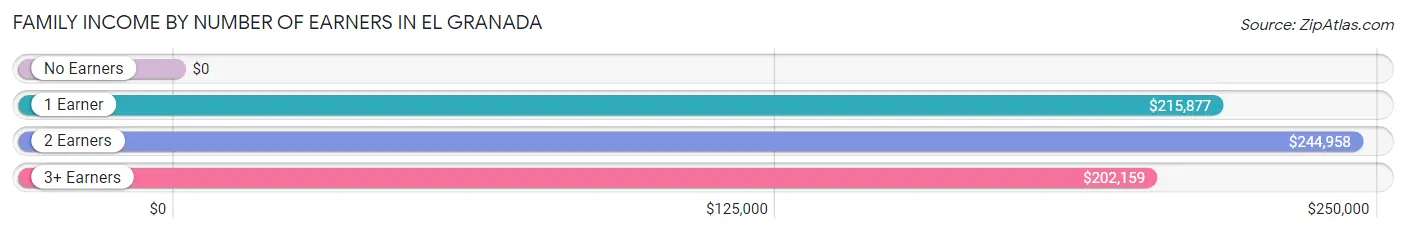
| Number of Earners | # Families | Median Income |
| No Earners | 179 (10.5%) | $0 |
| 1 Earner | 714 (41.9%) | $215,877 |
| 2 Earners | 726 (42.6%) | $244,958 |
| 3+ Earners | 84 (4.9%) | $202,159 |
| Total | 1,703 (100.0%) | $215,980 |
Household Income in El Granada
Household Income Brackets in El Granada
With 1,192 households falling in the category, the $200,000+ income range is the most frequent in El Granada, accounting for 56.1% of all households. In contrast, only 26 households (1.2%) fall into the $15,000 to $24,999 income bracket, making it the least populous group.
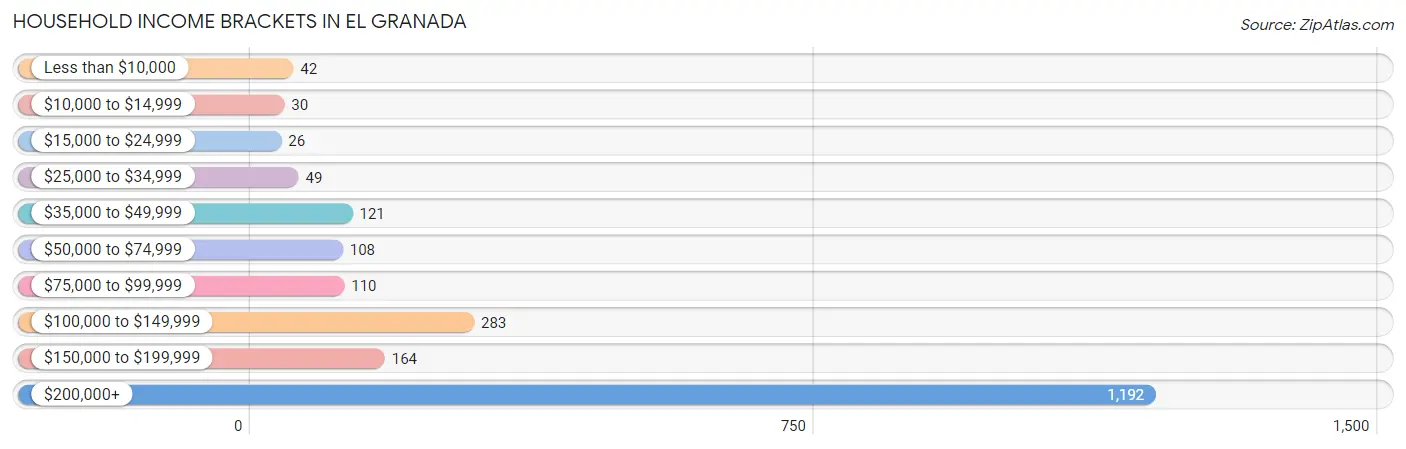
| Income Bracket | # Households | % Households |
| Less than $10,000 | 42 | 2.0% |
| $10,000 to $14,999 | 30 | 1.4% |
| $15,000 to $24,999 | 26 | 1.2% |
| $25,000 to $34,999 | 49 | 2.3% |
| $35,000 to $49,999 | 121 | 5.7% |
| $50,000 to $74,999 | 108 | 5.1% |
| $75,000 to $99,999 | 110 | 5.2% |
| $100,000 to $149,999 | 283 | 13.3% |
| $150,000 to $199,999 | 164 | 7.7% |
| $200,000+ | 1,192 | 56.1% |
Household Income by Householder Age in El Granada
The median household income in El Granada is $216,104, with the highest median household income of $250,001 found in the 25 to 44 years age bracket for the primary householder. A total of 419 households (19.7%) fall into this category.
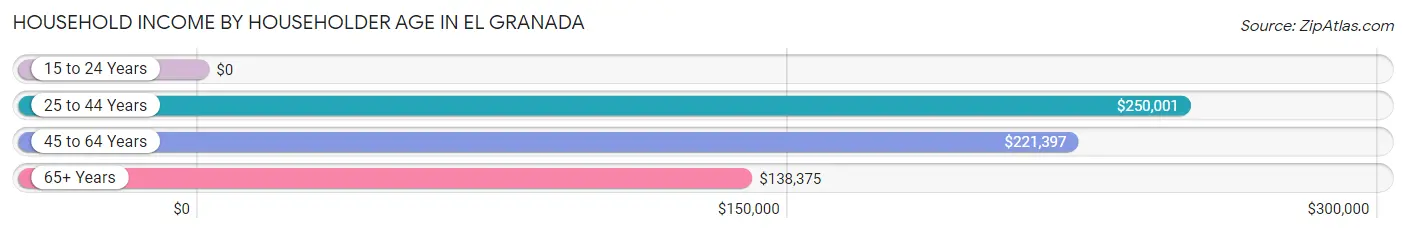
| Income Bracket | # Households | Median Income |
| 15 to 24 Years | 0 (0.0%) | $0 |
| 25 to 44 Years | 419 (19.7%) | $250,001 |
| 45 to 64 Years | 1,096 (51.6%) | $221,397 |
| 65+ Years | 610 (28.7%) | $138,375 |
| Total | 2,125 (100.0%) | $216,104 |
Poverty in El Granada
Income Below Poverty by Sex and Age in El Granada
With 5.0% poverty level for males and 1.7% for females among the residents of El Granada, 18 to 24 year old males and 35 to 44 year old females are the most vulnerable to poverty, with 27 males (18.9%) and 20 females (5.9%) in their respective age groups living below the poverty level.
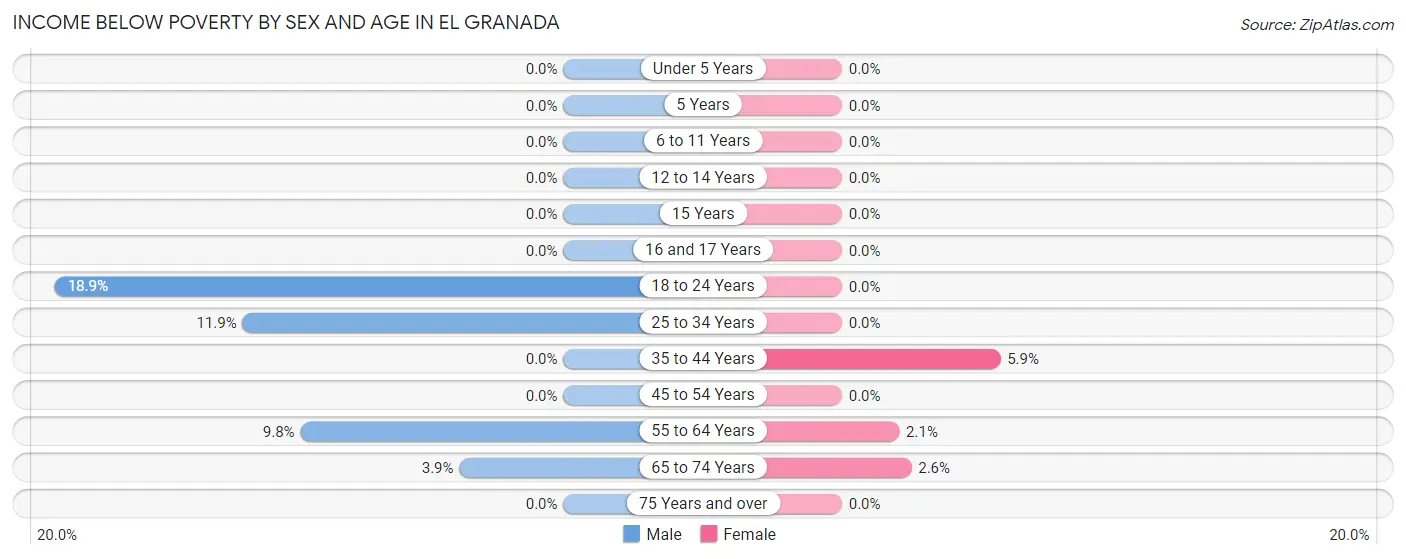
| Age Bracket | Male | Female |
| Under 5 Years | 0 (0.0%) | 0 (0.0%) |
| 5 Years | 0 (0.0%) | 0 (0.0%) |
| 6 to 11 Years | 0 (0.0%) | 0 (0.0%) |
| 12 to 14 Years | 0 (0.0%) | 0 (0.0%) |
| 15 Years | 0 (0.0%) | 0 (0.0%) |
| 16 and 17 Years | 0 (0.0%) | 0 (0.0%) |
| 18 to 24 Years | 27 (18.9%) | 0 (0.0%) |
| 25 to 34 Years | 43 (11.9%) | 0 (0.0%) |
| 35 to 44 Years | 0 (0.0%) | 20 (5.9%) |
| 45 to 54 Years | 0 (0.0%) | 0 (0.0%) |
| 55 to 64 Years | 64 (9.8%) | 13 (2.1%) |
| 65 to 74 Years | 13 (3.9%) | 11 (2.6%) |
| 75 Years and over | 0 (0.0%) | 0 (0.0%) |
| Total | 147 (5.0%) | 44 (1.7%) |
Income Above Poverty by Sex and Age in El Granada
According to the poverty statistics in El Granada, males aged under 5 years and females aged under 5 years are the age groups that are most secure financially, with 100.0% of males and 100.0% of females in these age groups living above the poverty line.
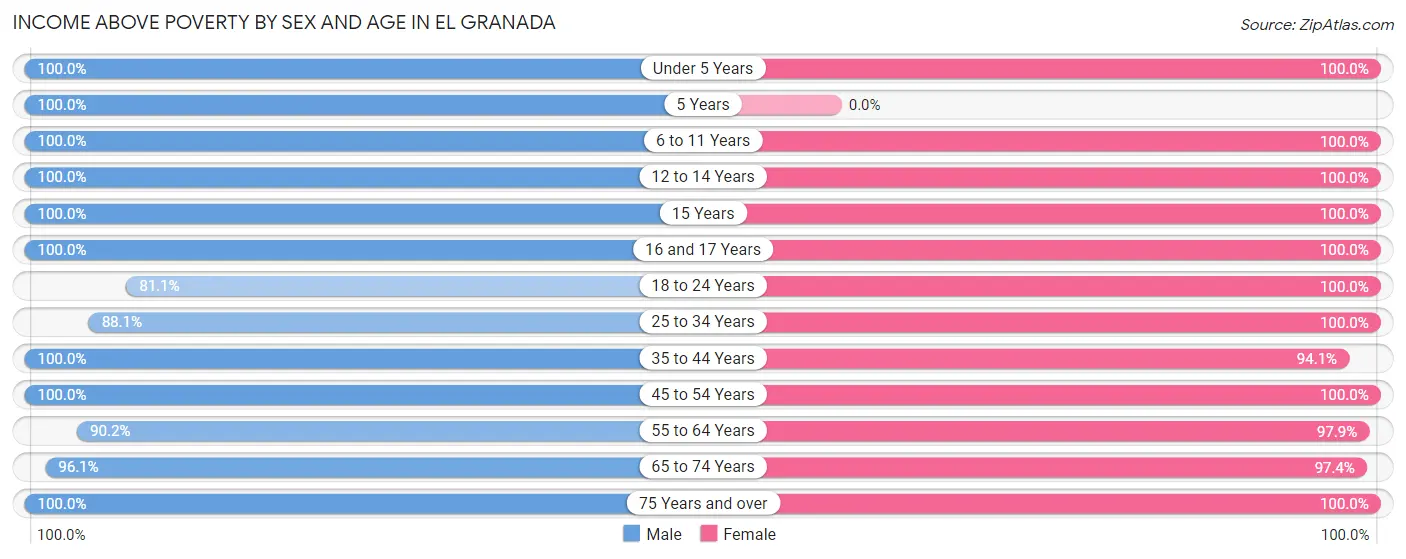
| Age Bracket | Male | Female |
| Under 5 Years | 52 (100.0%) | 70 (100.0%) |
| 5 Years | 25 (100.0%) | 0 (0.0%) |
| 6 to 11 Years | 186 (100.0%) | 89 (100.0%) |
| 12 to 14 Years | 130 (100.0%) | 153 (100.0%) |
| 15 Years | 24 (100.0%) | 18 (100.0%) |
| 16 and 17 Years | 68 (100.0%) | 144 (100.0%) |
| 18 to 24 Years | 116 (81.1%) | 221 (100.0%) |
| 25 to 34 Years | 318 (88.1%) | 207 (100.0%) |
| 35 to 44 Years | 422 (100.0%) | 320 (94.1%) |
| 45 to 54 Years | 337 (100.0%) | 301 (100.0%) |
| 55 to 64 Years | 592 (90.2%) | 597 (97.9%) |
| 65 to 74 Years | 324 (96.1%) | 415 (97.4%) |
| 75 Years and over | 202 (100.0%) | 73 (100.0%) |
| Total | 2,796 (95.0%) | 2,608 (98.3%) |
Income Below Poverty Among Married-Couple Families in El Granada
The poverty statistics for married-couple families in El Granada show that 0.9% or 13 of the total 1,413 families live below the poverty line. Families with no children have the highest poverty rate of 1.2%, comprising of 13 families. On the other hand, families with 1 or 2 children have the lowest poverty rate of 0.0%, which includes 0 families.
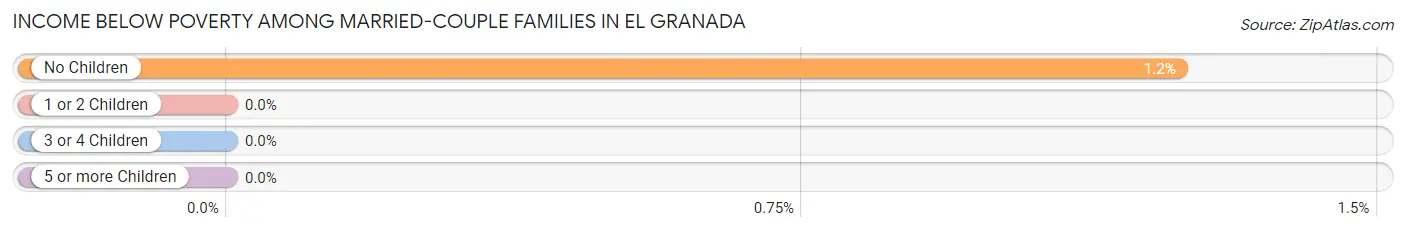
| Children | Above Poverty | Below Poverty |
| No Children | 1,039 (98.8%) | 13 (1.2%) |
| 1 or 2 Children | 260 (100.0%) | 0 (0.0%) |
| 3 or 4 Children | 93 (100.0%) | 0 (0.0%) |
| 5 or more Children | 8 (100.0%) | 0 (0.0%) |
| Total | 1,400 (99.1%) | 13 (0.9%) |
Income Below Poverty Among Single-Parent Households in El Granada
| Children | Single Father | Single Mother |
| No Children | 0 (0.0%) | 0 (0.0%) |
| 1 or 2 Children | 0 (0.0%) | 0 (0.0%) |
| 3 or 4 Children | 0 (0.0%) | 0 (0.0%) |
| 5 or more Children | 0 (0.0%) | 0 (0.0%) |
| Total | 0 (0.0%) | 0 (0.0%) |
Income Below Poverty Among Married-Couple vs Single-Parent Households in El Granada
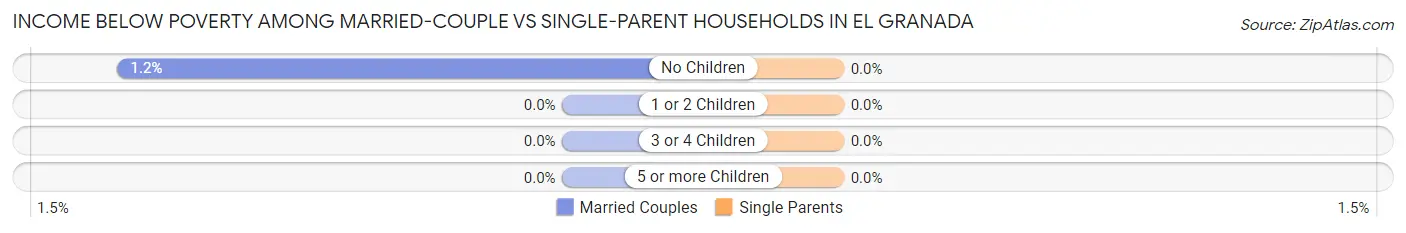
| Children | Married-Couple Families | Single-Parent Households |
| No Children | 13 (1.2%) | 0 (0.0%) |
| 1 or 2 Children | 0 (0.0%) | 0 (0.0%) |
| 3 or 4 Children | 0 (0.0%) | 0 (0.0%) |
| 5 or more Children | 0 (0.0%) | 0 (0.0%) |
| Total | 13 (0.9%) | 0 (0.0%) |
Race in El Granada
The most populous races in El Granada are White / Caucasian (4,913 | 86.9%), Hispanic or Latino (552 | 9.8%), and Some other Race (321 | 5.7%).
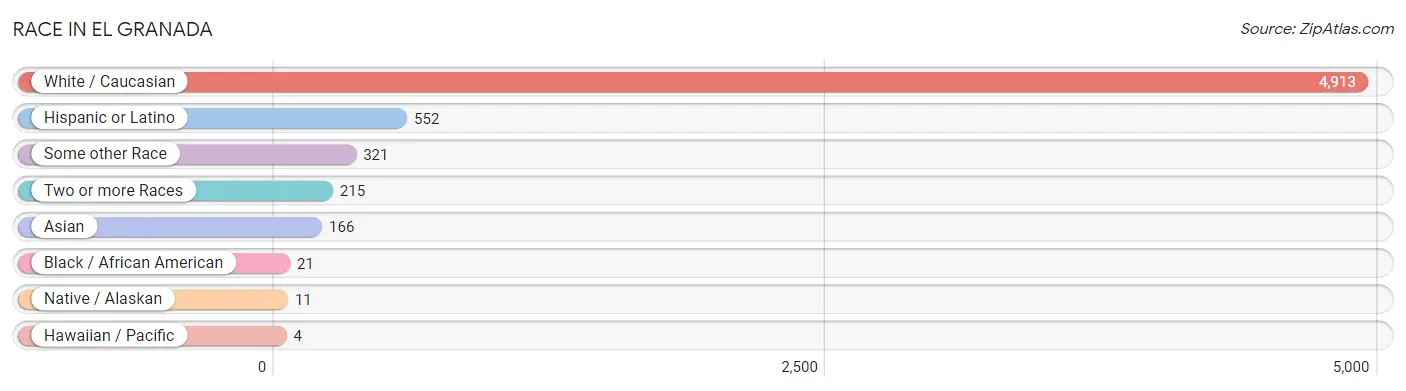
| Race | # Population | % Population |
| Asian | 166 | 2.9% |
| Black / African American | 21 | 0.4% |
| Hawaiian / Pacific | 4 | 0.1% |
| Hispanic or Latino | 552 | 9.8% |
| Native / Alaskan | 11 | 0.2% |
| White / Caucasian | 4,913 | 86.9% |
| Two or more Races | 215 | 3.8% |
| Some other Race | 321 | 5.7% |
| Total | 5,651 | 100.0% |
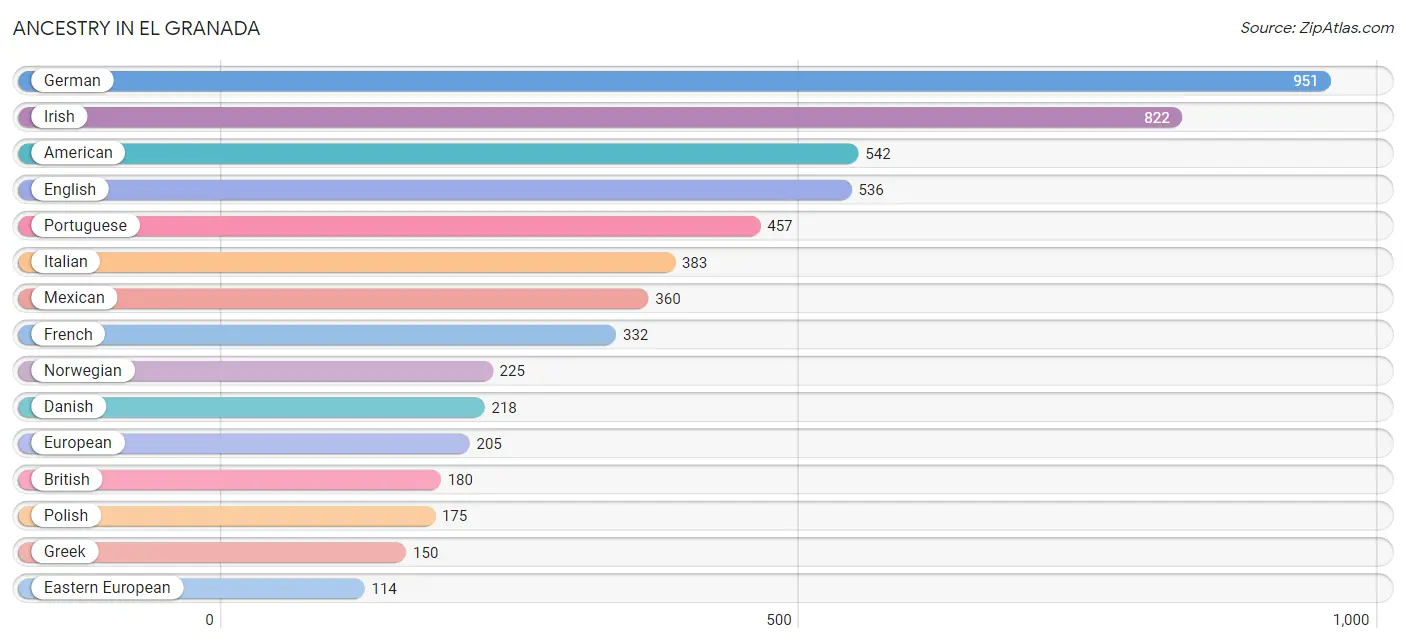
Ancestry in El Granada
The most populous ancestries reported in El Granada are German (951 | 16.8%), Irish (822 | 14.5%), American (542 | 9.6%), English (536 | 9.5%), and Portuguese (457 | 8.1%), together accounting for 58.5% of all El Granada residents.
| Ancestry | # Population | % Population |
| American | 542 | 9.6% |
| Austrian | 7 | 0.1% |
| Bhutanese | 51 | 0.9% |
| British | 180 | 3.2% |
| Central American | 45 | 0.8% |
| Cherokee | 31 | 0.5% |
| Colombian | 42 | 0.7% |
| Croatian | 37 | 0.6% |
| Czech | 11 | 0.2% |
| Danish | 218 | 3.9% |
| Dutch | 75 | 1.3% |
| Eastern European | 114 | 2.0% |
| English | 536 | 9.5% |
| European | 205 | 3.6% |
| French | 332 | 5.9% |
| French Canadian | 11 | 0.2% |
| German | 951 | 16.8% |
| Greek | 150 | 2.6% |
| Hungarian | 46 | 0.8% |
| Indian (Asian) | 47 | 0.8% |
| Irish | 822 | 14.5% |
| Italian | 383 | 6.8% |
| Korean | 34 | 0.6% |
| Lithuanian | 11 | 0.2% |
| Mexican | 360 | 6.4% |
| Mexican American Indian | 11 | 0.2% |
| New Zealander | 43 | 0.8% |
| Norwegian | 225 | 4.0% |
| Pennsylvania German | 44 | 0.8% |
| Polish | 175 | 3.1% |
| Portuguese | 457 | 8.1% |
| Puerto Rican | 18 | 0.3% |
| Romanian | 17 | 0.3% |
| Russian | 114 | 2.0% |
| Salvadoran | 45 | 0.8% |
| Samoan | 4 | 0.1% |
| Scandinavian | 2 | 0.0% |
| Scotch-Irish | 8 | 0.1% |
| Scottish | 97 | 1.7% |
| Serbian | 30 | 0.5% |
| Slovak | 15 | 0.3% |
| Slovene | 61 | 1.1% |
| South American | 42 | 0.7% |
| Spaniard | 87 | 1.5% |
| Swedish | 22 | 0.4% |
| Swiss | 56 | 1.0% |
| Thai | 42 | 0.7% |
| Ukrainian | 12 | 0.2% | View All 48 Rows |
Immigrants in El Granada
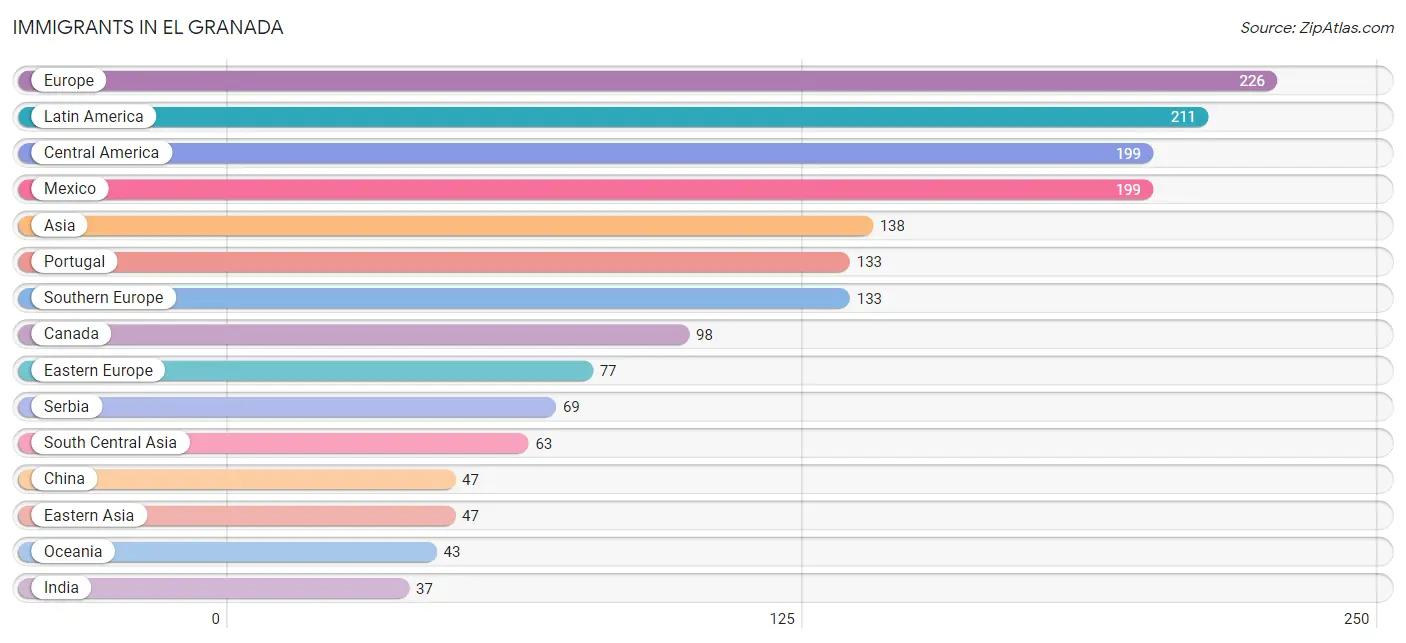
The most numerous immigrant groups reported in El Granada came from Europe (226 | 4.0%), Latin America (211 | 3.7%), Central America (199 | 3.5%), Mexico (199 | 3.5%), and Asia (138 | 2.4%), together accounting for 17.2% of all El Granada residents.
| Immigration Origin | # Population | % Population |
| Asia | 138 | 2.4% |
| Brazil | 12 | 0.2% |
| Canada | 98 | 1.7% |
| Central America | 199 | 3.5% |
| China | 47 | 0.8% |
| Eastern Asia | 47 | 0.8% |
| Eastern Europe | 77 | 1.4% |
| England | 16 | 0.3% |
| Europe | 226 | 4.0% |
| India | 37 | 0.6% |
| Latin America | 211 | 3.7% |
| Mexico | 199 | 3.5% |
| Northern Europe | 16 | 0.3% |
| Oceania | 43 | 0.8% |
| Philippines | 28 | 0.5% |
| Poland | 8 | 0.1% |
| Portugal | 133 | 2.4% |
| Serbia | 69 | 1.2% |
| South America | 12 | 0.2% |
| South Central Asia | 63 | 1.1% |
| South Eastern Asia | 28 | 0.5% |
| Southern Europe | 133 | 2.4% |
| Taiwan | 23 | 0.4% |
| Uzbekistan | 26 | 0.5% | View All 24 Rows |
Sex and Age in El Granada
Sex and Age in El Granada
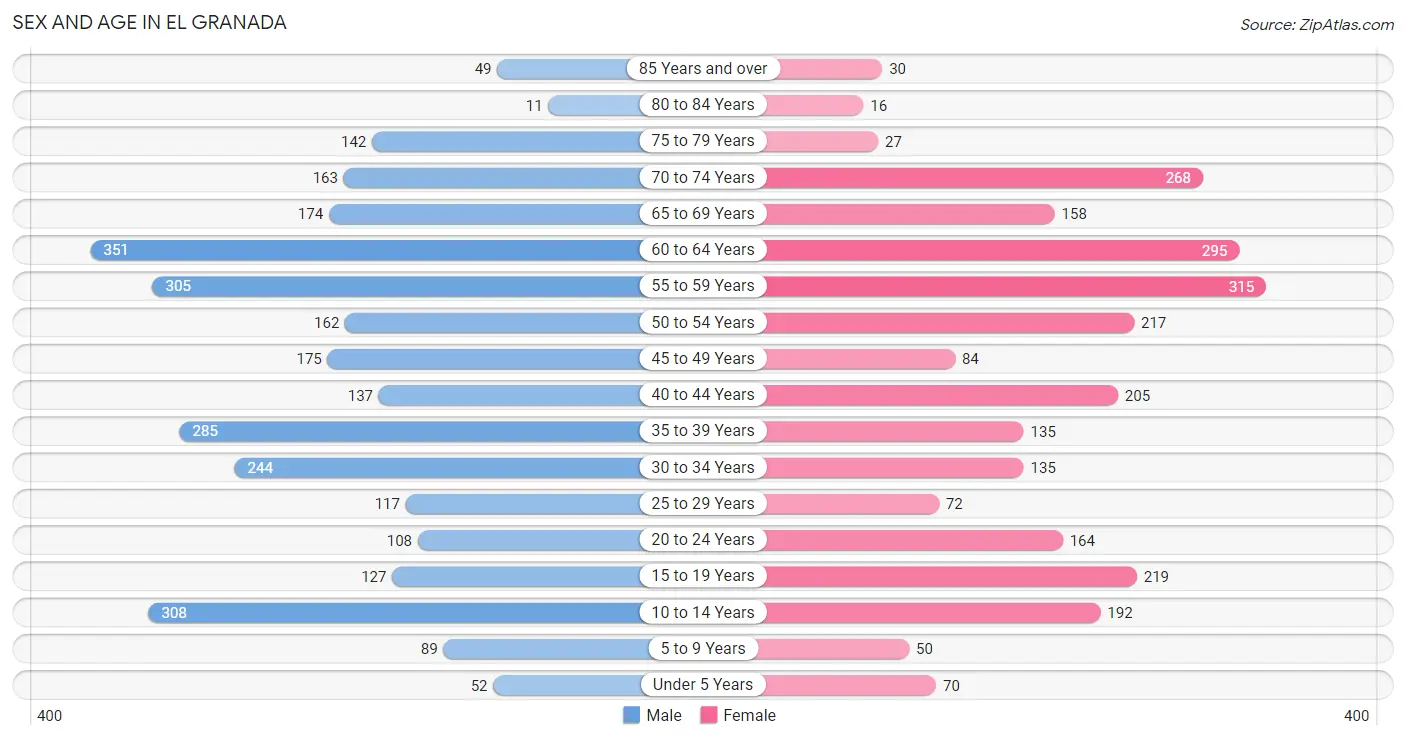
The most populous age groups in El Granada are 60 to 64 Years (351 | 11.7%) for men and 55 to 59 Years (315 | 11.9%) for women.
| Age Bracket | Male | Female |
| Under 5 Years | 52 (1.7%) | 70 (2.6%) |
| 5 to 9 Years | 89 (3.0%) | 50 (1.9%) |
| 10 to 14 Years | 308 (10.3%) | 192 (7.2%) |
| 15 to 19 Years | 127 (4.2%) | 219 (8.3%) |
| 20 to 24 Years | 108 (3.6%) | 164 (6.2%) |
| 25 to 29 Years | 117 (3.9%) | 72 (2.7%) |
| 30 to 34 Years | 244 (8.1%) | 135 (5.1%) |
| 35 to 39 Years | 285 (9.5%) | 135 (5.1%) |
| 40 to 44 Years | 137 (4.6%) | 205 (7.7%) |
| 45 to 49 Years | 175 (5.8%) | 84 (3.2%) |
| 50 to 54 Years | 162 (5.4%) | 217 (8.2%) |
| 55 to 59 Years | 305 (10.2%) | 315 (11.9%) |
| 60 to 64 Years | 351 (11.7%) | 295 (11.1%) |
| 65 to 69 Years | 174 (5.8%) | 158 (6.0%) |
| 70 to 74 Years | 163 (5.4%) | 268 (10.1%) |
| 75 to 79 Years | 142 (4.7%) | 27 (1.0%) |
| 80 to 84 Years | 11 (0.4%) | 16 (0.6%) |
| 85 Years and over | 49 (1.6%) | 30 (1.1%) |
| Total | 2,999 (100.0%) | 2,652 (100.0%) |
Families and Households in El Granada
Median Family Size in El Granada
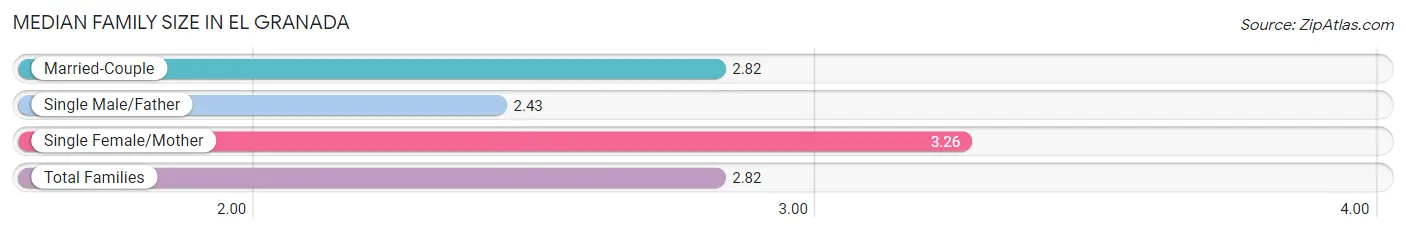
The median family size in El Granada is 2.82 persons per family, with single female/mother families (142 | 8.3%) accounting for the largest median family size of 3.26 persons per family. On the other hand, single male/father families (148 | 8.7%) represent the smallest median family size with 2.43 persons per family.
| Family Type | # Families | Family Size |
| Married-Couple | 1,413 (83.0%) | 2.82 |
| Single Male/Father | 148 (8.7%) | 2.43 |
| Single Female/Mother | 142 (8.3%) | 3.26 |
| Total Families | 1,703 (100.0%) | 2.82 |
Median Household Size in El Granada
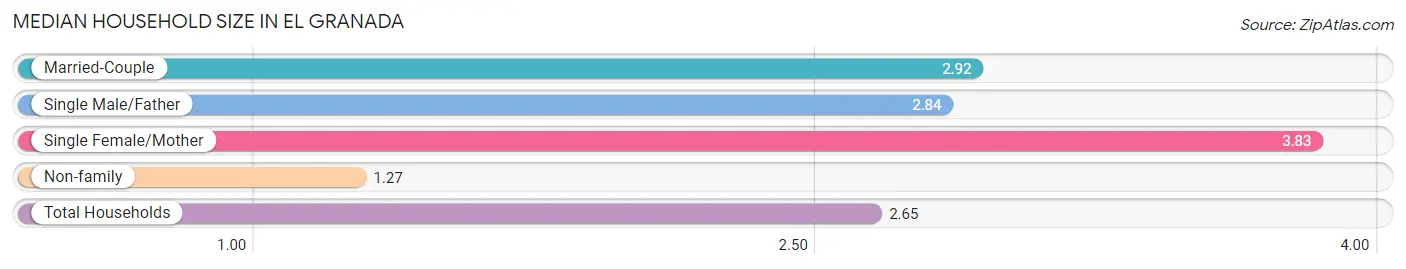
The median household size in El Granada is 2.65 persons per household, with single female/mother households (142 | 6.7%) accounting for the largest median household size of 3.83 persons per household. non-family households (422 | 19.9%) represent the smallest median household size with 1.27 persons per household.
| Household Type | # Households | Household Size |
| Married-Couple | 1,413 (66.5%) | 2.92 |
| Single Male/Father | 148 (7.0%) | 2.84 |
| Single Female/Mother | 142 (6.7%) | 3.83 |
| Non-family | 422 (19.9%) | 1.27 |
| Total Households | 2,125 (100.0%) | 2.65 |
Household Size by Marriage Status in El Granada
Out of a total of 2,125 households in El Granada, 1,703 (80.1%) are family households, while 422 (19.9%) are nonfamily households. The most numerous type of family households are 2-person households, comprising 806, and the most common type of nonfamily households are 1-person households, comprising 315.
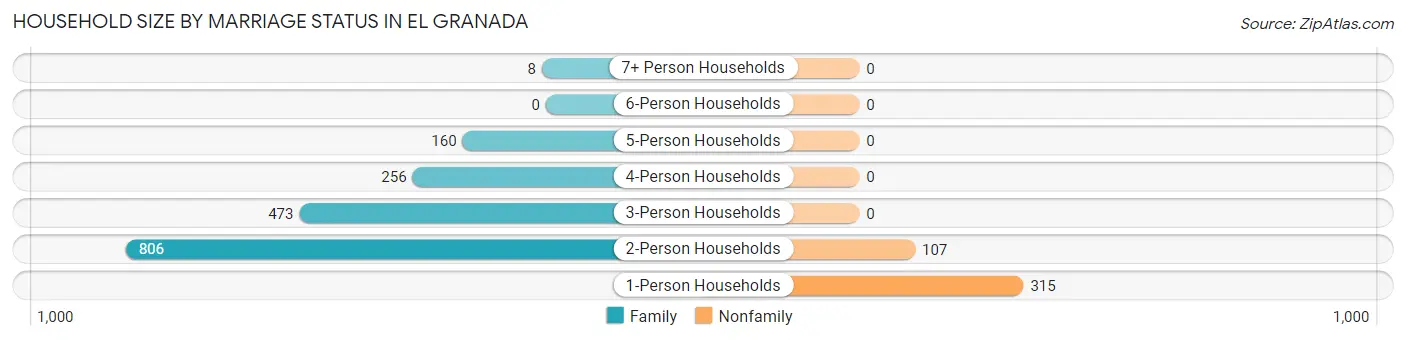
| Household Size | Family Households | Nonfamily Households |
| 1-Person Households | - | 315 (14.8%) |
| 2-Person Households | 806 (37.9%) | 107 (5.0%) |
| 3-Person Households | 473 (22.3%) | 0 (0.0%) |
| 4-Person Households | 256 (12.0%) | 0 (0.0%) |
| 5-Person Households | 160 (7.5%) | 0 (0.0%) |
| 6-Person Households | 0 (0.0%) | 0 (0.0%) |
| 7+ Person Households | 8 (0.4%) | 0 (0.0%) |
| Total | 1,703 (80.1%) | 422 (19.9%) |
Female Fertility in El Granada
Fertility by Age in El Granada
| Age Bracket | Women with Births | Births / 1,000 Women |
| 15 to 19 years | 0 (0.0%) | 0.0 |
| 20 to 34 years | 0 (0.0%) | 0.0 |
| 35 to 50 years | 0 (0.0%) | 0.0 |
| Total | 0 (0.0%) | 0.0 |
Fertility by Age by Marriage Status in El Granada
| Age Bracket | Married | Unmarried |
| 15 to 19 years | 0 (0.0%) | 0 (0.0%) |
| 20 to 34 years | 0 (0.0%) | 0 (0.0%) |
| 35 to 50 years | 0 (0.0%) | 0 (0.0%) |
| Total | 0 (0.0%) | 0 (0.0%) |
Fertility by Education in El Granada
| Educational Attainment | Women with Births | Births / 1,000 Women |
| Less than High School | 0 (0.0%) | 0.0 |
| High School Diploma | 0 (0.0%) | 0.0 |
| College or Associate's Degree | 0 (0.0%) | 0.0 |
| Bachelor's Degree | 0 (0.0%) | 0.0 |
| Graduate Degree | 0 (0.0%) | 0.0 |
| Total | 0 (0.0%) | 0.0 |
Fertility by Education by Marriage Status in El Granada
| Educational Attainment | Married | Unmarried |
| Less than High School | 0 (0.0%) | 0 (0.0%) |
| High School Diploma | 0 (0.0%) | 0 (0.0%) |
| College or Associate's Degree | 0 (0.0%) | 0 (0.0%) |
| Bachelor's Degree | 0 (0.0%) | 0 (0.0%) |
| Graduate Degree | 0 (0.0%) | 0 (0.0%) |
| Total | 0 (0.0%) | 0 (0.0%) |
Employment Characteristics in El Granada
Employment by Class of Employer in El Granada
Among the 2,859 employed individuals in El Granada, private company employees (2,007 | 70.2%), not-for-profit organizations (233 | 8.2%), and self-employed (not incorporated) (200 | 7.0%) make up the most common classes of employment.
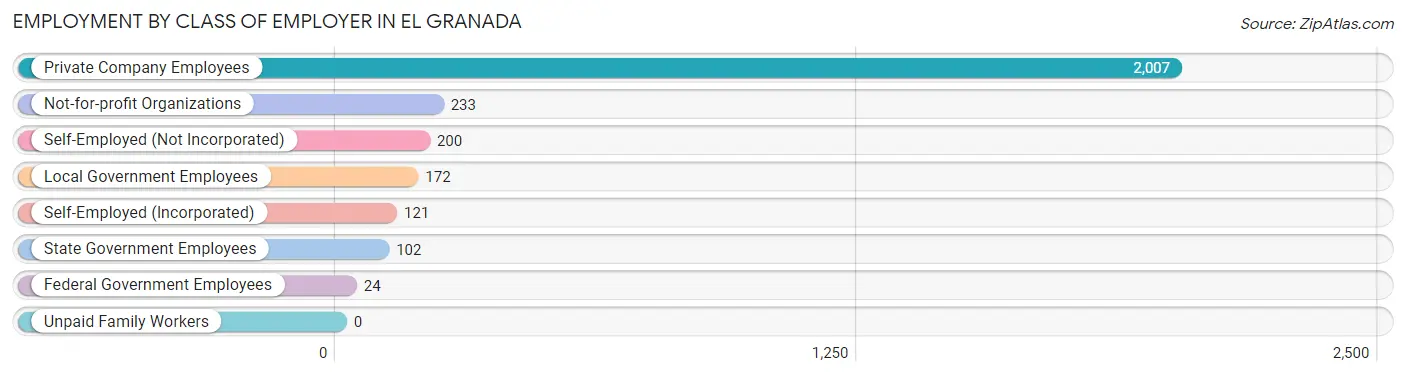
| Employer Class | # Employees | % Employees |
| Private Company Employees | 2,007 | 70.2% |
| Self-Employed (Incorporated) | 121 | 4.2% |
| Self-Employed (Not Incorporated) | 200 | 7.0% |
| Not-for-profit Organizations | 233 | 8.2% |
| Local Government Employees | 172 | 6.0% |
| State Government Employees | 102 | 3.6% |
| Federal Government Employees | 24 | 0.8% |
| Unpaid Family Workers | 0 | 0.0% |
| Total | 2,859 | 100.0% |
Employment Status by Age in El Granada
According to the labor force statistics for El Granada, out of the total population over 16 years of age (4,848), 65.0% or 3,151 individuals are in the labor force, with 8.3% or 262 of them unemployed. The age group with the highest labor force participation rate is 30 to 34 years, with 100.0% or 379 individuals in the labor force. Within the labor force, the 35 to 44 years age range has the highest percentage of unemployed individuals, with 30.3% or 211 of them being unemployed.
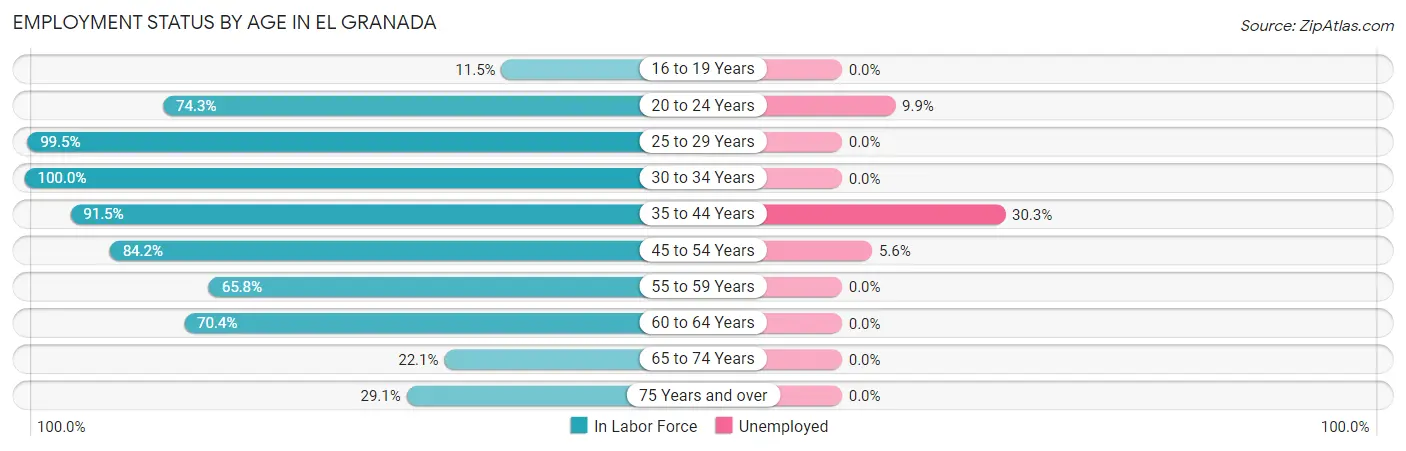
| Age Bracket | In Labor Force | Unemployed |
| 16 to 19 Years | 35 (11.5%) | 0 (0.0%) |
| 20 to 24 Years | 202 (74.3%) | 20 (9.9%) |
| 25 to 29 Years | 188 (99.5%) | 0 (0.0%) |
| 30 to 34 Years | 379 (100.0%) | 0 (0.0%) |
| 35 to 44 Years | 697 (91.5%) | 211 (30.3%) |
| 45 to 54 Years | 537 (84.2%) | 30 (5.6%) |
| 55 to 59 Years | 408 (65.8%) | 0 (0.0%) |
| 60 to 64 Years | 455 (70.4%) | 0 (0.0%) |
| 65 to 74 Years | 169 (22.1%) | 0 (0.0%) |
| 75 Years and over | 80 (29.1%) | 0 (0.0%) |
| Total | 3,151 (65.0%) | 262 (8.3%) |
Employment Status by Educational Attainment in El Granada
According to labor force statistics for El Granada, 82.4% of individuals (2,665) out of the total population between 25 and 64 years of age (3,234) are in the labor force, with 9.0% or 240 of them being unemployed. The group with the highest labor force participation rate are those with the educational attainment of less than high school, with 98.0% or 50 individuals in the labor force. Within the labor force, individuals with high school diploma education have the highest percentage of unemployment, with 46.3% or 142 of them being unemployed.
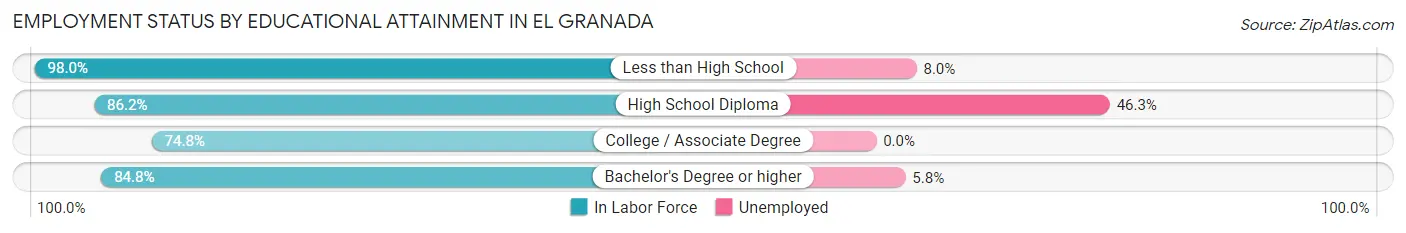
| Educational Attainment | In Labor Force | Unemployed |
| Less than High School | 50 (98.0%) | 4 (8.0%) |
| High School Diploma | 307 (86.2%) | 165 (46.3%) |
| College / Associate Degree | 673 (74.8%) | 0 (0.0%) |
| Bachelor's Degree or higher | 1,634 (84.8%) | 112 (5.8%) |
| Total | 2,665 (82.4%) | 291 (9.0%) |
Employment Occupations by Sex in El Granada
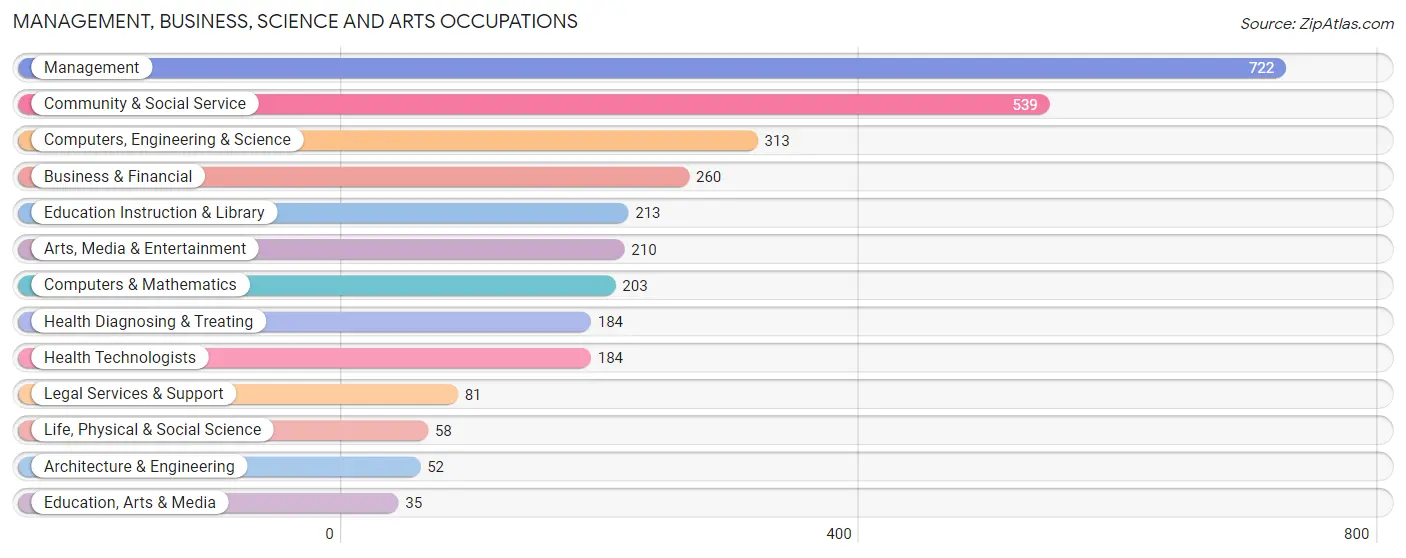
Management, Business, Science and Arts Occupations
The most common Management, Business, Science and Arts occupations in El Granada are Management (722 | 25.0%), Community & Social Service (539 | 18.7%), Computers, Engineering & Science (313 | 10.8%), Business & Financial (260 | 9.0%), and Education Instruction & Library (213 | 7.4%).
Management, Business, Science and Arts Occupations by Sex
Within the Management, Business, Science and Arts occupations in El Granada, the most male-oriented occupations are Computers & Mathematics (84.7%), Computers, Engineering & Science (73.8%), and Architecture & Engineering (63.5%), while the most female-oriented occupations are Health Diagnosing & Treating (91.3%), Health Technologists (91.3%), and Education, Arts & Media (85.7%).
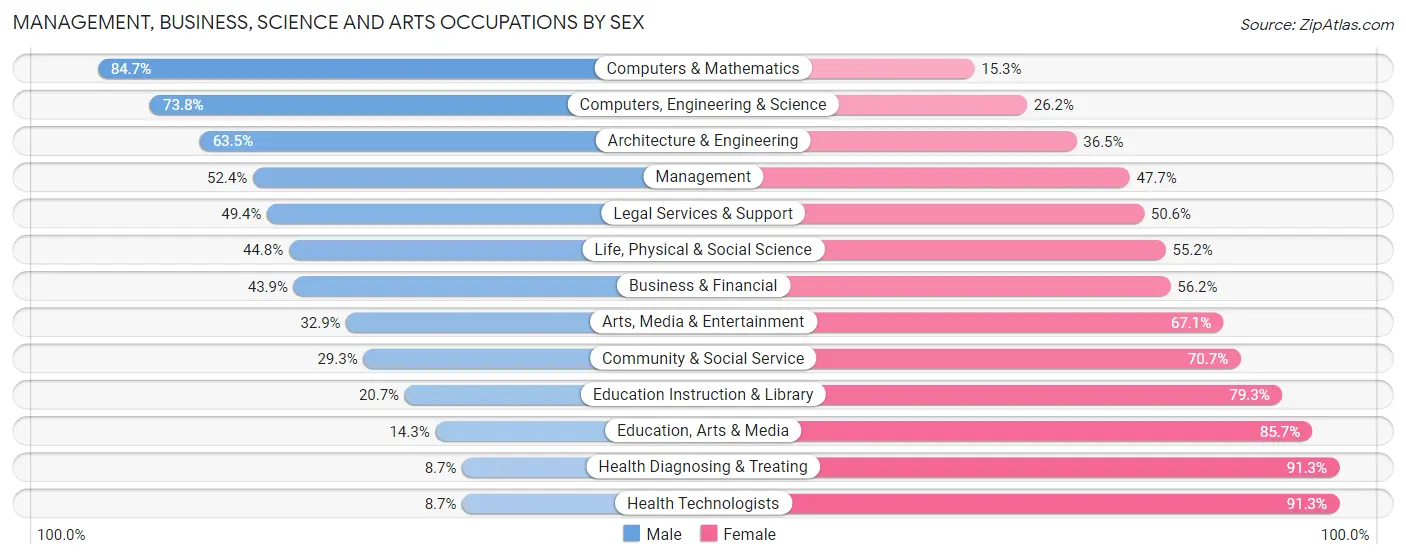
| Occupation | Male | Female |
| Management | 378 (52.3%) | 344 (47.6%) |
| Business & Financial | 114 (43.9%) | 146 (56.1%) |
| Computers, Engineering & Science | 231 (73.8%) | 82 (26.2%) |
| Computers & Mathematics | 172 (84.7%) | 31 (15.3%) |
| Architecture & Engineering | 33 (63.5%) | 19 (36.5%) |
| Life, Physical & Social Science | 26 (44.8%) | 32 (55.2%) |
| Community & Social Service | 158 (29.3%) | 381 (70.7%) |
| Education, Arts & Media | 5 (14.3%) | 30 (85.7%) |
| Legal Services & Support | 40 (49.4%) | 41 (50.6%) |
| Education Instruction & Library | 44 (20.7%) | 169 (79.3%) |
| Arts, Media & Entertainment | 69 (32.9%) | 141 (67.1%) |
| Health Diagnosing & Treating | 16 (8.7%) | 168 (91.3%) |
| Health Technologists | 16 (8.7%) | 168 (91.3%) |
| Total (Category) | 897 (44.5%) | 1,121 (55.5%) |
| Total (Overall) | 1,488 (51.5%) | 1,401 (48.5%) |
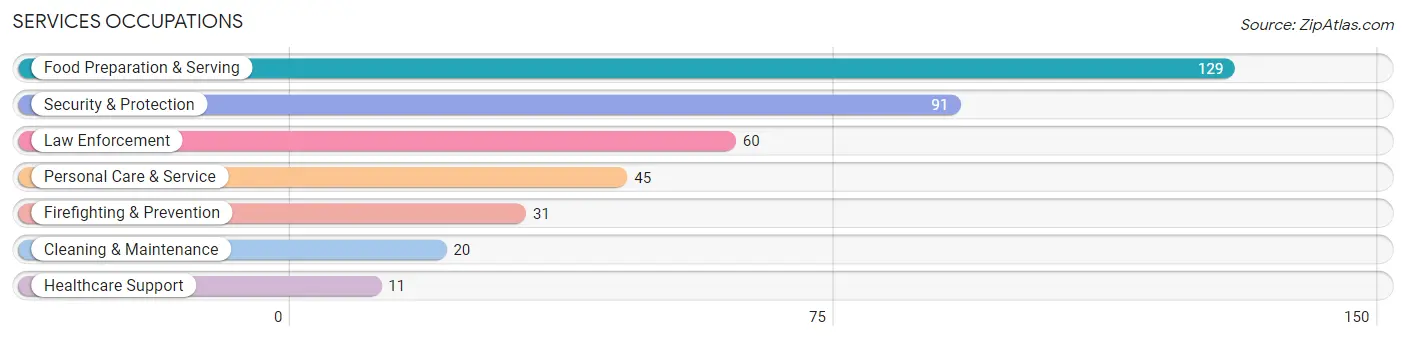
Services Occupations
The most common Services occupations in El Granada are Food Preparation & Serving (129 | 4.5%), Security & Protection (91 | 3.2%), Law Enforcement (60 | 2.1%), Personal Care & Service (45 | 1.6%), and Firefighting & Prevention (31 | 1.1%).
Services Occupations by Sex
Within the Services occupations in El Granada, the most male-oriented occupations are Security & Protection (100.0%), Firefighting & Prevention (100.0%), and Law Enforcement (100.0%), while the most female-oriented occupations are Healthcare Support (100.0%), Cleaning & Maintenance (100.0%), and Personal Care & Service (100.0%).
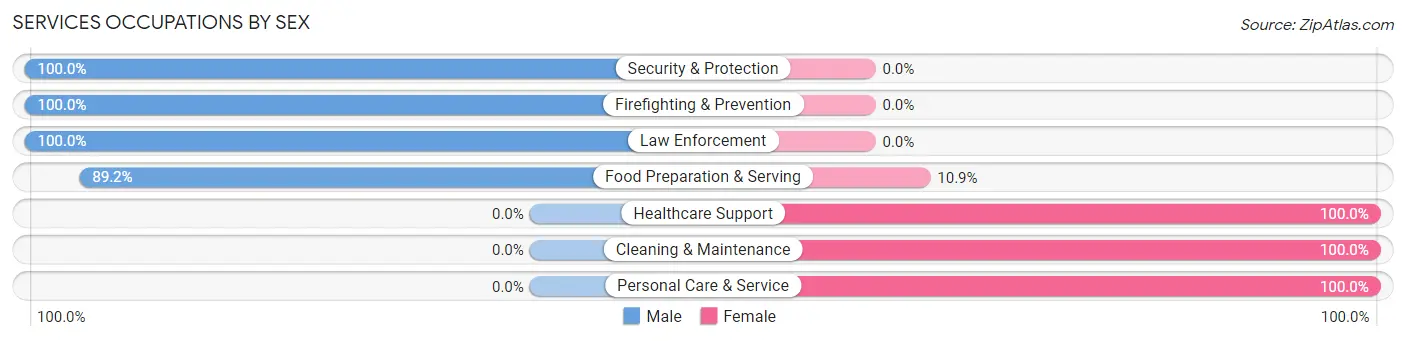
| Occupation | Male | Female |
| Healthcare Support | 0 (0.0%) | 11 (100.0%) |
| Security & Protection | 91 (100.0%) | 0 (0.0%) |
| Firefighting & Prevention | 31 (100.0%) | 0 (0.0%) |
| Law Enforcement | 60 (100.0%) | 0 (0.0%) |
| Food Preparation & Serving | 115 (89.1%) | 14 (10.8%) |
| Cleaning & Maintenance | 0 (0.0%) | 20 (100.0%) |
| Personal Care & Service | 0 (0.0%) | 45 (100.0%) |
| Total (Category) | 206 (69.6%) | 90 (30.4%) |
| Total (Overall) | 1,488 (51.5%) | 1,401 (48.5%) |
Sales and Office Occupations
The most common Sales and Office occupations in El Granada are Sales & Related (176 | 6.1%), and Office & Administration (150 | 5.2%).

Sales and Office Occupations by Sex

| Occupation | Male | Female |
| Sales & Related | 102 (58.0%) | 74 (42.0%) |
| Office & Administration | 34 (22.7%) | 116 (77.3%) |
| Total (Category) | 136 (41.7%) | 190 (58.3%) |
| Total (Overall) | 1,488 (51.5%) | 1,401 (48.5%) |
Natural Resources, Construction and Maintenance Occupations
The most common Natural Resources, Construction and Maintenance occupations in El Granada are Farming, Fishing & Forestry (44 | 1.5%), and Construction & Extraction (24 | 0.8%).
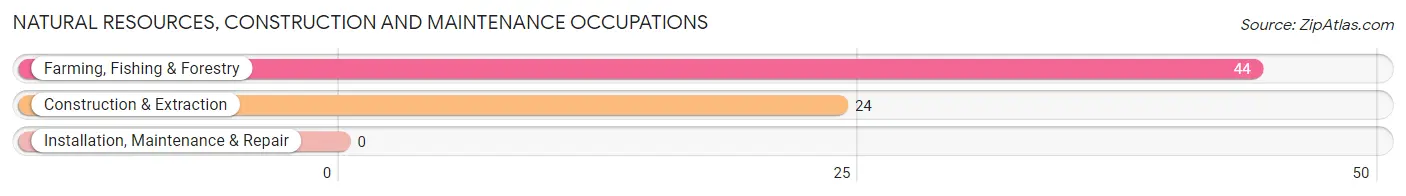
Natural Resources, Construction and Maintenance Occupations by Sex
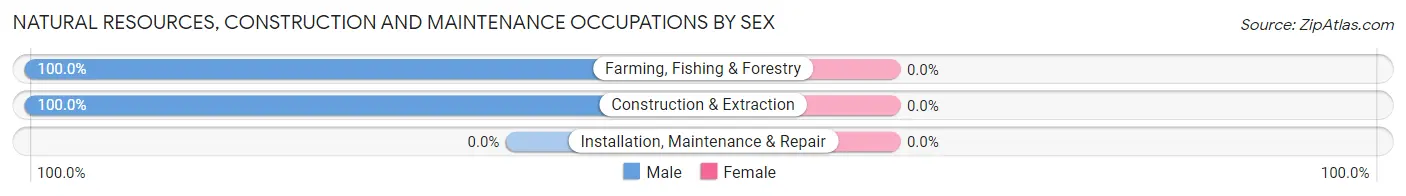
| Occupation | Male | Female |
| Farming, Fishing & Forestry | 44 (100.0%) | 0 (0.0%) |
| Construction & Extraction | 24 (100.0%) | 0 (0.0%) |
| Installation, Maintenance & Repair | 0 (0.0%) | 0 (0.0%) |
| Total (Category) | 68 (100.0%) | 0 (0.0%) |
| Total (Overall) | 1,488 (51.5%) | 1,401 (48.5%) |
Production, Transportation and Moving Occupations
The most common Production, Transportation and Moving occupations in El Granada are Transportation (127 | 4.4%), Material Moving (43 | 1.5%), and Production (11 | 0.4%).
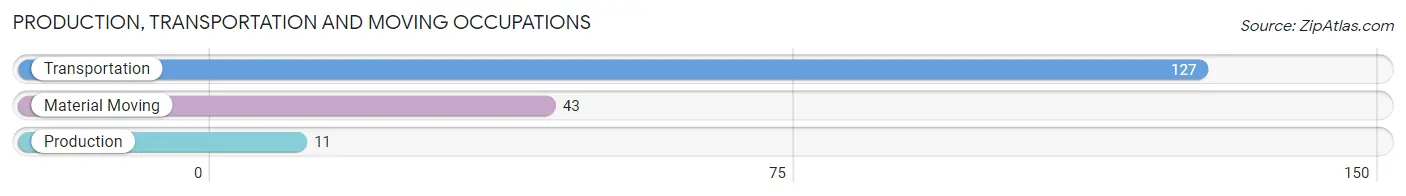
Production, Transportation and Moving Occupations by Sex
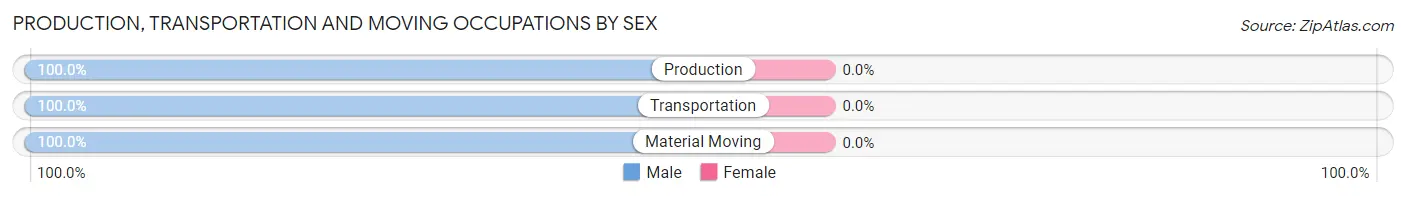
| Occupation | Male | Female |
| Production | 11 (100.0%) | 0 (0.0%) |
| Transportation | 127 (100.0%) | 0 (0.0%) |
| Material Moving | 43 (100.0%) | 0 (0.0%) |
| Total (Category) | 181 (100.0%) | 0 (0.0%) |
| Total (Overall) | 1,488 (51.5%) | 1,401 (48.5%) |
Employment Industries by Sex in El Granada
Employment Industries in El Granada
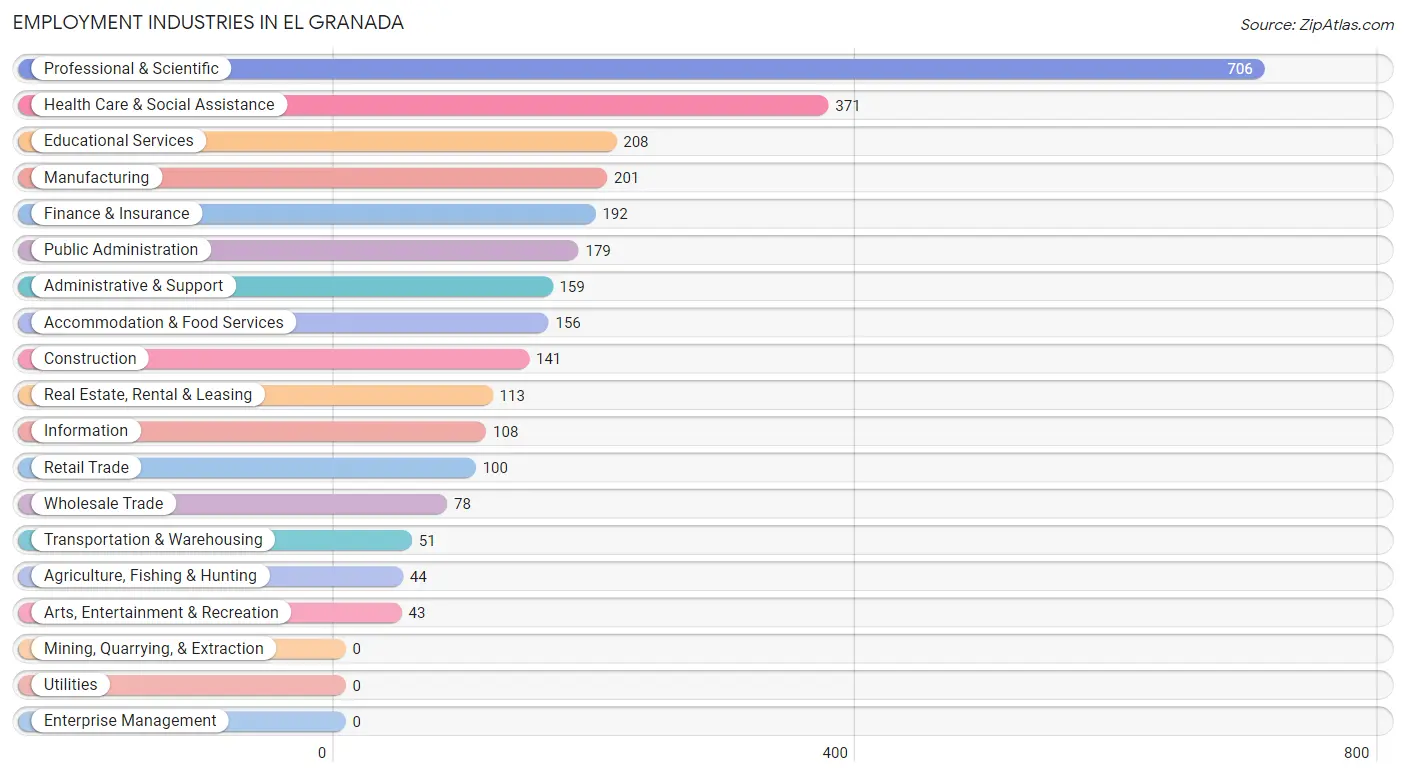
The major employment industries in El Granada include Professional & Scientific (706 | 24.4%), Health Care & Social Assistance (371 | 12.8%), Educational Services (208 | 7.2%), Manufacturing (201 | 7.0%), and Finance & Insurance (192 | 6.7%).
Employment Industries by Sex in El Granada
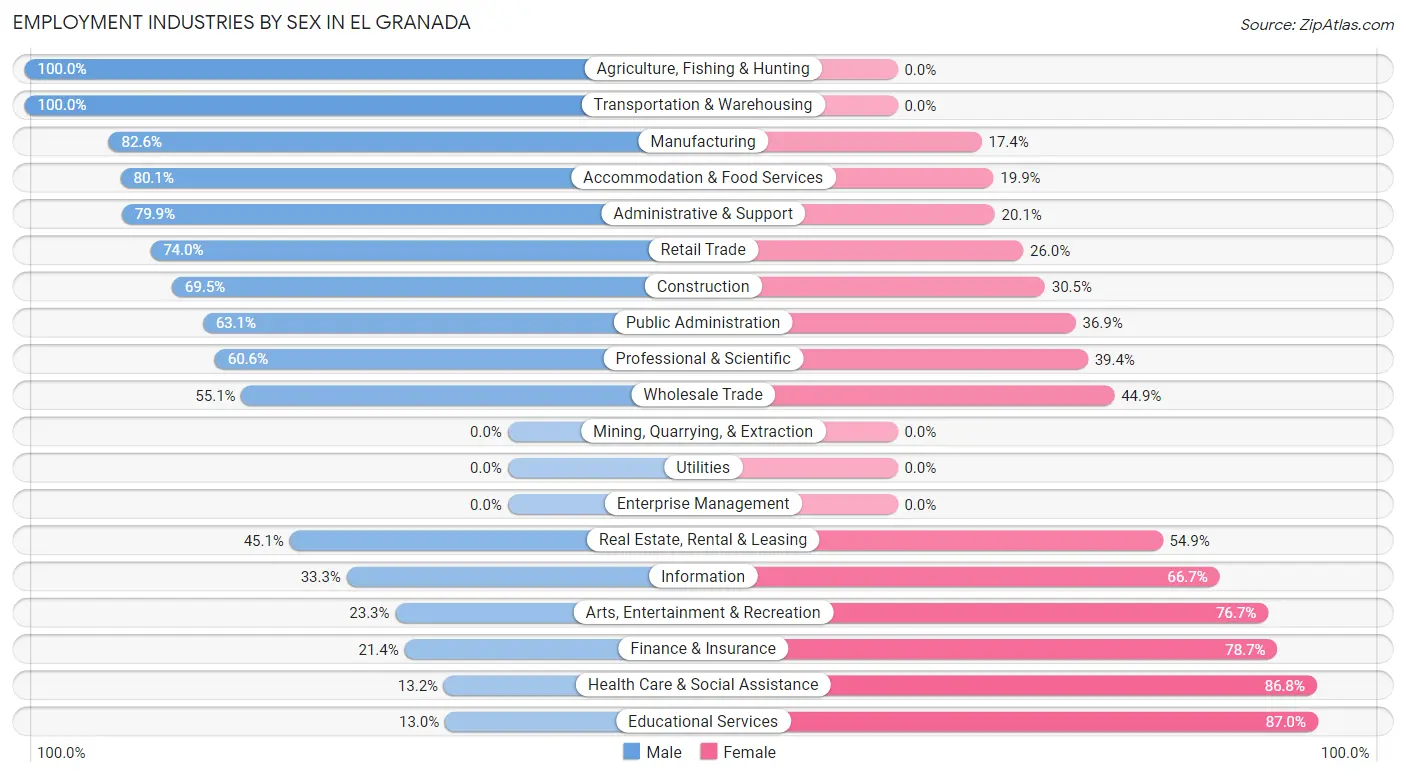
The El Granada industries that see more men than women are Agriculture, Fishing & Hunting (100.0%), Transportation & Warehousing (100.0%), and Manufacturing (82.6%), whereas the industries that tend to have a higher number of women are Educational Services (87.0%), Health Care & Social Assistance (86.8%), and Finance & Insurance (78.6%).
| Industry | Male | Female |
| Agriculture, Fishing & Hunting | 44 (100.0%) | 0 (0.0%) |
| Mining, Quarrying, & Extraction | 0 (0.0%) | 0 (0.0%) |
| Construction | 98 (69.5%) | 43 (30.5%) |
| Manufacturing | 166 (82.6%) | 35 (17.4%) |
| Wholesale Trade | 43 (55.1%) | 35 (44.9%) |
| Retail Trade | 74 (74.0%) | 26 (26.0%) |
| Transportation & Warehousing | 51 (100.0%) | 0 (0.0%) |
| Utilities | 0 (0.0%) | 0 (0.0%) |
| Information | 36 (33.3%) | 72 (66.7%) |
| Finance & Insurance | 41 (21.3%) | 151 (78.6%) |
| Real Estate, Rental & Leasing | 51 (45.1%) | 62 (54.9%) |
| Professional & Scientific | 428 (60.6%) | 278 (39.4%) |
| Enterprise Management | 0 (0.0%) | 0 (0.0%) |
| Administrative & Support | 127 (79.9%) | 32 (20.1%) |
| Educational Services | 27 (13.0%) | 181 (87.0%) |
| Health Care & Social Assistance | 49 (13.2%) | 322 (86.8%) |
| Arts, Entertainment & Recreation | 10 (23.3%) | 33 (76.7%) |
| Accommodation & Food Services | 125 (80.1%) | 31 (19.9%) |
| Public Administration | 113 (63.1%) | 66 (36.9%) |
| Total | 1,488 (51.5%) | 1,401 (48.5%) |
Education in El Granada
School Enrollment in El Granada
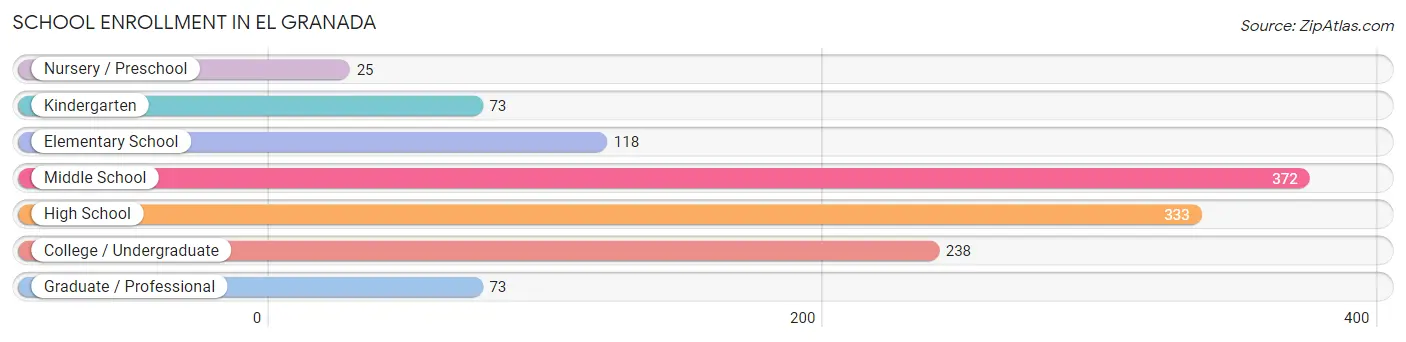
The most common levels of schooling among the 1,232 students in El Granada are middle school (372 | 30.2%), high school (333 | 27.0%), and college / undergraduate (238 | 19.3%).
| School Level | # Students | % Students |
| Nursery / Preschool | 25 | 2.0% |
| Kindergarten | 73 | 5.9% |
| Elementary School | 118 | 9.6% |
| Middle School | 372 | 30.2% |
| High School | 333 | 27.0% |
| College / Undergraduate | 238 | 19.3% |
| Graduate / Professional | 73 | 5.9% |
| Total | 1,232 | 100.0% |
School Enrollment by Age by Funding Source in El Granada
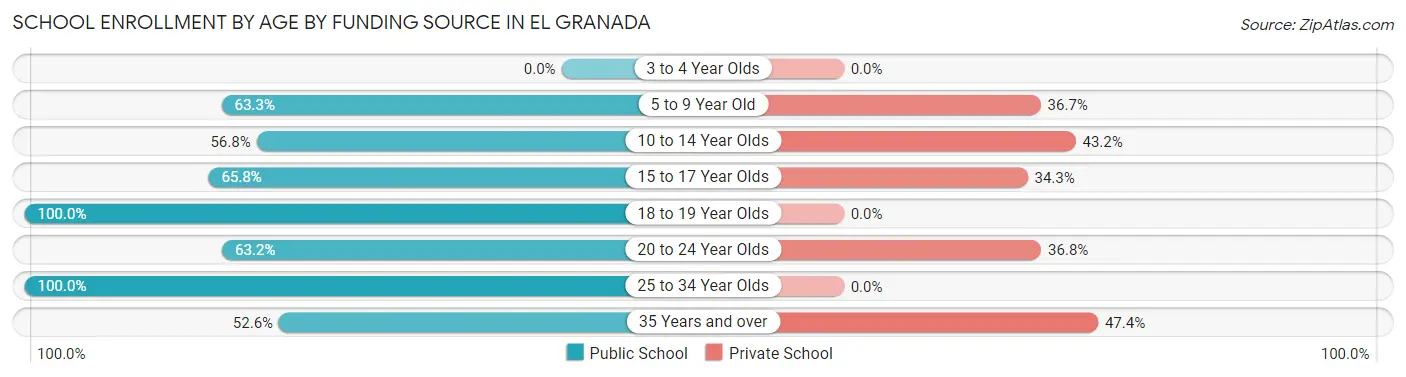
Out of a total of 1,232 students who are enrolled in schools in El Granada, 428 (34.7%) attend a private institution, while the remaining 804 (65.3%) are enrolled in public schools. The age group of 35 years and over has the highest likelihood of being enrolled in private schools, with 54 (47.4% in the age bracket) enrolled. Conversely, the age group of 18 to 19 year olds has the lowest likelihood of being enrolled in a private school, with 57 (100.0% in the age bracket) attending a public institution.
| Age Bracket | Public School | Private School |
| 3 to 4 Year Olds | 0 (0.0%) | 0 (0.0%) |
| 5 to 9 Year Old | 88 (63.3%) | 51 (36.7%) |
| 10 to 14 Year Olds | 267 (56.8%) | 203 (43.2%) |
| 15 to 17 Year Olds | 167 (65.7%) | 87 (34.3%) |
| 18 to 19 Year Olds | 57 (100.0%) | 0 (0.0%) |
| 20 to 24 Year Olds | 55 (63.2%) | 32 (36.8%) |
| 25 to 34 Year Olds | 111 (100.0%) | 0 (0.0%) |
| 35 Years and over | 60 (52.6%) | 54 (47.4%) |
| Total | 804 (65.3%) | 428 (34.7%) |
Educational Attainment by Field of Study in El Granada
Social sciences (435 | 16.7%), bio, nature & agricultural (318 | 12.2%), business (317 | 12.1%), engineering (309 | 11.8%), and visual & performing arts (225 | 8.6%) are the most common fields of study among 2,611 individuals in El Granada who have obtained a bachelor's degree or higher.
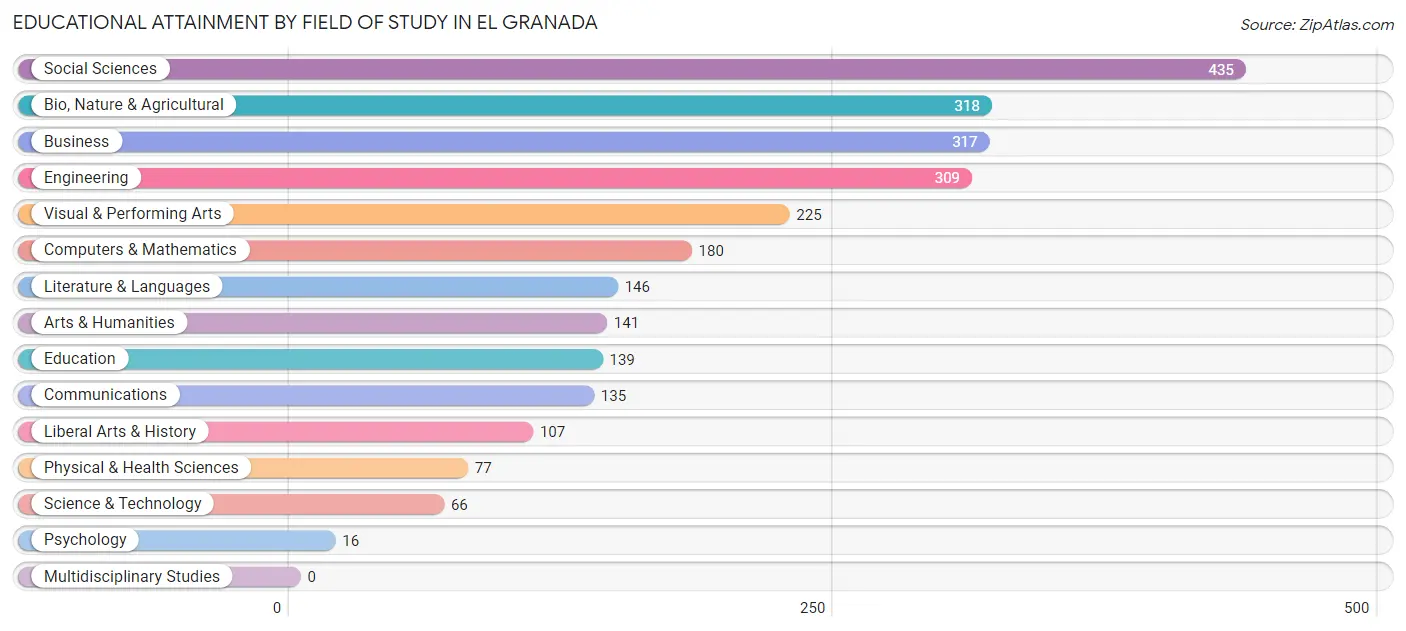
| Field of Study | # Graduates | % Graduates |
| Computers & Mathematics | 180 | 6.9% |
| Bio, Nature & Agricultural | 318 | 12.2% |
| Physical & Health Sciences | 77 | 2.9% |
| Psychology | 16 | 0.6% |
| Social Sciences | 435 | 16.7% |
| Engineering | 309 | 11.8% |
| Multidisciplinary Studies | 0 | 0.0% |
| Science & Technology | 66 | 2.5% |
| Business | 317 | 12.1% |
| Education | 139 | 5.3% |
| Literature & Languages | 146 | 5.6% |
| Liberal Arts & History | 107 | 4.1% |
| Visual & Performing Arts | 225 | 8.6% |
| Communications | 135 | 5.2% |
| Arts & Humanities | 141 | 5.4% |
| Total | 2,611 | 100.0% |
Transportation & Commute in El Granada
Vehicle Availability by Sex in El Granada
The most prevalent vehicle ownership categories in El Granada are males with 2 vehicles (657, accounting for 44.5%) and females with 2 vehicles (565, making up 47.9%).
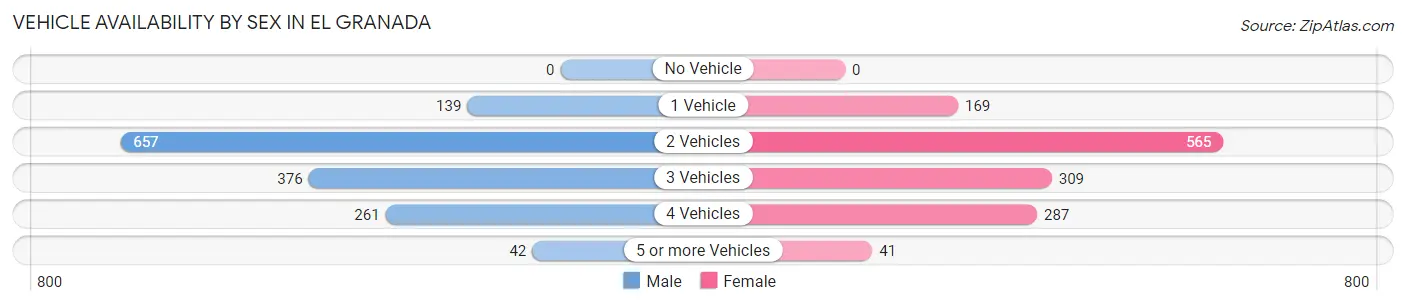
| Vehicles Available | Male | Female |
| No Vehicle | 0 (0.0%) | 0 (0.0%) |
| 1 Vehicle | 139 (9.4%) | 169 (12.3%) |
| 2 Vehicles | 657 (44.5%) | 565 (41.2%) |
| 3 Vehicles | 376 (25.5%) | 309 (22.5%) |
| 4 Vehicles | 261 (17.7%) | 287 (20.9%) |
| 5 or more Vehicles | 42 (2.9%) | 41 (3.0%) |
| Total | 1,475 (100.0%) | 1,371 (100.0%) |
Commute Time in El Granada
The most frequently occuring commute durations in El Granada are 45 to 59 minutes (520 commuters, 23.7%), 60 to 89 minutes (279 commuters, 12.7%), and 10 to 14 minutes (241 commuters, 11.0%).
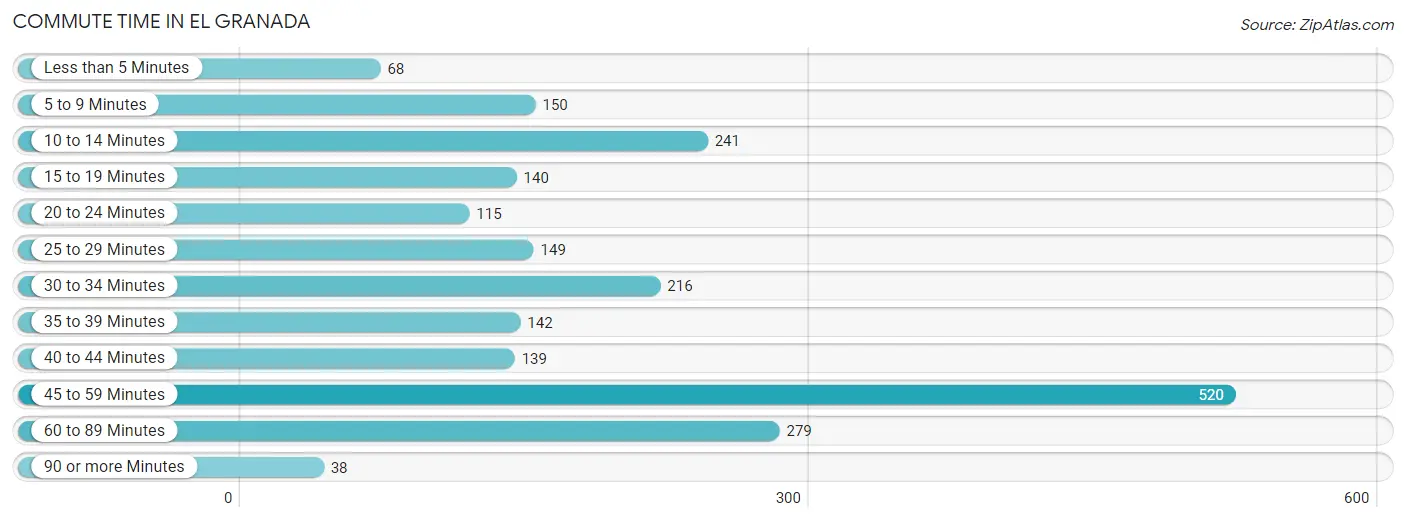
| Commute Time | # Commuters | % Commuters |
| Less than 5 Minutes | 68 | 3.1% |
| 5 to 9 Minutes | 150 | 6.8% |
| 10 to 14 Minutes | 241 | 11.0% |
| 15 to 19 Minutes | 140 | 6.4% |
| 20 to 24 Minutes | 115 | 5.2% |
| 25 to 29 Minutes | 149 | 6.8% |
| 30 to 34 Minutes | 216 | 9.8% |
| 35 to 39 Minutes | 142 | 6.5% |
| 40 to 44 Minutes | 139 | 6.3% |
| 45 to 59 Minutes | 520 | 23.7% |
| 60 to 89 Minutes | 279 | 12.7% |
| 90 or more Minutes | 38 | 1.7% |
Commute Time by Sex in El Granada
The most common commute times in El Granada are 45 to 59 minutes (244 commuters, 21.9%) for males and 45 to 59 minutes (276 commuters, 25.5%) for females.
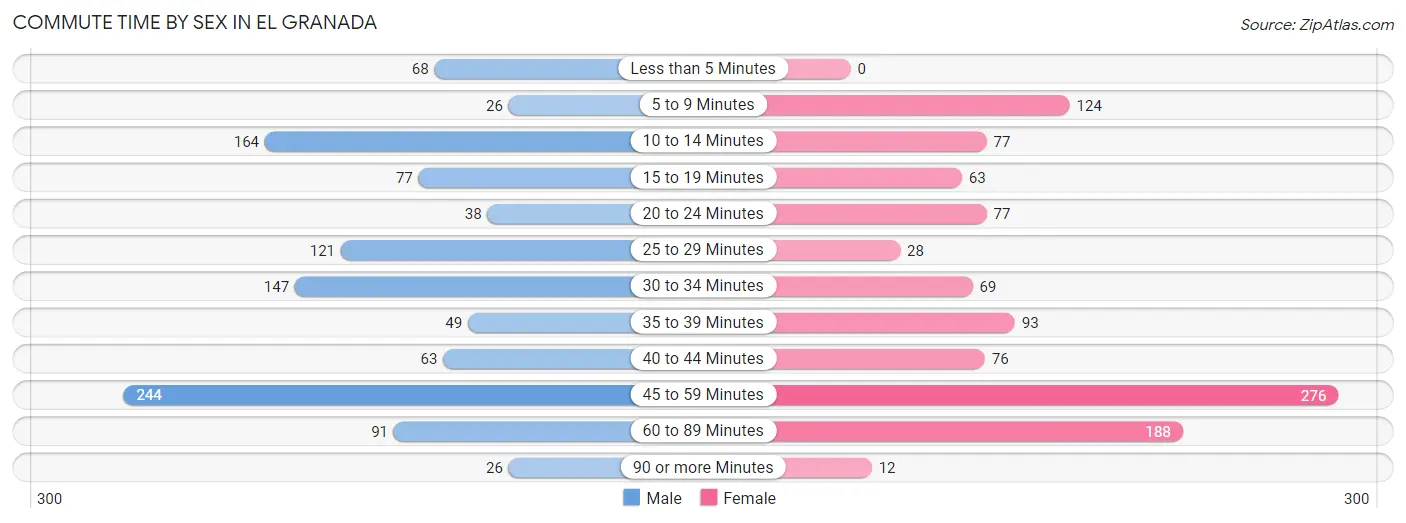
| Commute Time | Male | Female |
| Less than 5 Minutes | 68 (6.1%) | 0 (0.0%) |
| 5 to 9 Minutes | 26 (2.3%) | 124 (11.5%) |
| 10 to 14 Minutes | 164 (14.7%) | 77 (7.1%) |
| 15 to 19 Minutes | 77 (6.9%) | 63 (5.8%) |
| 20 to 24 Minutes | 38 (3.4%) | 77 (7.1%) |
| 25 to 29 Minutes | 121 (10.9%) | 28 (2.6%) |
| 30 to 34 Minutes | 147 (13.2%) | 69 (6.4%) |
| 35 to 39 Minutes | 49 (4.4%) | 93 (8.6%) |
| 40 to 44 Minutes | 63 (5.7%) | 76 (7.0%) |
| 45 to 59 Minutes | 244 (21.9%) | 276 (25.5%) |
| 60 to 89 Minutes | 91 (8.2%) | 188 (17.4%) |
| 90 or more Minutes | 26 (2.3%) | 12 (1.1%) |
Time of Departure to Work by Sex in El Granada
The most frequent times of departure to work in El Granada are 6:00 AM to 6:29 AM (210, 18.9%) for males and 8:30 AM to 8:59 AM (200, 18.5%) for females.
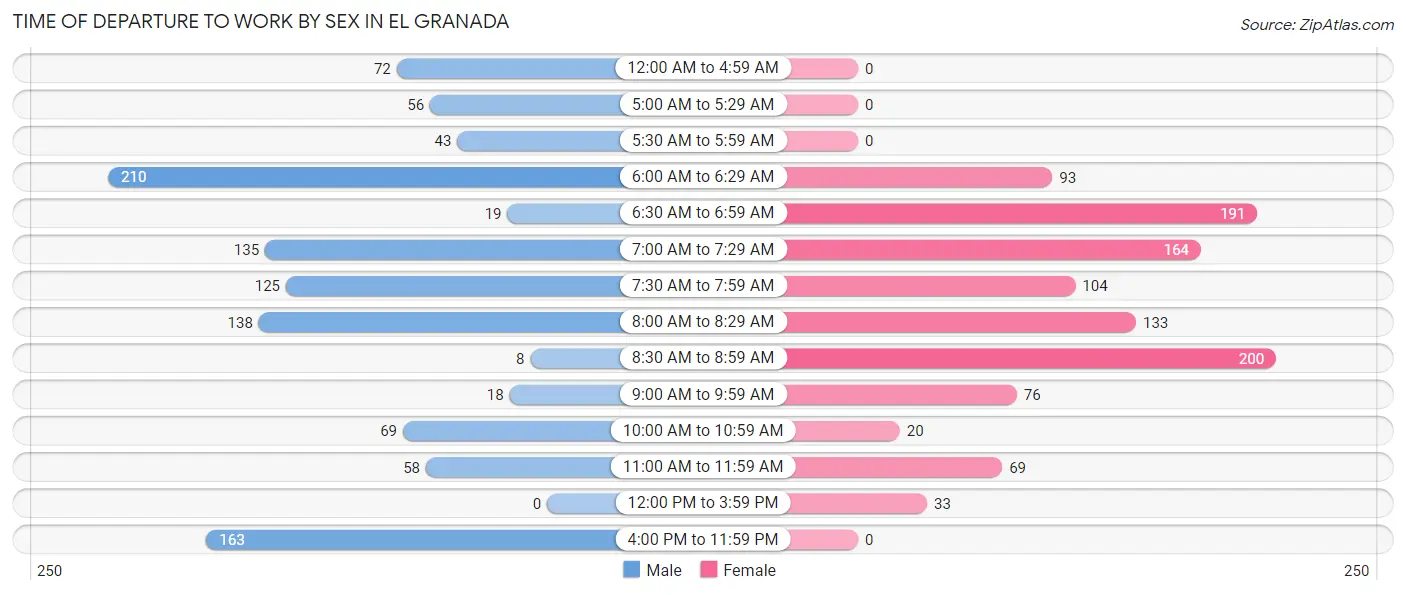
| Time of Departure | Male | Female |
| 12:00 AM to 4:59 AM | 72 (6.5%) | 0 (0.0%) |
| 5:00 AM to 5:29 AM | 56 (5.0%) | 0 (0.0%) |
| 5:30 AM to 5:59 AM | 43 (3.9%) | 0 (0.0%) |
| 6:00 AM to 6:29 AM | 210 (18.9%) | 93 (8.6%) |
| 6:30 AM to 6:59 AM | 19 (1.7%) | 191 (17.6%) |
| 7:00 AM to 7:29 AM | 135 (12.1%) | 164 (15.1%) |
| 7:30 AM to 7:59 AM | 125 (11.2%) | 104 (9.6%) |
| 8:00 AM to 8:29 AM | 138 (12.4%) | 133 (12.3%) |
| 8:30 AM to 8:59 AM | 8 (0.7%) | 200 (18.5%) |
| 9:00 AM to 9:59 AM | 18 (1.6%) | 76 (7.0%) |
| 10:00 AM to 10:59 AM | 69 (6.2%) | 20 (1.8%) |
| 11:00 AM to 11:59 AM | 58 (5.2%) | 69 (6.4%) |
| 12:00 PM to 3:59 PM | 0 (0.0%) | 33 (3.0%) |
| 4:00 PM to 11:59 PM | 163 (14.6%) | 0 (0.0%) |
| Total | 1,114 (100.0%) | 1,083 (100.0%) |
Housing Occupancy in El Granada
Occupancy by Ownership in El Granada
Of the total 2,125 dwellings in El Granada, owner-occupied units account for 1,806 (85.0%), while renter-occupied units make up 319 (15.0%).
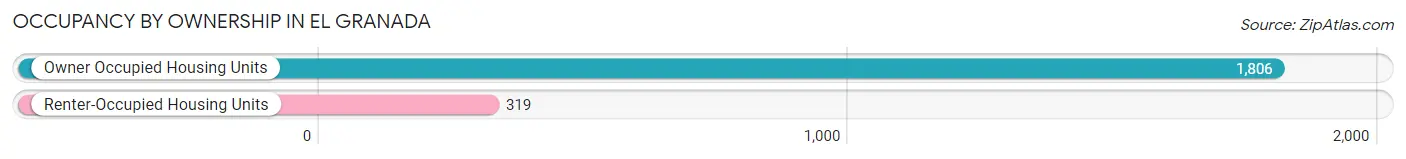
| Occupancy | # Housing Units | % Housing Units |
| Owner Occupied Housing Units | 1,806 | 85.0% |
| Renter-Occupied Housing Units | 319 | 15.0% |
| Total Occupied Housing Units | 2,125 | 100.0% |
Occupancy by Household Size in El Granada
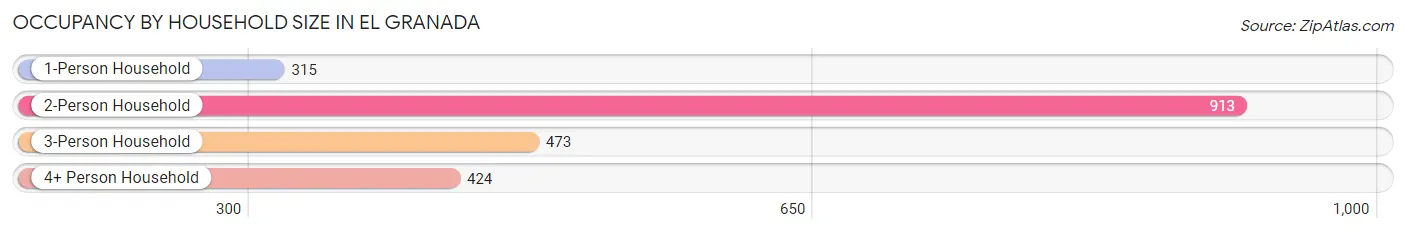
| Household Size | # Housing Units | % Housing Units |
| 1-Person Household | 315 | 14.8% |
| 2-Person Household | 913 | 43.0% |
| 3-Person Household | 473 | 22.3% |
| 4+ Person Household | 424 | 20.0% |
| Total Housing Units | 2,125 | 100.0% |
Occupancy by Ownership by Household Size in El Granada
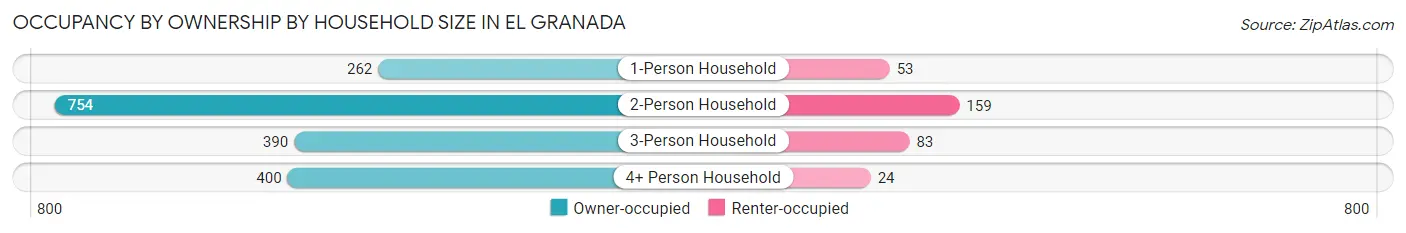
| Household Size | Owner-occupied | Renter-occupied |
| 1-Person Household | 262 (83.2%) | 53 (16.8%) |
| 2-Person Household | 754 (82.6%) | 159 (17.4%) |
| 3-Person Household | 390 (82.5%) | 83 (17.5%) |
| 4+ Person Household | 400 (94.3%) | 24 (5.7%) |
| Total Housing Units | 1,806 (85.0%) | 319 (15.0%) |
Occupancy by Educational Attainment in El Granada
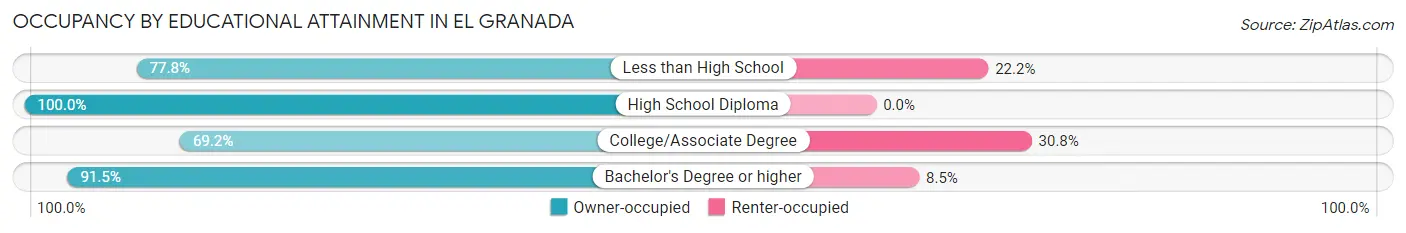
| Household Size | Owner-occupied | Renter-occupied |
| Less than High School | 133 (77.8%) | 38 (22.2%) |
| High School Diploma | 149 (100.0%) | 0 (0.0%) |
| College/Associate Degree | 395 (69.2%) | 176 (30.8%) |
| Bachelor's Degree or higher | 1,129 (91.5%) | 105 (8.5%) |
Occupancy by Age of Householder in El Granada
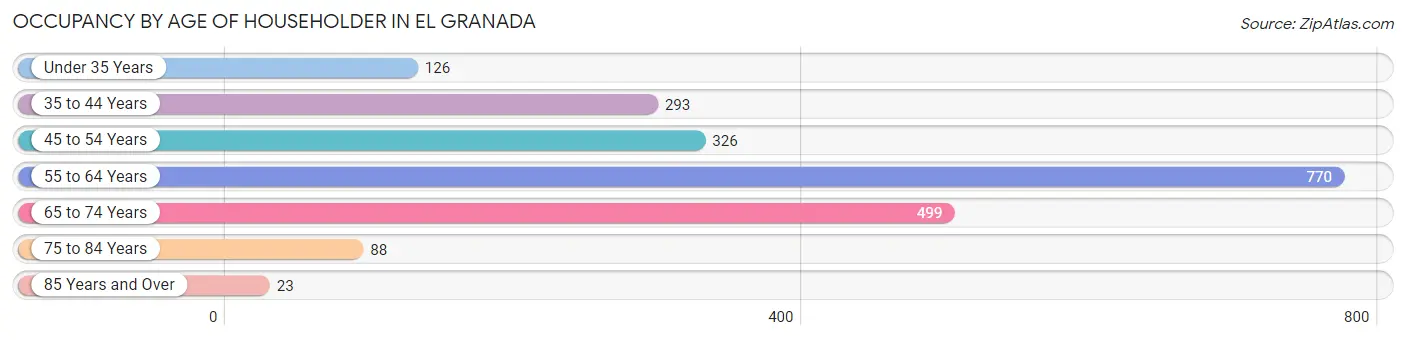
| Age Bracket | # Households | % Households |
| Under 35 Years | 126 | 5.9% |
| 35 to 44 Years | 293 | 13.8% |
| 45 to 54 Years | 326 | 15.3% |
| 55 to 64 Years | 770 | 36.2% |
| 65 to 74 Years | 499 | 23.5% |
| 75 to 84 Years | 88 | 4.1% |
| 85 Years and Over | 23 | 1.1% |
| Total | 2,125 | 100.0% |
Housing Finances in El Granada
Median Income by Occupancy in El Granada
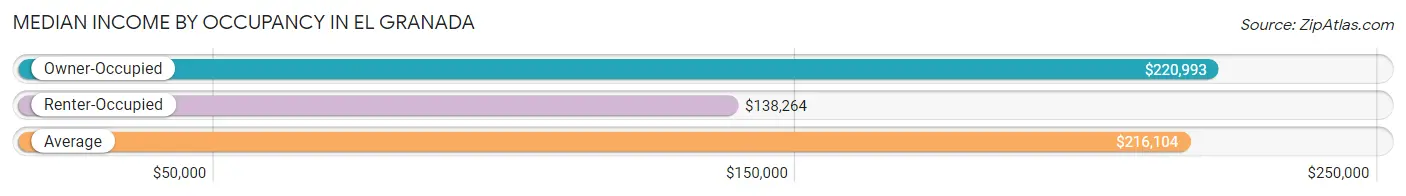
| Occupancy Type | # Households | Median Income |
| Owner-Occupied | 1,806 (85.0%) | $220,993 |
| Renter-Occupied | 319 (15.0%) | $138,264 |
| Average | 2,125 (100.0%) | $216,104 |
Occupancy by Householder Income Bracket in El Granada
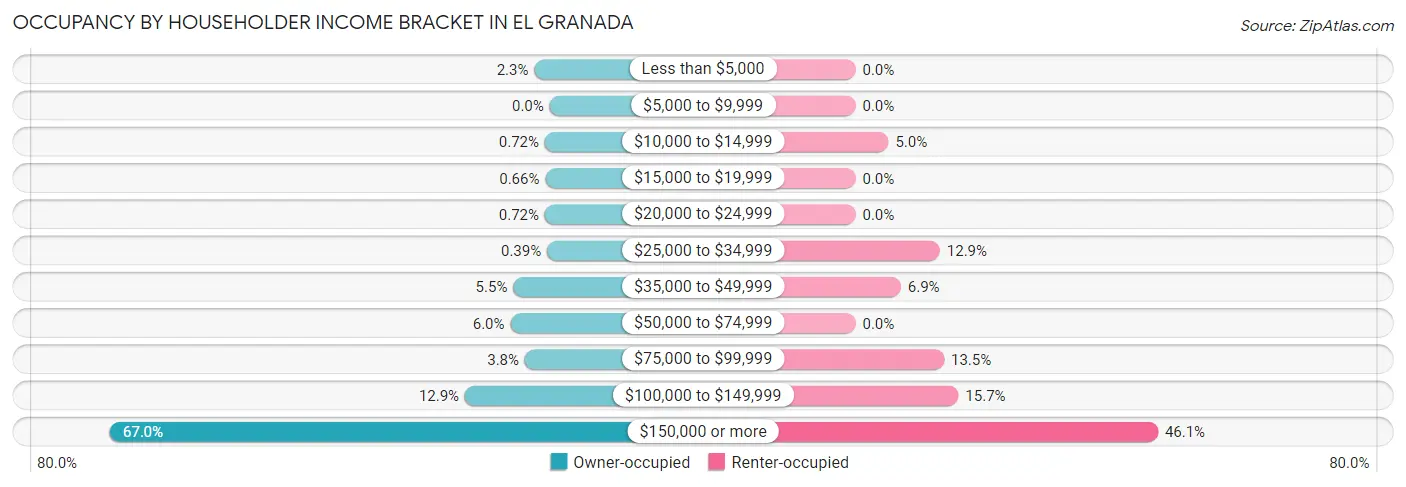
| Income Bracket | Owner-occupied | Renter-occupied |
| Less than $5,000 | 42 (2.3%) | 0 (0.0%) |
| $5,000 to $9,999 | 0 (0.0%) | 0 (0.0%) |
| $10,000 to $14,999 | 13 (0.7%) | 16 (5.0%) |
| $15,000 to $19,999 | 12 (0.7%) | 0 (0.0%) |
| $20,000 to $24,999 | 13 (0.7%) | 0 (0.0%) |
| $25,000 to $34,999 | 7 (0.4%) | 41 (12.9%) |
| $35,000 to $49,999 | 100 (5.5%) | 22 (6.9%) |
| $50,000 to $74,999 | 108 (6.0%) | 0 (0.0%) |
| $75,000 to $99,999 | 68 (3.8%) | 43 (13.5%) |
| $100,000 to $149,999 | 233 (12.9%) | 50 (15.7%) |
| $150,000 or more | 1,210 (67.0%) | 147 (46.1%) |
| Total | 1,806 (100.0%) | 319 (100.0%) |
Monthly Housing Cost Tiers in El Granada
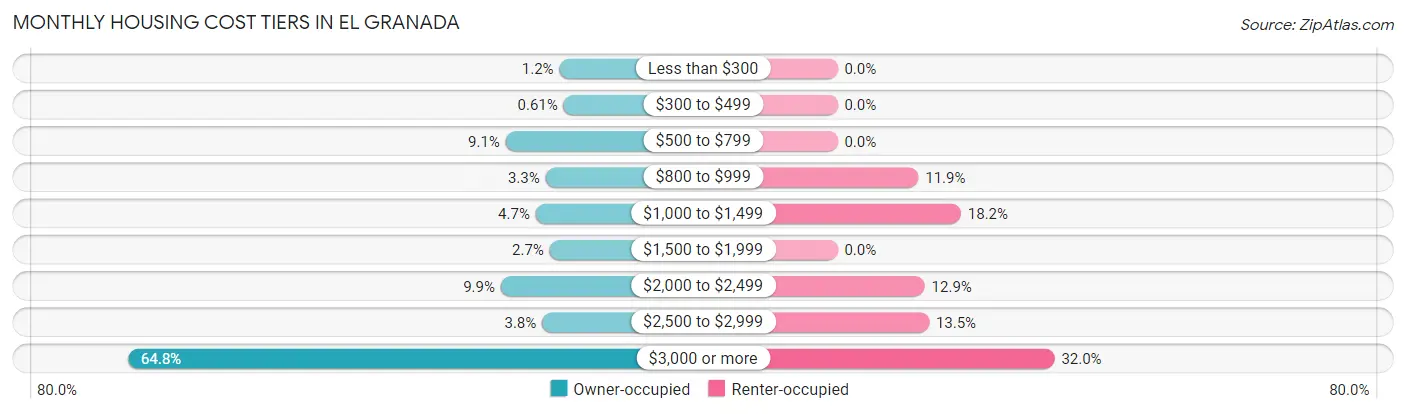
| Monthly Cost | Owner-occupied | Renter-occupied |
| Less than $300 | 22 (1.2%) | 0 (0.0%) |
| $300 to $499 | 11 (0.6%) | 0 (0.0%) |
| $500 to $799 | 165 (9.1%) | 0 (0.0%) |
| $800 to $999 | 59 (3.3%) | 38 (11.9%) |
| $1,000 to $1,499 | 85 (4.7%) | 58 (18.2%) |
| $1,500 to $1,999 | 48 (2.7%) | 0 (0.0%) |
| $2,000 to $2,499 | 178 (9.9%) | 41 (12.9%) |
| $2,500 to $2,999 | 68 (3.8%) | 43 (13.5%) |
| $3,000 or more | 1,170 (64.8%) | 102 (32.0%) |
| Total | 1,806 (100.0%) | 319 (100.0%) |
Physical Housing Characteristics in El Granada
Housing Structures in El Granada
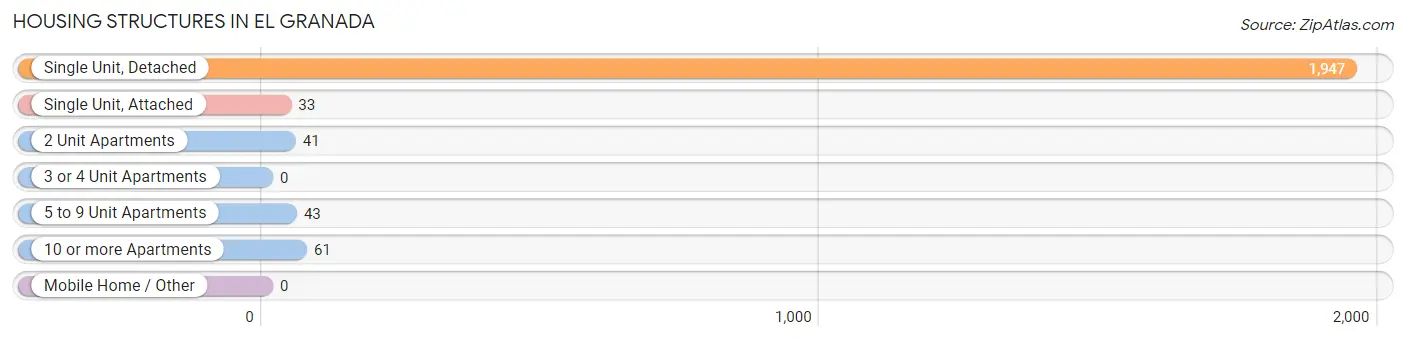
| Structure Type | # Housing Units | % Housing Units |
| Single Unit, Detached | 1,947 | 91.6% |
| Single Unit, Attached | 33 | 1.5% |
| 2 Unit Apartments | 41 | 1.9% |
| 3 or 4 Unit Apartments | 0 | 0.0% |
| 5 to 9 Unit Apartments | 43 | 2.0% |
| 10 or more Apartments | 61 | 2.9% |
| Mobile Home / Other | 0 | 0.0% |
| Total | 2,125 | 100.0% |
Housing Structures by Occupancy in El Granada
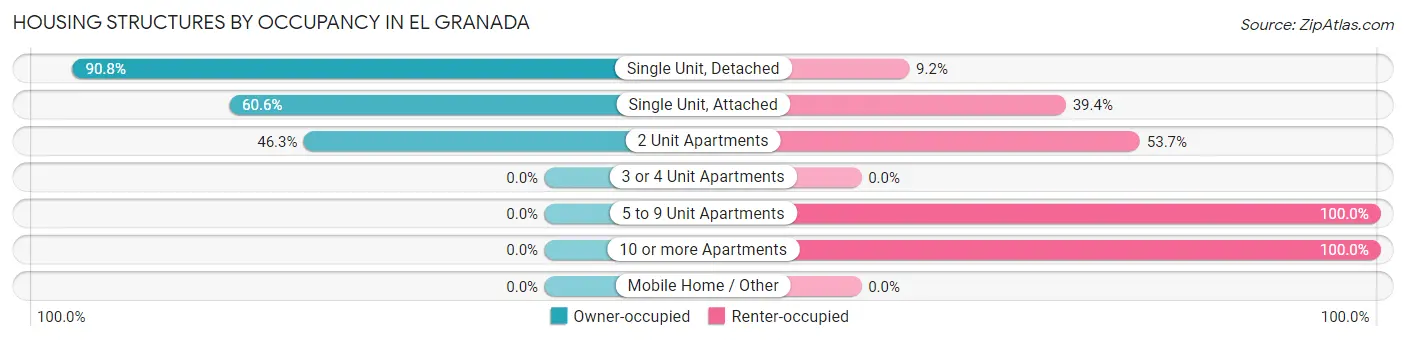
| Structure Type | Owner-occupied | Renter-occupied |
| Single Unit, Detached | 1,767 (90.8%) | 180 (9.2%) |
| Single Unit, Attached | 20 (60.6%) | 13 (39.4%) |
| 2 Unit Apartments | 19 (46.3%) | 22 (53.7%) |
| 3 or 4 Unit Apartments | 0 (0.0%) | 0 (0.0%) |
| 5 to 9 Unit Apartments | 0 (0.0%) | 43 (100.0%) |
| 10 or more Apartments | 0 (0.0%) | 61 (100.0%) |
| Mobile Home / Other | 0 (0.0%) | 0 (0.0%) |
| Total | 1,806 (85.0%) | 319 (15.0%) |
Housing Structures by Number of Rooms in El Granada
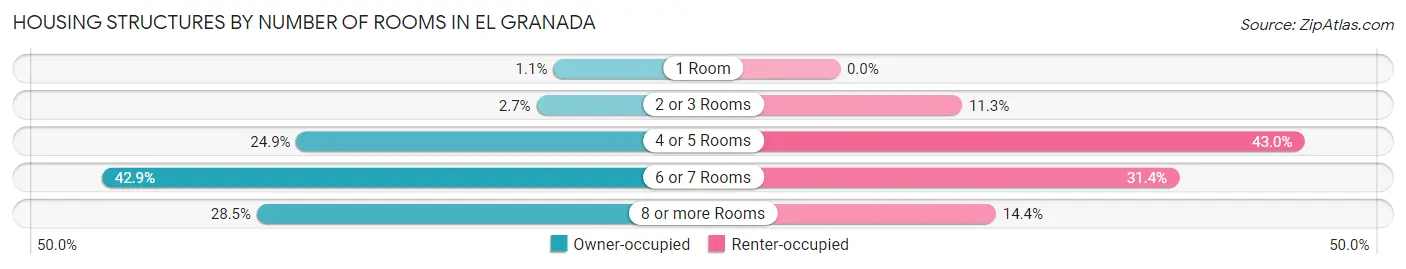
| Number of Rooms | Owner-occupied | Renter-occupied |
| 1 Room | 20 (1.1%) | 0 (0.0%) |
| 2 or 3 Rooms | 48 (2.7%) | 36 (11.3%) |
| 4 or 5 Rooms | 449 (24.9%) | 137 (42.9%) |
| 6 or 7 Rooms | 774 (42.9%) | 100 (31.4%) |
| 8 or more Rooms | 515 (28.5%) | 46 (14.4%) |
| Total | 1,806 (100.0%) | 319 (100.0%) |
Housing Structure by Heating Type in El Granada
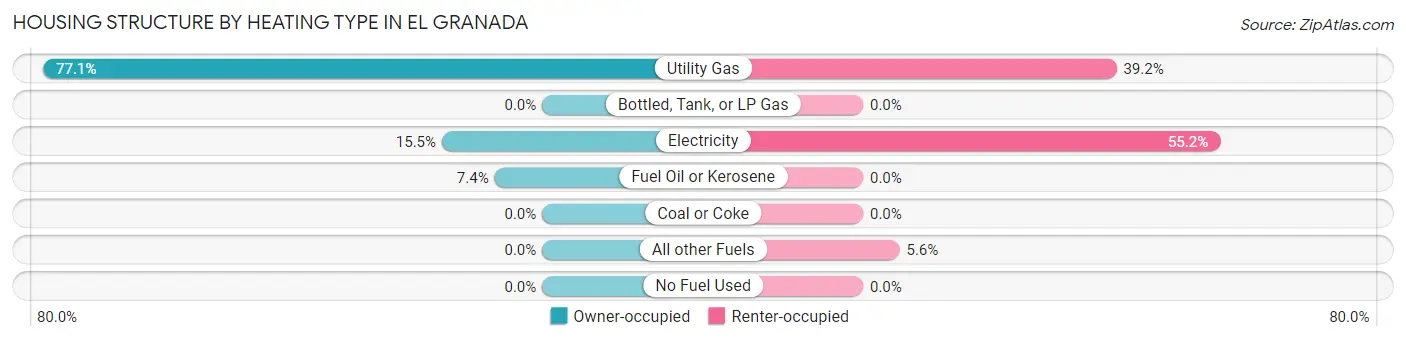
| Heating Type | Owner-occupied | Renter-occupied |
| Utility Gas | 1,393 (77.1%) | 125 (39.2%) |
| Bottled, Tank, or LP Gas | 0 (0.0%) | 0 (0.0%) |
| Electricity | 280 (15.5%) | 176 (55.2%) |
| Fuel Oil or Kerosene | 133 (7.4%) | 0 (0.0%) |
| Coal or Coke | 0 (0.0%) | 0 (0.0%) |
| All other Fuels | 0 (0.0%) | 18 (5.6%) |
| No Fuel Used | 0 (0.0%) | 0 (0.0%) |
| Total | 1,806 (100.0%) | 319 (100.0%) |
Household Vehicle Usage in El Granada
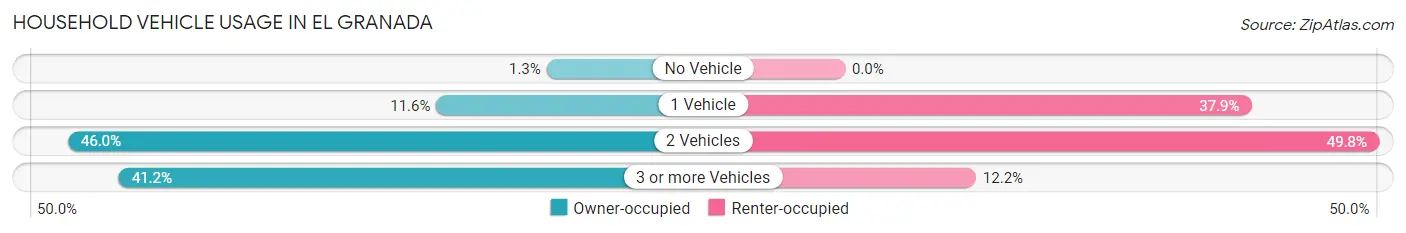
| Vehicles per Household | Owner-occupied | Renter-occupied |
| No Vehicle | 23 (1.3%) | 0 (0.0%) |
| 1 Vehicle | 209 (11.6%) | 121 (37.9%) |
| 2 Vehicles | 830 (46.0%) | 159 (49.8%) |
| 3 or more Vehicles | 744 (41.2%) | 39 (12.2%) |
| Total | 1,806 (100.0%) | 319 (100.0%) |
Real Estate & Mortgages in El Granada
Real Estate and Mortgage Overview in El Granada
| Characteristic | Without Mortgage | With Mortgage |
| Housing Units | 483 | 1,323 |
| Median Property Value | $1,319,100 | $1,432,700 |
| Median Household Income | $137,688 | $987 |
| Monthly Housing Costs | $974 | $1,150 |
| Real Estate Taxes | $7,139 | $0 |
Property Value by Mortgage Status in El Granada
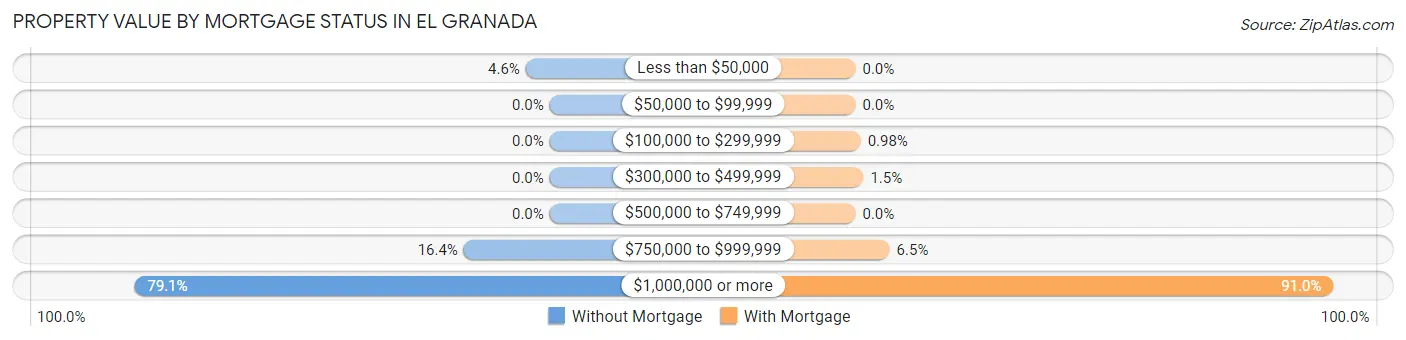
| Property Value | Without Mortgage | With Mortgage |
| Less than $50,000 | 22 (4.5%) | 0 (0.0%) |
| $50,000 to $99,999 | 0 (0.0%) | 0 (0.0%) |
| $100,000 to $299,999 | 0 (0.0%) | 13 (1.0%) |
| $300,000 to $499,999 | 0 (0.0%) | 20 (1.5%) |
| $500,000 to $749,999 | 0 (0.0%) | 0 (0.0%) |
| $750,000 to $999,999 | 79 (16.4%) | 86 (6.5%) |
| $1,000,000 or more | 382 (79.1%) | 1,204 (91.0%) |
| Total | 483 (100.0%) | 1,323 (100.0%) |
Household Income by Mortgage Status in El Granada
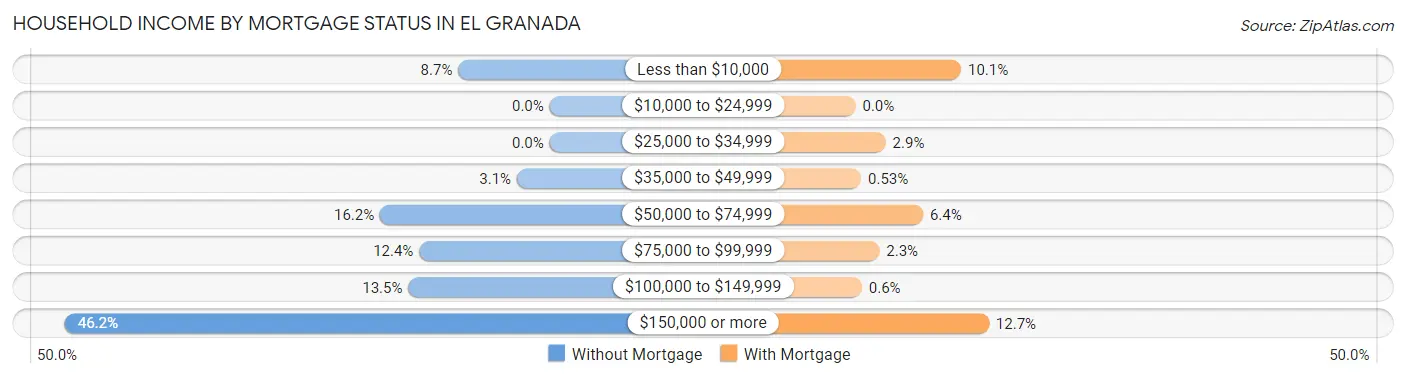
| Household Income | Without Mortgage | With Mortgage |
| Less than $10,000 | 42 (8.7%) | 133 (10.1%) |
| $10,000 to $24,999 | 0 (0.0%) | 0 (0.0%) |
| $25,000 to $34,999 | 0 (0.0%) | 38 (2.9%) |
| $35,000 to $49,999 | 15 (3.1%) | 7 (0.5%) |
| $50,000 to $74,999 | 78 (16.2%) | 85 (6.4%) |
| $75,000 to $99,999 | 60 (12.4%) | 30 (2.3%) |
| $100,000 to $149,999 | 65 (13.5%) | 8 (0.6%) |
| $150,000 or more | 223 (46.2%) | 168 (12.7%) |
| Total | 483 (100.0%) | 1,323 (100.0%) |
Property Value to Household Income Ratio in El Granada
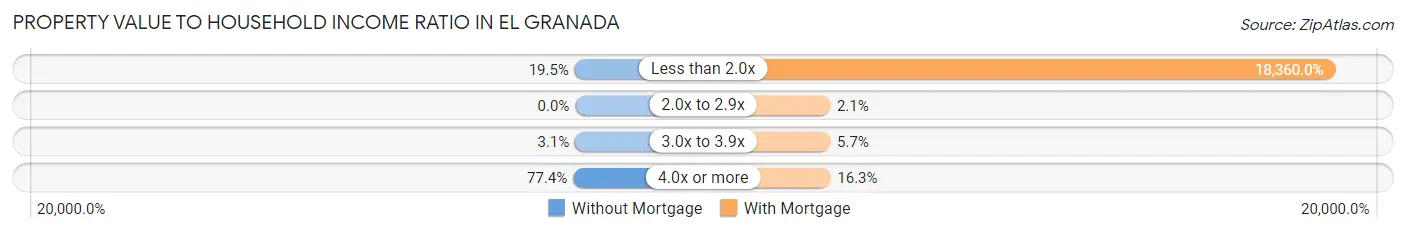
| Value-to-Income Ratio | Without Mortgage | With Mortgage |
| Less than 2.0x | 94 (19.5%) | 242,903 (18,360.0%) |
| 2.0x to 2.9x | 0 (0.0%) | 28 (2.1%) |
| 3.0x to 3.9x | 15 (3.1%) | 76 (5.7%) |
| 4.0x or more | 374 (77.4%) | 216 (16.3%) |
| Total | 483 (100.0%) | 1,323 (100.0%) |
Real Estate Taxes by Mortgage Status in El Granada
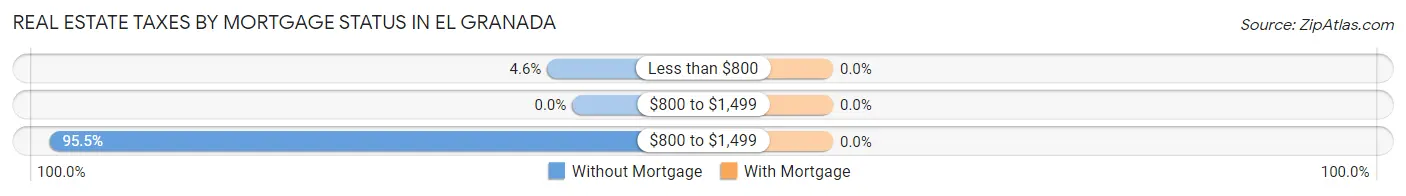
| Property Taxes | Without Mortgage | With Mortgage |
| Less than $800 | 22 (4.5%) | 0 (0.0%) |
| $800 to $1,499 | 0 (0.0%) | 0 (0.0%) |
| $800 to $1,499 | 461 (95.5%) | 0 (0.0%) |
| Total | 483 (100.0%) | 1,323 (100.0%) |
Health & Disability in El Granada
Health Insurance Coverage by Age in El Granada
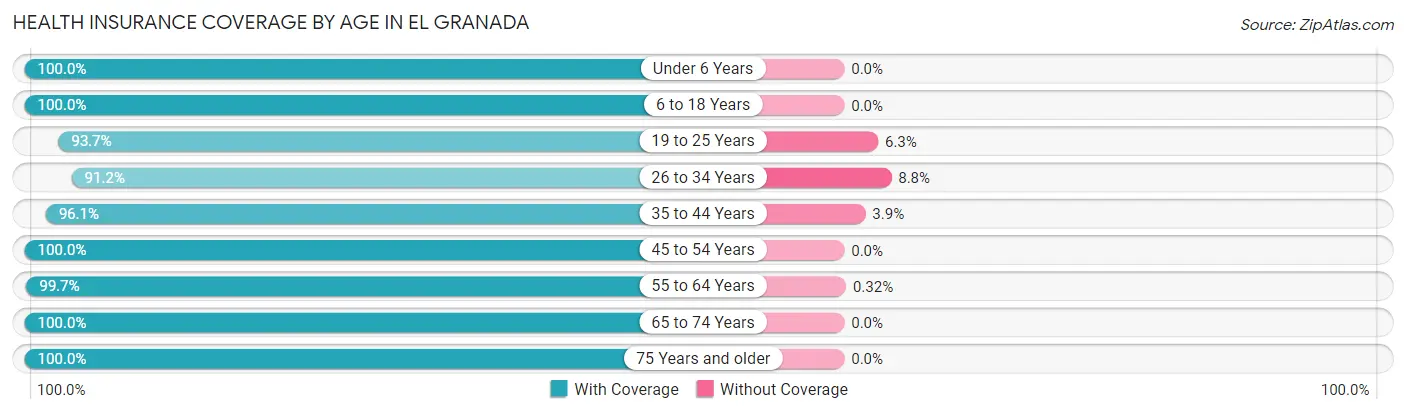
| Age Bracket | With Coverage | Without Coverage |
| Under 6 Years | 147 (100.0%) | 0 (0.0%) |
| 6 to 18 Years | 925 (100.0%) | 0 (0.0%) |
| 19 to 25 Years | 328 (93.7%) | 22 (6.3%) |
| 26 to 34 Years | 479 (91.2%) | 46 (8.8%) |
| 35 to 44 Years | 732 (96.1%) | 30 (3.9%) |
| 45 to 54 Years | 638 (100.0%) | 0 (0.0%) |
| 55 to 64 Years | 1,262 (99.7%) | 4 (0.3%) |
| 65 to 74 Years | 763 (100.0%) | 0 (0.0%) |
| 75 Years and older | 275 (100.0%) | 0 (0.0%) |
| Total | 5,549 (98.2%) | 102 (1.8%) |
Health Insurance Coverage by Citizenship Status in El Granada

| Citizenship Status | With Coverage | Without Coverage |
| Native Born | 147 (100.0%) | 0 (0.0%) |
| Foreign Born, Citizen | 925 (100.0%) | 0 (0.0%) |
| Foreign Born, not a Citizen | 328 (93.7%) | 22 (6.3%) |
Health Insurance Coverage by Household Income in El Granada
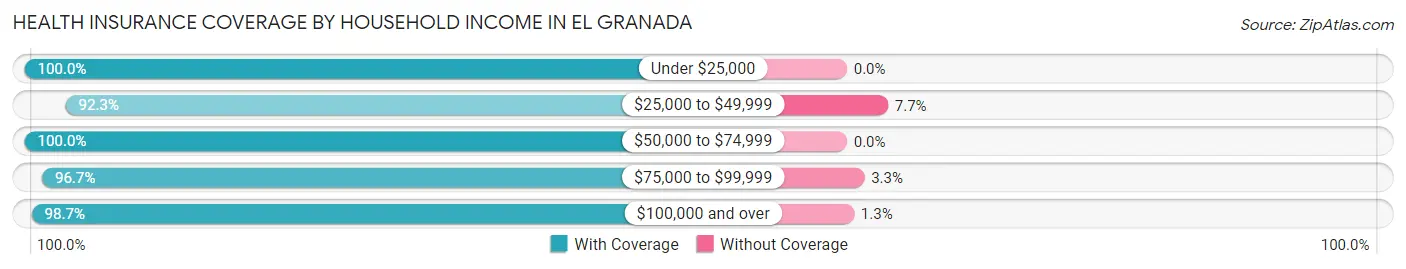
| Household Income | With Coverage | Without Coverage |
| Under $25,000 | 131 (100.0%) | 0 (0.0%) |
| $25,000 to $49,999 | 264 (92.3%) | 22 (7.7%) |
| $50,000 to $74,999 | 243 (100.0%) | 0 (0.0%) |
| $75,000 to $99,999 | 296 (96.7%) | 10 (3.3%) |
| $100,000 and over | 4,598 (98.7%) | 62 (1.3%) |
Public vs Private Health Insurance Coverage by Age in El Granada
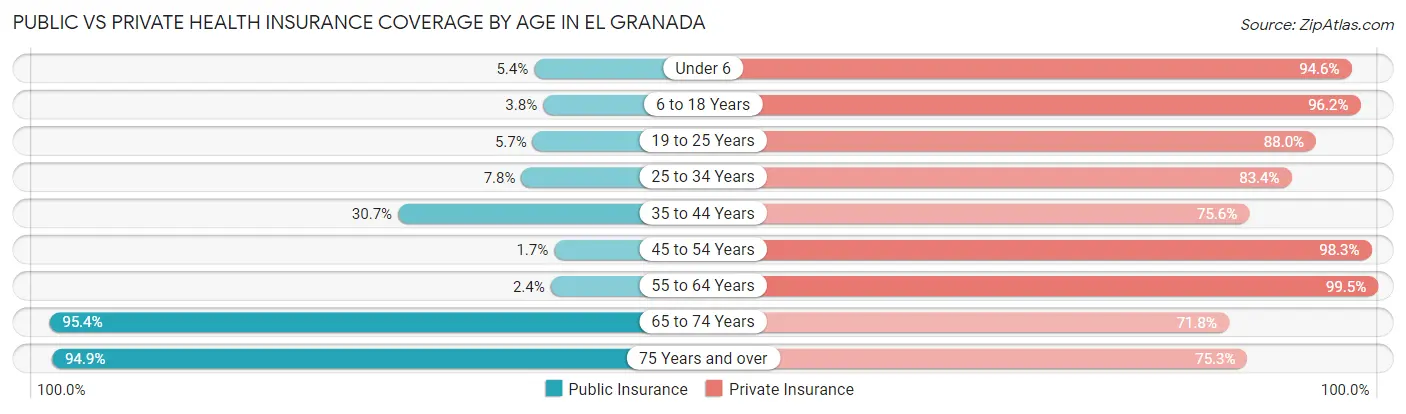
| Age Bracket | Public Insurance | Private Insurance |
| Under 6 | 8 (5.4%) | 139 (94.6%) |
| 6 to 18 Years | 35 (3.8%) | 890 (96.2%) |
| 19 to 25 Years | 20 (5.7%) | 308 (88.0%) |
| 25 to 34 Years | 41 (7.8%) | 438 (83.4%) |
| 35 to 44 Years | 234 (30.7%) | 576 (75.6%) |
| 45 to 54 Years | 11 (1.7%) | 627 (98.3%) |
| 55 to 64 Years | 30 (2.4%) | 1,260 (99.5%) |
| 65 to 74 Years | 728 (95.4%) | 548 (71.8%) |
| 75 Years and over | 261 (94.9%) | 207 (75.3%) |
| Total | 1,368 (24.2%) | 4,993 (88.4%) |
Disability Status by Sex by Age in El Granada
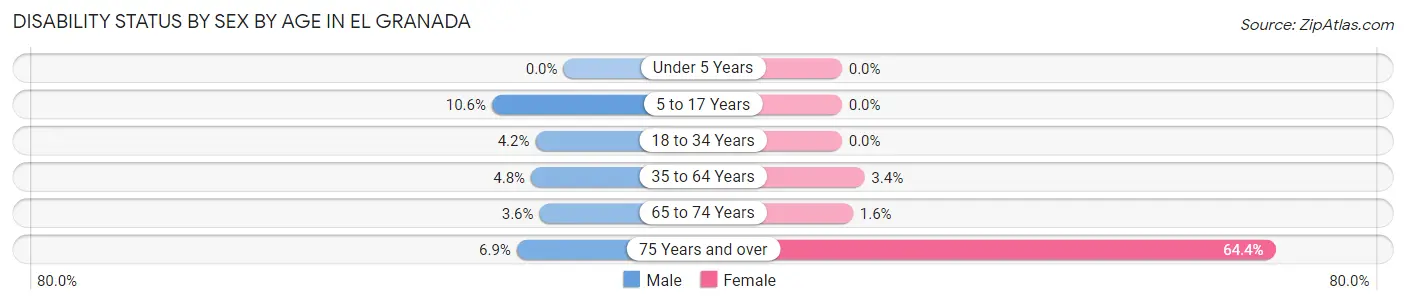
| Age Bracket | Male | Female |
| Under 5 Years | 0 (0.0%) | 0 (0.0%) |
| 5 to 17 Years | 52 (10.6%) | 0 (0.0%) |
| 18 to 34 Years | 21 (4.2%) | 0 (0.0%) |
| 35 to 64 Years | 68 (4.8%) | 42 (3.4%) |
| 65 to 74 Years | 12 (3.6%) | 7 (1.6%) |
| 75 Years and over | 14 (6.9%) | 47 (64.4%) |
Disability Class by Sex by Age in El Granada
Disability Class: Hearing Difficulty
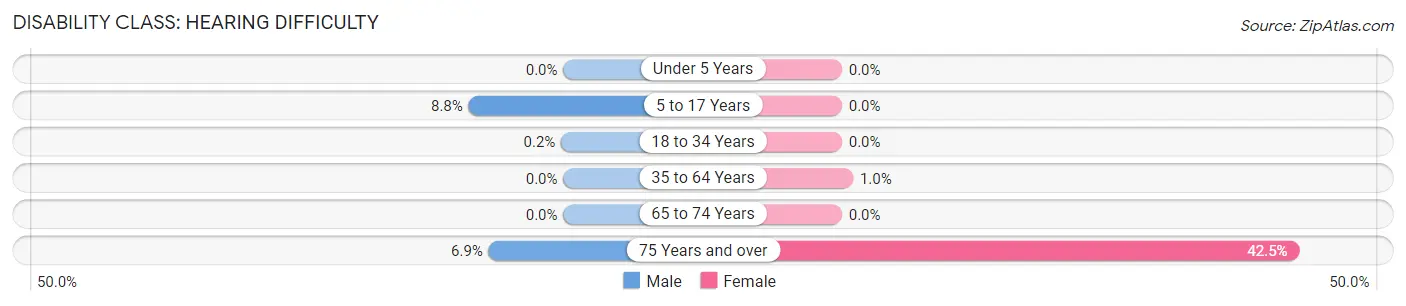
| Age Bracket | Male | Female |
| Under 5 Years | 0 (0.0%) | 0 (0.0%) |
| 5 to 17 Years | 43 (8.8%) | 0 (0.0%) |
| 18 to 34 Years | 1 (0.2%) | 0 (0.0%) |
| 35 to 64 Years | 0 (0.0%) | 13 (1.0%) |
| 65 to 74 Years | 0 (0.0%) | 0 (0.0%) |
| 75 Years and over | 14 (6.9%) | 31 (42.5%) |
Disability Class: Vision Difficulty
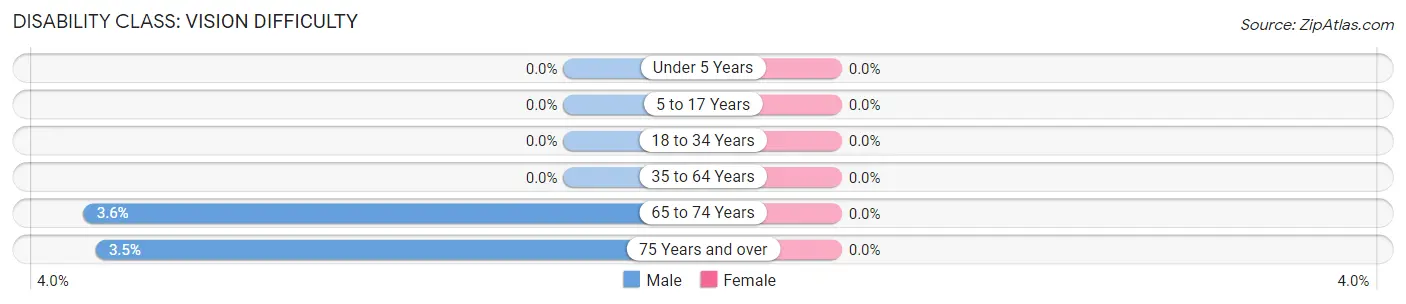
| Age Bracket | Male | Female |
| Under 5 Years | 0 (0.0%) | 0 (0.0%) |
| 5 to 17 Years | 0 (0.0%) | 0 (0.0%) |
| 18 to 34 Years | 0 (0.0%) | 0 (0.0%) |
| 35 to 64 Years | 0 (0.0%) | 0 (0.0%) |
| 65 to 74 Years | 12 (3.6%) | 0 (0.0%) |
| 75 Years and over | 7 (3.5%) | 0 (0.0%) |
Disability Class: Cognitive Difficulty
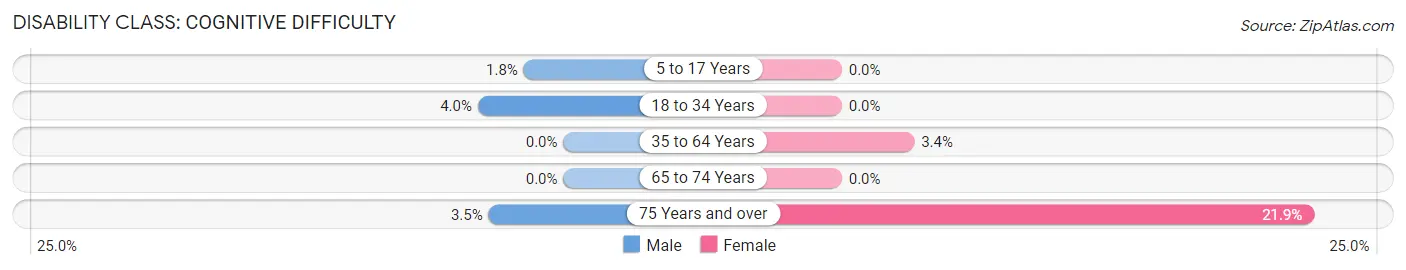
| Age Bracket | Male | Female |
| 5 to 17 Years | 9 (1.8%) | 0 (0.0%) |
| 18 to 34 Years | 20 (4.0%) | 0 (0.0%) |
| 35 to 64 Years | 0 (0.0%) | 42 (3.4%) |
| 65 to 74 Years | 0 (0.0%) | 0 (0.0%) |
| 75 Years and over | 7 (3.5%) | 16 (21.9%) |
Disability Class: Ambulatory Difficulty
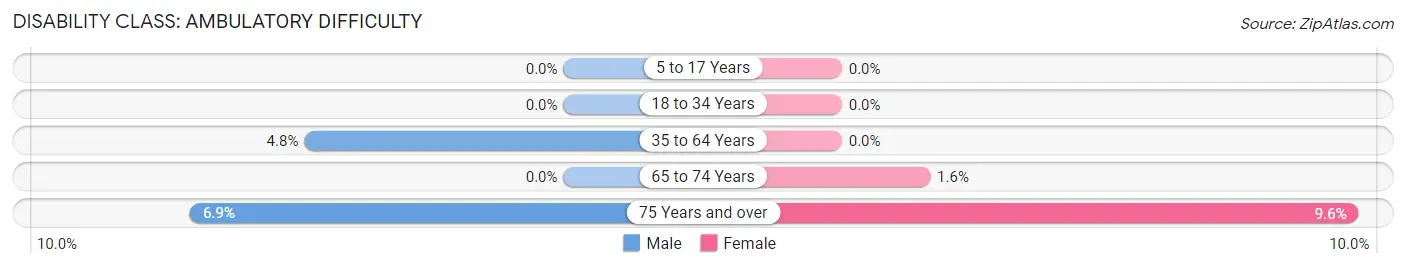
| Age Bracket | Male | Female |
| 5 to 17 Years | 0 (0.0%) | 0 (0.0%) |
| 18 to 34 Years | 0 (0.0%) | 0 (0.0%) |
| 35 to 64 Years | 68 (4.8%) | 0 (0.0%) |
| 65 to 74 Years | 0 (0.0%) | 7 (1.6%) |
| 75 Years and over | 14 (6.9%) | 7 (9.6%) |
Disability Class: Self-Care Difficulty
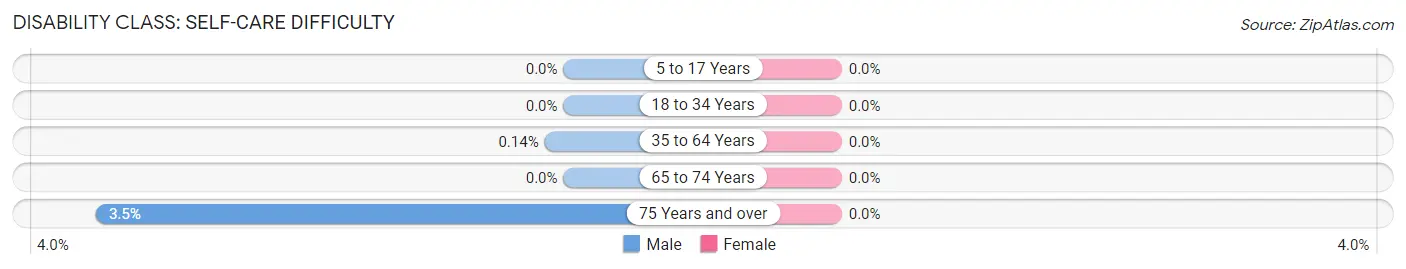
| Age Bracket | Male | Female |
| 5 to 17 Years | 0 (0.0%) | 0 (0.0%) |
| 18 to 34 Years | 0 (0.0%) | 0 (0.0%) |
| 35 to 64 Years | 2 (0.1%) | 0 (0.0%) |
| 65 to 74 Years | 0 (0.0%) | 0 (0.0%) |
| 75 Years and over | 7 (3.5%) | 0 (0.0%) |
Technology Access in El Granada
Computing Device Access in El Granada
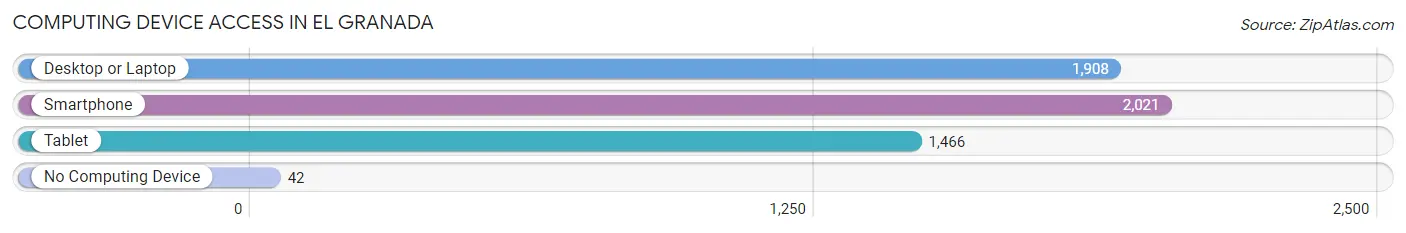
| Device Type | # Households | % Households |
| Desktop or Laptop | 1,908 | 89.8% |
| Smartphone | 2,021 | 95.1% |
| Tablet | 1,466 | 69.0% |
| No Computing Device | 42 | 2.0% |
| Total | 2,125 | 100.0% |
Internet Access in El Granada
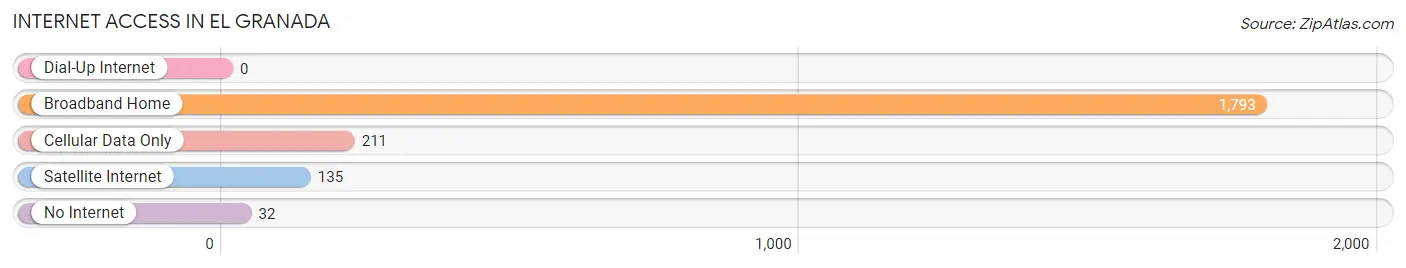
| Internet Type | # Households | % Households |
| Dial-Up Internet | 0 | 0.0% |
| Broadband Home | 1,793 | 84.4% |
| Cellular Data Only | 211 | 9.9% |
| Satellite Internet | 135 | 6.4% |
| No Internet | 32 | 1.5% |
| Total | 2,125 | 100.0% |
El Granada Summary
Granada, California is a small town located in the foothills of the Sierra Nevada Mountains in the Central Valley of California. It is situated in the northern part of Stanislaus County, approximately 40 miles east of Modesto and 70 miles south of Sacramento. The town is home to a population of approximately 2,000 people and is known for its rural charm and small-town atmosphere.
History
Granada was founded in 1891 by a group of settlers from the Midwest. The town was named after the Spanish city of Granada, which was the birthplace of one of the settlers. The settlers were attracted to the area due to its fertile soil and abundant water supply. The town quickly grew and by the early 1900s, it had become a thriving agricultural community.
Granada was incorporated in 1911 and the town’s first mayor was elected in 1912. The town continued to grow and by the mid-1900s, it had become a popular tourist destination due to its proximity to Yosemite National Park and other nearby attractions.
Geography
Granada is located in the foothills of the Sierra Nevada Mountains in the Central Valley of California. The town is situated in the northern part of Stanislaus County, approximately 40 miles east of Modesto and 70 miles south of Sacramento. The town is surrounded by rolling hills and is situated at an elevation of approximately 1,000 feet.
The climate in Granada is mild and temperate, with hot summers and cool winters. The average annual temperature is around 60 degrees Fahrenheit. The town receives an average of 18 inches of rain per year and is known for its sunny days and mild temperatures.
Economy
Granada’s economy is largely based on agriculture. The town is home to a number of farms and ranches that produce a variety of crops, including almonds, walnuts, peaches, and tomatoes. The town is also home to a number of wineries and vineyards, which produce a variety of wines.
In addition to agriculture, Granada is home to a number of small businesses, including restaurants, shops, and other services. The town is also home to a number of manufacturing companies, which produce a variety of products, including furniture, clothing, and electronics.
Demographics
As of the 2010 census, Granada had a population of 2,000 people. The town is predominantly white, with approximately 75% of the population identifying as Caucasian. The remaining 25% of the population is made up of African Americans, Hispanics, and other ethnicities.
The median household income in Granada is approximately $50,000 per year. The town has a low unemployment rate and a high rate of homeownership. The town is also home to a number of retirees, as well as a large number of young families.
Granada is a small town with a rich history and a vibrant economy. The town is known for its rural charm and small-town atmosphere, and is a popular destination for tourists and locals alike. The town is home to a diverse population and offers a variety of activities and attractions for visitors to enjoy.
Common Questions
What is Per Capita Income in El Granada?
Per Capita income in El Granada is $95,459.
What is the Median Family Income in El Granada?
Median Family Income in El Granada is $215,980.
What is the Median Household income in El Granada?
Median Household Income in El Granada is $216,104.
What is Income or Wage Gap in El Granada?
Income or Wage Gap in El Granada is 32.2%.
Women in El Granada earn 67.8 cents for every dollar earned by a man.
What is Inequality or Gini Index in El Granada?
Inequality or Gini Index in El Granada is 0.43.
What is the Total Population of El Granada?
Total Population of El Granada is 5,651.
What is the Total Male Population of El Granada?
Total Male Population of El Granada is 2,999.
What is the Total Female Population of El Granada?
Total Female Population of El Granada is 2,652.
What is the Ratio of Males per 100 Females in El Granada?
There are 113.08 Males per 100 Females in El Granada.
What is the Ratio of Females per 100 Males in El Granada?
There are 88.43 Females per 100 Males in El Granada.
What is the Median Population Age in El Granada?
Median Population Age in El Granada is 48.4 Years.
What is the Average Family Size in El Granada
Average Family Size in El Granada is 2.8 People.
What is the Average Household Size in El Granada
Average Household Size in El Granada is 2.6 People.
How Large is the Labor Force in El Granada?
There are 3,151 People in the Labor Forcein in El Granada.
What is the Percentage of People in the Labor Force in El Granada?
65.0% of People are in the Labor Force in El Granada.
What is the Unemployment Rate in El Granada?
Unemployment Rate in El Granada is 8.3%.