Cities with the Highest Percentage of Families with Income Above $200,000 in Kentucky
RELATED REPORTS & OPTIONS
Family Income | $200k+
Kentucky
Compare Cities
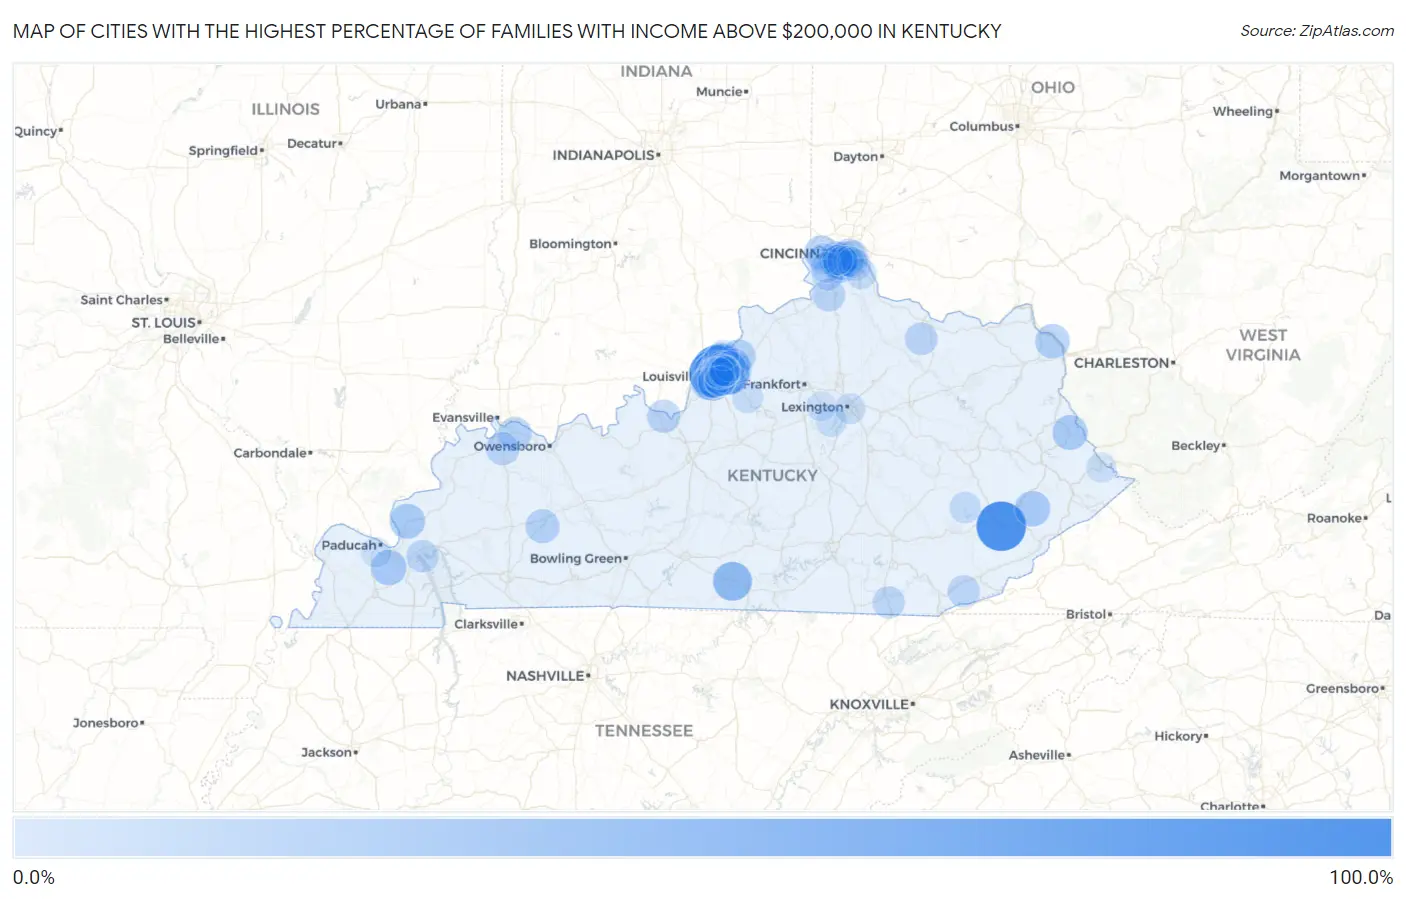
Map of Cities with the Highest Percentage of Families with Income Above $200,000 in Kentucky
0.0%
100.0%
Cities with the Highest Percentage of Families with Income Above $200,000 in Kentucky
| City | Families with Income > $200k | vs State | vs National | |
| 1. | Jeff | 98.5% | 8.2%(+90.3)#1 | 14.8%(+83.7)#53 |
| 2. | Glenview | 86.0% | 8.2%(+77.8)#2 | 14.8%(+71.2)#60 |
| 3. | Mockingbird Valley | 85.7% | 8.2%(+77.5)#3 | 14.8%(+70.9)#63 |
| 4. | Rolling Fields | 69.7% | 8.2%(+61.5)#4 | 14.8%(+54.9)#185 |
| 5. | Glenview Manor | 64.4% | 8.2%(+56.2)#5 | 14.8%(+49.6)#282 |
| 6. | Riverwood | 64.2% | 8.2%(+56.0)#6 | 14.8%(+49.4)#286 |
| 7. | Indian Hills | 62.1% | 8.2%(+53.9)#7 | 14.8%(+47.3)#340 |
| 8. | Maryhill Estates | 61.5% | 8.2%(+53.3)#8 | 14.8%(+46.7)#357 |
| 9. | Anchorage | 59.1% | 8.2%(+50.9)#9 | 14.8%(+44.3)#430 |
| 10. | Marrowbone | 50.0% | 8.2%(+41.8)#10 | 14.8%(+35.2)#794 |
| 11. | Prospect | 49.8% | 8.2%(+41.6)#11 | 14.8%(+35.0)#804 |
| 12. | Strathmoor Manor | 49.3% | 8.2%(+41.1)#12 | 14.8%(+34.5)#826 |
| 13. | Norbourne Estates | 46.9% | 8.2%(+38.7)#13 | 14.8%(+32.1)#939 |
| 14. | Manor Creek | 44.6% | 8.2%(+36.4)#14 | 14.8%(+29.8)#1,067 |
| 15. | Bellewood | 40.3% | 8.2%(+32.1)#15 | 14.8%(+25.5)#1,386 |
| 16. | Thornhill | 38.6% | 8.2%(+30.4)#16 | 14.8%(+23.8)#1,534 |
| 17. | Ten Broeck | 38.5% | 8.2%(+30.3)#17 | 14.8%(+23.7)#1,545 |
| 18. | Glenview Hills | 38.2% | 8.2%(+30.0)#18 | 14.8%(+23.4)#1,571 |
| 19. | Lakeside Park | 36.0% | 8.2%(+27.8)#19 | 14.8%(+21.2)#1,745 |
| 20. | Seneca Gardens | 35.8% | 8.2%(+27.6)#20 | 14.8%(+21.0)#1,766 |
| 21. | Pippa Passes | 34.6% | 8.2%(+26.4)#21 | 14.8%(+19.8)#1,881 |
| 22. | Symsonia | 34.5% | 8.2%(+26.3)#22 | 14.8%(+19.7)#1,893 |
| 23. | Druid Hills | 33.3% | 8.2%(+25.1)#23 | 14.8%(+18.5)#2,001 |
| 24. | Burna | 33.3% | 8.2%(+25.1)#24 | 14.8%(+18.5)#2,008 |
| 25. | Beechwood Village | 32.9% | 8.2%(+24.7)#25 | 14.8%(+18.1)#2,048 |
| 26. | Inez | 32.7% | 8.2%(+24.5)#26 | 14.8%(+17.9)#2,072 |
| 27. | Fort Mitchell | 31.4% | 8.2%(+23.2)#27 | 14.8%(+16.6)#2,211 |
| 28. | Brownsboro Village | 30.4% | 8.2%(+22.2)#28 | 14.8%(+15.6)#2,325 |
| 29. | Bellefonte | 30.2% | 8.2%(+22.0)#29 | 14.8%(+15.4)#2,351 |
| 30. | River Bluff | 30.0% | 8.2%(+21.8)#30 | 14.8%(+15.2)#2,374 |
| 31. | Villa Hills | 29.3% | 8.2%(+21.1)#31 | 14.8%(+14.5)#2,465 |
| 32. | Strathmoor Village | 28.4% | 8.2%(+20.2)#32 | 14.8%(+13.6)#2,601 |
| 33. | Francisville | 28.2% | 8.2%(+20.0)#33 | 14.8%(+13.4)#2,623 |
| 34. | Greenville | 27.8% | 8.2%(+19.6)#34 | 14.8%(+13.0)#2,687 |
| 35. | Norwood | 27.3% | 8.2%(+19.1)#35 | 14.8%(+12.5)#2,771 |
| 36. | Pewee Valley | 27.1% | 8.2%(+18.9)#36 | 14.8%(+12.3)#2,803 |
| 37. | Buckner | 27.0% | 8.2%(+18.8)#37 | 14.8%(+12.2)#2,813 |
| 38. | Edgewood | 26.4% | 8.2%(+18.2)#38 | 14.8%(+11.6)#2,885 |
| 39. | Hurstbourne | 26.2% | 8.2%(+18.0)#39 | 14.8%(+11.4)#2,915 |
| 40. | Spring Valley | 26.2% | 8.2%(+18.0)#40 | 14.8%(+11.4)#2,921 |
| 41. | Green Spring | 26.1% | 8.2%(+17.9)#41 | 14.8%(+11.3)#2,934 |
| 42. | Old Brownsboro Place | 26.1% | 8.2%(+17.9)#42 | 14.8%(+11.3)#2,935 |
| 43. | Windy Hills | 26.0% | 8.2%(+17.8)#43 | 14.8%(+11.2)#2,952 |
| 44. | Hills And Dales | 25.6% | 8.2%(+17.4)#44 | 14.8%(+10.8)#3,023 |
| 45. | Spottsville | 25.5% | 8.2%(+17.3)#45 | 14.8%(+10.7)#3,036 |
| 46. | Brownsboro Farm | 25.3% | 8.2%(+17.1)#46 | 14.8%(+10.5)#3,062 |
| 47. | Doe Valley | 24.8% | 8.2%(+16.6)#47 | 14.8%(+10.00)#3,157 |
| 48. | Richlawn | 24.3% | 8.2%(+16.1)#48 | 14.8%(+9.50)#3,243 |
| 49. | Crestwood | 24.0% | 8.2%(+15.8)#49 | 14.8%(+9.20)#3,271 |
| 50. | Anthoston | 23.9% | 8.2%(+15.7)#50 | 14.8%(+9.10)#3,310 |
| 51. | Bancroft | 23.6% | 8.2%(+15.4)#51 | 14.8%(+8.80)#3,368 |
| 52. | Verona | 23.1% | 8.2%(+14.9)#52 | 14.8%(+8.30)#3,442 |
| 53. | St Matthews | 22.8% | 8.2%(+14.6)#53 | 14.8%(+8.00)#3,493 |
| 54. | Newport | 22.7% | 8.2%(+14.5)#54 | 14.8%(+7.90)#3,514 |
| 55. | Mays Lick | 22.7% | 8.2%(+14.5)#55 | 14.8%(+7.90)#3,537 |
| 56. | Goose Creek | 22.0% | 8.2%(+13.8)#56 | 14.8%(+7.20)#3,688 |
| 57. | Murray Hill | 21.9% | 8.2%(+13.7)#57 | 14.8%(+7.10)#3,710 |
| 58. | Grand Rivers | 21.4% | 8.2%(+13.2)#58 | 14.8%(+6.60)#3,800 |
| 59. | Northfield | 21.0% | 8.2%(+12.8)#59 | 14.8%(+6.20)#3,893 |
| 60. | Pathfork | 20.9% | 8.2%(+12.7)#60 | 14.8%(+6.10)#3,919 |
| 61. | Pleasant View | 20.5% | 8.2%(+12.3)#61 | 14.8%(+5.70)#4,006 |
| 62. | Middletown | 20.4% | 8.2%(+12.2)#62 | 14.8%(+5.60)#4,016 |
| 63. | Crestview Hills | 20.4% | 8.2%(+12.2)#63 | 14.8%(+5.60)#4,027 |
| 64. | Audubon Park | 19.7% | 8.2%(+11.5)#64 | 14.8%(+4.90)#4,197 |
| 65. | Moorland | 19.7% | 8.2%(+11.5)#65 | 14.8%(+4.90)#4,200 |
| 66. | Park Hills | 19.6% | 8.2%(+11.4)#66 | 14.8%(+4.80)#4,209 |
| 67. | Bellemeade | 19.6% | 8.2%(+11.4)#67 | 14.8%(+4.80)#4,212 |
| 68. | Broeck Pointe | 19.2% | 8.2%(+11.0)#68 | 14.8%(+4.40)#4,313 |
| 69. | Kingsley | 18.9% | 8.2%(+10.7)#69 | 14.8%(+4.10)#4,393 |
| 70. | Fort Thomas | 18.0% | 8.2%(+9.80)#70 | 14.8%(+3.20)#4,626 |
| 71. | Hickory Hill | 17.9% | 8.2%(+9.70)#71 | 14.8%(+3.10)#4,677 |
| 72. | Langdon Place | 17.6% | 8.2%(+9.40)#72 | 14.8%(+2.80)#4,764 |
| 73. | Buckhorn | 17.6% | 8.2%(+9.40)#73 | 14.8%(+2.80)#4,774 |
| 74. | Douglass Hills | 17.4% | 8.2%(+9.20)#74 | 14.8%(+2.60)#4,827 |
| 75. | Wellington | 17.3% | 8.2%(+9.10)#75 | 14.8%(+2.50)#4,884 |
| 76. | Cold Spring | 16.9% | 8.2%(+8.70)#76 | 14.8%(+2.10)#4,977 |
| 77. | Union | 16.6% | 8.2%(+8.40)#77 | 14.8%(+1.80)#5,081 |
| 78. | Hebron | 16.1% | 8.2%(+7.90)#78 | 14.8%(+1.30)#5,235 |
| 79. | Barbourmeade | 16.1% | 8.2%(+7.90)#79 | 14.8%(+1.30)#5,245 |
| 80. | St Regis Park | 15.8% | 8.2%(+7.60)#80 | 14.8%(+1.000)#5,357 |
| 81. | Keene | 15.8% | 8.2%(+7.60)#81 | 14.8%(+1.000)#5,369 |
| 82. | Alexandria | 15.2% | 8.2%(+7.00)#82 | 14.8%(+0.400)#5,547 |
| 83. | Oakbrook | 15.1% | 8.2%(+6.90)#83 | 14.8%(+0.300)#5,597 |
| 84. | Wilder | 14.5% | 8.2%(+6.30)#84 | 14.8%(-0.300)#5,826 |
| 85. | Elk Creek | 14.5% | 8.2%(+6.30)#85 | 14.8%(-0.300)#5,831 |
| 86. | Lexington | 14.3% | 8.2%(+6.10)#86 | 14.8%(-0.500)#5,890 |
| 87. | Graymoor Devondale | 14.0% | 8.2%(+5.80)#87 | 14.8%(-0.800)#6,050 |
| 88. | Westwood | 13.9% | 8.2%(+5.70)#88 | 14.8%(-0.900)#6,111 |
| 89. | Fort Wright | 13.7% | 8.2%(+5.50)#89 | 14.8%(-1.10)#6,191 |
| 90. | Orchard Grass Hills | 13.7% | 8.2%(+5.50)#90 | 14.8%(-1.10)#6,208 |
| 91. | Highland Heights | 13.6% | 8.2%(+5.40)#91 | 14.8%(-1.20)#6,238 |
| 92. | Philpot | 13.1% | 8.2%(+4.90)#92 | 14.8%(-1.70)#6,478 |
| 93. | Goshen | 12.7% | 8.2%(+4.50)#93 | 14.8%(-2.10)#6,668 |
| 94. | Crossgate | 12.7% | 8.2%(+4.50)#94 | 14.8%(-2.10)#6,678 |
| 95. | Crescent Springs | 12.3% | 8.2%(+4.10)#95 | 14.8%(-2.50)#6,852 |
| 96. | Cambridge | 12.1% | 8.2%(+3.90)#96 | 14.8%(-2.70)#6,990 |
| 97. | Belfry | 12.0% | 8.2%(+3.80)#97 | 14.8%(-2.80)#7,036 |
| 98. | Hendron | 11.8% | 8.2%(+3.60)#98 | 14.8%(-3.00)#7,106 |
| 99. | Creekside | 11.7% | 8.2%(+3.50)#99 | 14.8%(-3.10)#7,191 |
| 100. | Versailles | 11.5% | 8.2%(+3.30)#100 | 14.8%(-3.30)#7,277 |
Common Questions
What are the Top 10 Cities with the Highest Percentage of Families with Income Above $200,000 in Kentucky?
Top 10 Cities with the Highest Percentage of Families with Income Above $200,000 in Kentucky are:
#1
98.5%
#2
86.0%
#3
85.7%
#4
69.7%
#5
64.4%
#6
64.2%
#7
62.1%
#8
61.5%
#9
59.1%
#10
50.0%
What city has the Highest Percentage of Families with Income Above $200,000 in Kentucky?
Jeff has the Highest Percentage of Families with Income Above $200,000 in Kentucky with 98.5%.
What is the Percentage of Families with Income Above $200,000 in the State of Kentucky?
Percentage of Families with Income Above $200,000 in Kentucky is 8.2%.
What is the Percentage of Families with Income Above $200,000 in the United States?
Percentage of Families with Income Above $200,000 in the United States is 14.8%.