Cities with the Highest Percentage of Families with Income Above $200,000 in New Jersey
RELATED REPORTS & OPTIONS
Family Income | $200k+
New Jersey
Compare Cities
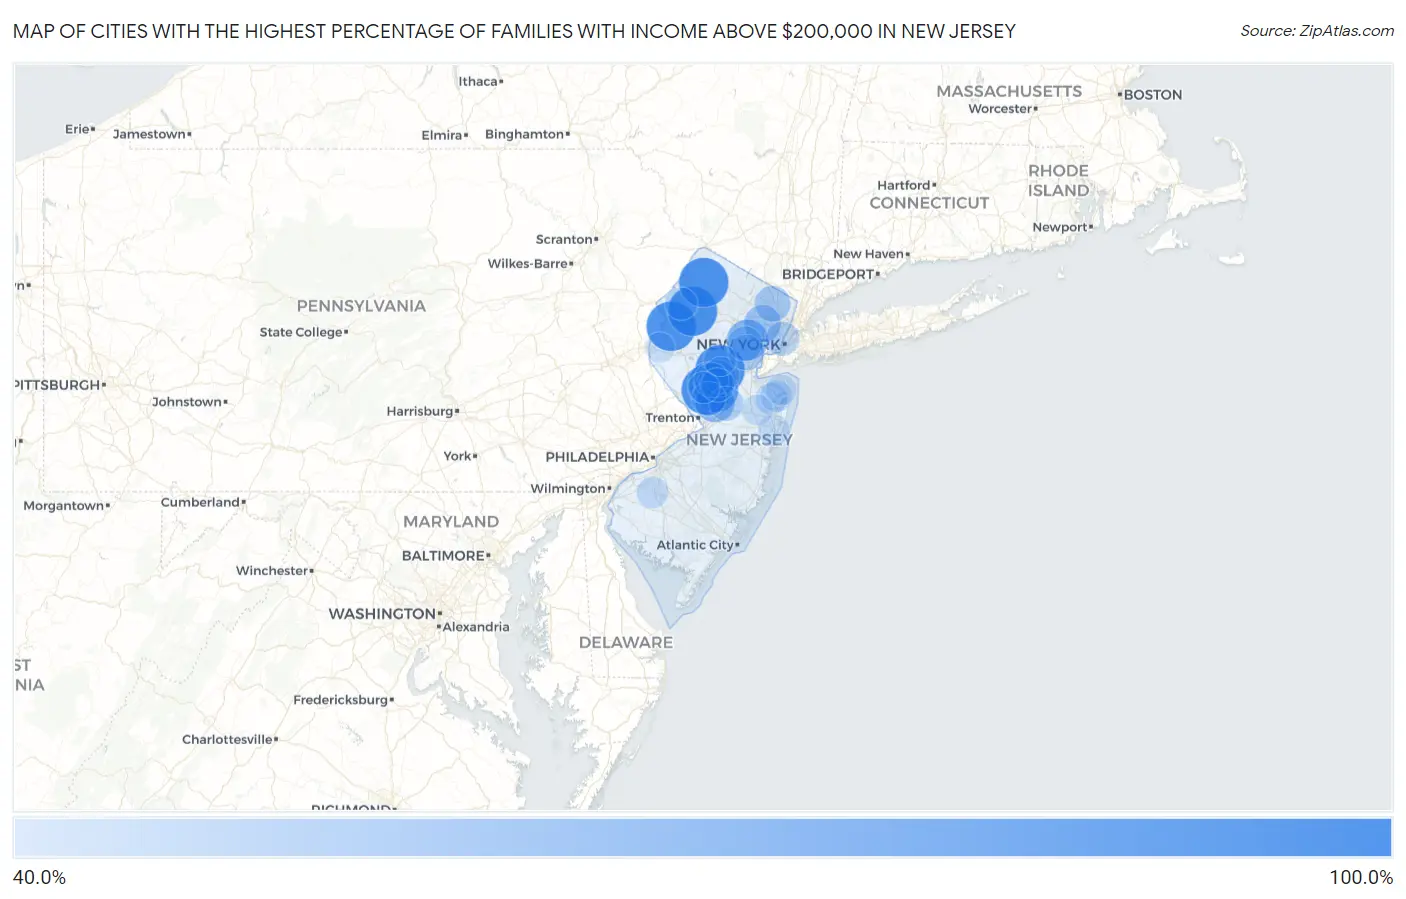
Map of Cities with the Highest Percentage of Families with Income Above $200,000 in New Jersey
0.0%
100.0%
Cities with the Highest Percentage of Families with Income Above $200,000 in New Jersey
| City | Families with Income > $200k | vs State | vs National | |
| 1. | Blawenburg | 100.0% | 24.7%(+75.3)#1 | 14.8%(+85.2)#12 |
| 2. | Buttzville | 100.0% | 24.7%(+75.3)#2 | 14.8%(+85.2)#13 |
| 3. | Allamuchy | 100.0% | 24.7%(+75.3)#3 | 14.8%(+85.2)#14 |
| 4. | Zarephath | 100.0% | 24.7%(+75.3)#4 | 14.8%(+85.2)#25 |
| 5. | Ross Corner | 100.0% | 24.7%(+75.3)#5 | 14.8%(+85.2)#26 |
| 6. | Tavistock Borough | 100.0% | 24.7%(+75.3)#6 | 14.8%(+85.2)#50 |
| 7. | Harlingen | 85.0% | 24.7%(+60.3)#7 | 14.8%(+70.2)#66 |
| 8. | East Rocky Hill | 84.7% | 24.7%(+60.0)#8 | 14.8%(+69.9)#68 |
| 9. | Short Hills | 76.2% | 24.7%(+51.5)#9 | 14.8%(+61.4)#106 |
| 10. | Lyons | 75.9% | 24.7%(+51.2)#10 | 14.8%(+61.1)#109 |
| 11. | Ho Ho Kus Borough | 73.0% | 24.7%(+48.3)#11 | 14.8%(+58.2)#139 |
| 12. | Princeton Junction | 72.2% | 24.7%(+47.5)#12 | 14.8%(+57.4)#148 |
| 13. | Essex Fells Borough | 71.6% | 24.7%(+46.9)#13 | 14.8%(+56.8)#160 |
| 14. | Mountain Lakes Borough | 69.3% | 24.7%(+44.6)#14 | 14.8%(+54.5)#189 |
| 15. | Rumson Borough | 68.5% | 24.7%(+43.8)#15 | 14.8%(+53.7)#200 |
| 16. | Llewellyn Park | 68.0% | 24.7%(+43.3)#16 | 14.8%(+53.2)#211 |
| 17. | Liberty Corner | 67.9% | 24.7%(+43.2)#17 | 14.8%(+53.1)#213 |
| 18. | Chatham Borough | 67.6% | 24.7%(+42.9)#18 | 14.8%(+52.8)#219 |
| 19. | Glen Ridge Borough | 67.1% | 24.7%(+42.4)#19 | 14.8%(+52.3)#224 |
| 20. | Forsgate | 66.4% | 24.7%(+41.7)#20 | 14.8%(+51.6)#236 |
| 21. | Upper Montclair | 66.3% | 24.7%(+41.6)#21 | 14.8%(+51.5)#238 |
| 22. | Blackwells Mills | 66.3% | 24.7%(+41.6)#22 | 14.8%(+51.5)#239 |
| 23. | Deans | 66.3% | 24.7%(+41.6)#23 | 14.8%(+51.5)#241 |
| 24. | East Millstone | 63.9% | 24.7%(+39.2)#24 | 14.8%(+49.1)#291 |
| 25. | Oldwick | 63.0% | 24.7%(+38.3)#25 | 14.8%(+48.2)#315 |
| 26. | Woodcliff Lake Borough | 62.7% | 24.7%(+38.0)#26 | 14.8%(+47.9)#318 |
| 27. | Ridgewood | 62.5% | 24.7%(+37.8)#27 | 14.8%(+47.7)#324 |
| 28. | Mantoloking Borough | 62.3% | 24.7%(+37.6)#28 | 14.8%(+47.5)#333 |
| 29. | Mendham Borough | 62.1% | 24.7%(+37.4)#29 | 14.8%(+47.3)#339 |
| 30. | Westfield | 61.8% | 24.7%(+37.1)#30 | 14.8%(+47.0)#347 |
| 31. | Saddle River Borough | 61.7% | 24.7%(+37.0)#31 | 14.8%(+46.9)#350 |
| 32. | Englewood Cliffs Borough | 60.8% | 24.7%(+36.1)#32 | 14.8%(+46.0)#385 |
| 33. | Fair Haven Borough | 60.7% | 24.7%(+36.0)#33 | 14.8%(+45.9)#388 |
| 34. | Summit | 59.6% | 24.7%(+34.9)#34 | 14.8%(+44.8)#419 |
| 35. | Franklin Lakes Borough | 59.5% | 24.7%(+34.8)#35 | 14.8%(+44.7)#421 |
| 36. | Upper Saddle River Borough | 59.0% | 24.7%(+34.3)#36 | 14.8%(+44.2)#432 |
| 37. | Neshanic Station | 59.0% | 24.7%(+34.3)#37 | 14.8%(+44.2)#433 |
| 38. | Belle Mead | 58.4% | 24.7%(+33.7)#38 | 14.8%(+43.6)#453 |
| 39. | Sea Girt Borough | 58.3% | 24.7%(+33.6)#39 | 14.8%(+43.5)#462 |
| 40. | Cranbury | 58.1% | 24.7%(+33.4)#40 | 14.8%(+43.3)#467 |
| 41. | Basking Ridge | 57.9% | 24.7%(+33.2)#41 | 14.8%(+43.1)#472 |
| 42. | Princeton | 57.6% | 24.7%(+32.9)#42 | 14.8%(+42.8)#483 |
| 43. | Hoboken | 57.5% | 24.7%(+32.8)#43 | 14.8%(+42.7)#485 |
| 44. | Tenafly Borough | 57.4% | 24.7%(+32.7)#44 | 14.8%(+42.6)#491 |
| 45. | Haworth Borough | 57.4% | 24.7%(+32.7)#45 | 14.8%(+42.6)#493 |
| 46. | Oradell Borough | 57.2% | 24.7%(+32.5)#46 | 14.8%(+42.4)#499 |
| 47. | Alpine Borough | 57.2% | 24.7%(+32.5)#47 | 14.8%(+42.4)#500 |
| 48. | Little Silver Borough | 57.0% | 24.7%(+32.3)#48 | 14.8%(+42.2)#508 |
| 49. | Bernardsville Borough | 56.5% | 24.7%(+31.8)#49 | 14.8%(+41.7)#527 |
| 50. | Griggstown | 56.1% | 24.7%(+31.4)#50 | 14.8%(+41.3)#546 |
| 51. | Towaco | 55.2% | 24.7%(+30.5)#51 | 14.8%(+40.4)#569 |
| 52. | Millington | 55.2% | 24.7%(+30.5)#52 | 14.8%(+40.4)#570 |
| 53. | Glen Rock Borough | 54.7% | 24.7%(+30.0)#53 | 14.8%(+39.9)#590 |
| 54. | Rockleigh Borough | 54.4% | 24.7%(+29.7)#54 | 14.8%(+39.6)#605 |
| 55. | The Hills | 54.2% | 24.7%(+29.5)#55 | 14.8%(+39.4)#612 |
| 56. | Packanack Lake | 54.1% | 24.7%(+29.4)#56 | 14.8%(+39.3)#614 |
| 57. | Nesco | 54.1% | 24.7%(+29.4)#57 | 14.8%(+39.3)#617 |
| 58. | Old Tappan Borough | 54.0% | 24.7%(+29.3)#58 | 14.8%(+39.2)#619 |
| 59. | Peapack And Gladstone Borough | 53.9% | 24.7%(+29.2)#59 | 14.8%(+39.1)#625 |
| 60. | Haddonfield Borough | 53.8% | 24.7%(+29.1)#60 | 14.8%(+39.0)#627 |
| 61. | Brookside | 53.8% | 24.7%(+29.1)#61 | 14.8%(+39.0)#629 |
| 62. | Goshen | 53.6% | 24.7%(+28.9)#62 | 14.8%(+38.8)#640 |
| 63. | Bridgewater Center | 53.5% | 24.7%(+28.8)#63 | 14.8%(+38.7)#642 |
| 64. | Martinsville | 53.3% | 24.7%(+28.6)#64 | 14.8%(+38.5)#649 |
| 65. | Allendale Borough | 53.2% | 24.7%(+28.5)#65 | 14.8%(+38.4)#654 |
| 66. | Gillette | 53.0% | 24.7%(+28.3)#66 | 14.8%(+38.2)#663 |
| 67. | North Caldwell Borough | 52.9% | 24.7%(+28.2)#67 | 14.8%(+38.1)#667 |
| 68. | Marksboro | 52.9% | 24.7%(+28.2)#68 | 14.8%(+38.1)#670 |
| 69. | Cream Ridge | 52.7% | 24.7%(+28.0)#69 | 14.8%(+37.9)#683 |
| 70. | Monmouth Beach Borough | 51.9% | 24.7%(+27.2)#70 | 14.8%(+37.1)#709 |
| 71. | Bay Head Borough | 51.9% | 24.7%(+27.2)#71 | 14.8%(+37.1)#710 |
| 72. | Lincroft | 51.8% | 24.7%(+27.1)#72 | 14.8%(+37.0)#713 |
| 73. | Madison Borough | 51.7% | 24.7%(+27.0)#73 | 14.8%(+36.9)#716 |
| 74. | Richwood | 51.6% | 24.7%(+26.9)#74 | 14.8%(+36.8)#725 |
| 75. | Spring Lake Borough | 51.5% | 24.7%(+26.8)#75 | 14.8%(+36.7)#731 |
| 76. | Leesburg | 51.4% | 24.7%(+26.7)#76 | 14.8%(+36.6)#736 |
| 77. | Mountainside Borough | 51.3% | 24.7%(+26.6)#77 | 14.8%(+36.5)#739 |
| 78. | Troy Hills | 51.0% | 24.7%(+26.3)#78 | 14.8%(+36.2)#750 |
| 79. | Chester Borough | 50.8% | 24.7%(+26.1)#79 | 14.8%(+36.0)#756 |
| 80. | Fairview | 50.7% | 24.7%(+26.0)#80 | 14.8%(+35.9)#759 |
| 81. | Skillman | 50.7% | 24.7%(+26.0)#81 | 14.8%(+35.9)#761 |
| 82. | Fanwood Borough | 50.5% | 24.7%(+25.8)#82 | 14.8%(+35.7)#762 |
| 83. | Sea Bright Borough | 50.3% | 24.7%(+25.6)#83 | 14.8%(+35.5)#772 |
| 84. | Allenwood | 50.3% | 24.7%(+25.6)#84 | 14.8%(+35.5)#773 |
| 85. | Hewitt | 50.2% | 24.7%(+25.5)#85 | 14.8%(+35.4)#777 |
| 86. | Demarest Borough | 50.0% | 24.7%(+25.3)#86 | 14.8%(+35.2)#783 |
| 87. | East Freehold | 49.6% | 24.7%(+24.9)#87 | 14.8%(+34.8)#811 |
| 88. | Harrington Park Borough | 49.4% | 24.7%(+24.7)#88 | 14.8%(+34.6)#820 |
| 89. | New Providence Borough | 49.3% | 24.7%(+24.6)#89 | 14.8%(+34.5)#824 |
| 90. | Neshanic | 49.2% | 24.7%(+24.5)#90 | 14.8%(+34.4)#831 |
| 91. | Hillsdale Borough | 49.0% | 24.7%(+24.3)#91 | 14.8%(+34.2)#841 |
| 92. | Stirling | 48.8% | 24.7%(+24.1)#92 | 14.8%(+34.0)#852 |
| 93. | Navesink | 48.8% | 24.7%(+24.1)#93 | 14.8%(+34.0)#853 |
| 94. | Stone Harbor Borough | 48.8% | 24.7%(+24.1)#94 | 14.8%(+34.0)#854 |
| 95. | Shrewsbury Borough | 48.3% | 24.7%(+23.6)#95 | 14.8%(+33.5)#871 |
| 96. | Pennington Borough | 47.9% | 24.7%(+23.2)#96 | 14.8%(+33.1)#886 |
| 97. | Green | 47.7% | 24.7%(+23.0)#97 | 14.8%(+32.9)#899 |
| 98. | Stewartsville | 47.5% | 24.7%(+22.8)#98 | 14.8%(+32.7)#903 |
| 99. | Park Ridge Borough | 47.4% | 24.7%(+22.7)#99 | 14.8%(+32.6)#906 |
| 100. | Robbinsville Center | 47.4% | 24.7%(+22.7)#100 | 14.8%(+32.6)#909 |
Common Questions
What are the Top 10 Cities with the Highest Percentage of Families with Income Above $200,000 in New Jersey?
Top 10 Cities with the Highest Percentage of Families with Income Above $200,000 in New Jersey are:
#1
100.0%
#2
100.0%
#3
100.0%
#4
100.0%
#5
100.0%
#6
85.0%
#7
84.7%
#8
76.2%
#9
72.2%
#10
66.3%
What city has the Highest Percentage of Families with Income Above $200,000 in New Jersey?
Blawenburg has the Highest Percentage of Families with Income Above $200,000 in New Jersey with 100.0%.
What is the Percentage of Families with Income Above $200,000 in the State of New Jersey?
Percentage of Families with Income Above $200,000 in New Jersey is 24.7%.
What is the Percentage of Families with Income Above $200,000 in the United States?
Percentage of Families with Income Above $200,000 in the United States is 14.8%.