Cities with the Highest Percentage of Families with Income Above $200,000 in Washington
RELATED REPORTS & OPTIONS
Family Income | $200k+
Washington
Compare Cities
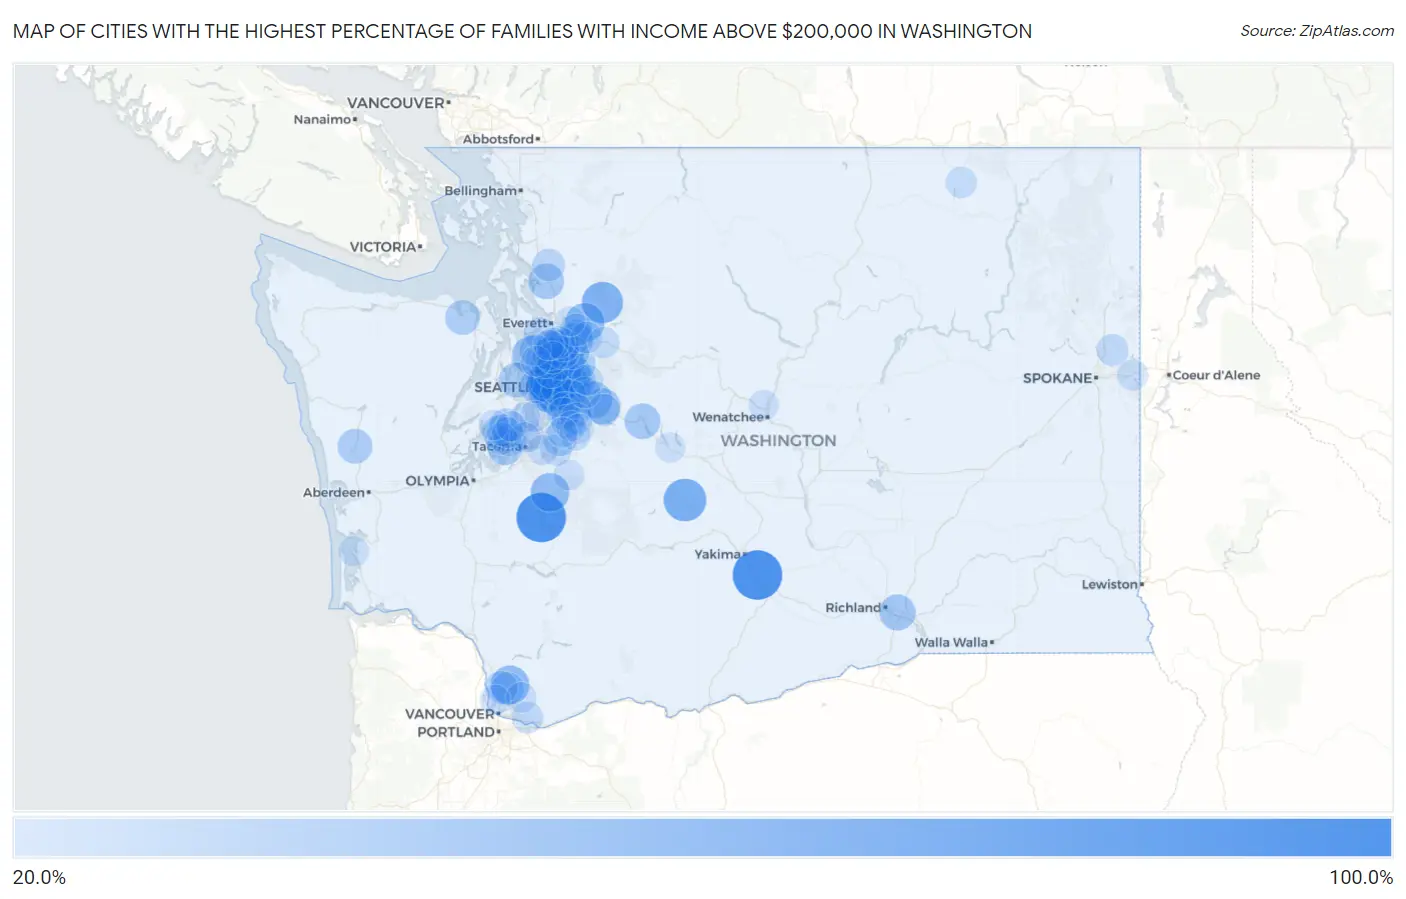
Map of Cities with the Highest Percentage of Families with Income Above $200,000 in Washington
0.0%
100.0%
Cities with the Highest Percentage of Families with Income Above $200,000 in Washington
| City | Families with Income > $200k | vs State | vs National | |
| 1. | La Grande | 100.0% | 19.4%(+80.6)#1 | 14.8%(+85.2)#5 |
| 2. | Donald | 100.0% | 19.4%(+80.6)#2 | 14.8%(+85.2)#8 |
| 3. | Clyde Hill | 80.0% | 19.4%(+60.6)#3 | 14.8%(+65.2)#86 |
| 4. | Cliffdell | 73.3% | 19.4%(+53.9)#4 | 14.8%(+58.5)#136 |
| 5. | Beaux Arts Village | 69.1% | 19.4%(+49.7)#5 | 14.8%(+54.3)#194 |
| 6. | Verlot | 68.1% | 19.4%(+48.7)#6 | 14.8%(+53.3)#209 |
| 7. | Yarrow Point | 65.6% | 19.4%(+46.2)#7 | 14.8%(+50.8)#254 |
| 8. | Medina | 65.1% | 19.4%(+45.7)#8 | 14.8%(+50.3)#261 |
| 9. | Mercer Island | 61.4% | 19.4%(+42.0)#9 | 14.8%(+46.6)#361 |
| 10. | Lake Roesiger | 60.0% | 19.4%(+40.6)#10 | 14.8%(+45.2)#406 |
| 11. | Sammamish | 58.7% | 19.4%(+39.3)#11 | 14.8%(+43.9)#439 |
| 12. | Cherry Grove | 58.6% | 19.4%(+39.2)#12 | 14.8%(+43.8)#447 |
| 13. | Kapowsin | 58.3% | 19.4%(+38.9)#13 | 14.8%(+43.5)#463 |
| 14. | Hunts Point | 57.7% | 19.4%(+38.3)#14 | 14.8%(+42.9)#482 |
| 15. | Woodway | 56.5% | 19.4%(+37.1)#15 | 14.8%(+41.7)#531 |
| 16. | Pataha | 55.0% | 19.4%(+35.6)#16 | 14.8%(+40.2)#583 |
| 17. | Union Hill Novelty Hill | 53.9% | 19.4%(+34.5)#17 | 14.8%(+39.1)#622 |
| 18. | Snoqualmie | 51.9% | 19.4%(+32.5)#18 | 14.8%(+37.1)#707 |
| 19. | Cottage Lake | 50.3% | 19.4%(+30.9)#19 | 14.8%(+35.5)#770 |
| 20. | Newcastle | 50.3% | 19.4%(+30.9)#20 | 14.8%(+35.5)#771 |
| 21. | Clearview | 49.9% | 19.4%(+30.5)#21 | 14.8%(+35.1)#800 |
| 22. | North Bend | 49.1% | 19.4%(+29.7)#22 | 14.8%(+34.3)#833 |
| 23. | West Pasco | 49.1% | 19.4%(+29.7)#23 | 14.8%(+34.3)#834 |
| 24. | Snoqualmie Pass | 47.6% | 19.4%(+28.2)#24 | 14.8%(+32.8)#901 |
| 25. | Sunday Lake | 47.1% | 19.4%(+27.7)#25 | 14.8%(+32.3)#928 |
| 26. | Redmond | 45.7% | 19.4%(+26.3)#26 | 14.8%(+30.9)#1,005 |
| 27. | Fox Island | 45.3% | 19.4%(+25.9)#27 | 14.8%(+30.5)#1,036 |
| 28. | Bellevue | 45.1% | 19.4%(+25.7)#28 | 14.8%(+30.3)#1,046 |
| 29. | Bainbridge Island | 44.3% | 19.4%(+24.9)#29 | 14.8%(+29.5)#1,075 |
| 30. | Humptulips | 43.4% | 19.4%(+24.0)#30 | 14.8%(+28.6)#1,155 |
| 31. | Blyn | 43.3% | 19.4%(+23.9)#31 | 14.8%(+28.5)#1,161 |
| 32. | Monroe North | 42.7% | 19.4%(+23.3)#32 | 14.8%(+27.9)#1,196 |
| 33. | Bothell East | 42.6% | 19.4%(+23.2)#33 | 14.8%(+27.8)#1,201 |
| 34. | Seattle | 41.8% | 19.4%(+22.4)#34 | 14.8%(+27.0)#1,272 |
| 35. | Lake Forest Park | 41.5% | 19.4%(+22.1)#35 | 14.8%(+26.7)#1,292 |
| 36. | Woodinville | 41.4% | 19.4%(+22.0)#36 | 14.8%(+26.6)#1,294 |
| 37. | Mill Creek East | 41.3% | 19.4%(+21.9)#37 | 14.8%(+26.5)#1,303 |
| 38. | Lake Holm | 41.0% | 19.4%(+21.6)#38 | 14.8%(+26.2)#1,324 |
| 39. | Ames Lake | 41.0% | 19.4%(+21.6)#39 | 14.8%(+26.2)#1,327 |
| 40. | Issaquah | 40.9% | 19.4%(+21.5)#40 | 14.8%(+26.1)#1,330 |
| 41. | Duvall | 40.5% | 19.4%(+21.1)#41 | 14.8%(+25.7)#1,368 |
| 42. | Kenmore | 40.1% | 19.4%(+20.7)#42 | 14.8%(+25.3)#1,398 |
| 43. | Raft Island | 40.0% | 19.4%(+20.6)#43 | 14.8%(+25.2)#1,409 |
| 44. | Kirkland | 39.9% | 19.4%(+20.5)#44 | 14.8%(+25.1)#1,423 |
| 45. | East Renton Highlands | 39.9% | 19.4%(+20.5)#45 | 14.8%(+25.1)#1,425 |
| 46. | High Bridge | 39.9% | 19.4%(+20.5)#46 | 14.8%(+25.1)#1,426 |
| 47. | Chain Lake | 39.7% | 19.4%(+20.3)#47 | 14.8%(+24.9)#1,438 |
| 48. | Mirrormont | 39.0% | 19.4%(+19.6)#48 | 14.8%(+24.2)#1,503 |
| 49. | Maltby | 38.6% | 19.4%(+19.2)#49 | 14.8%(+23.8)#1,524 |
| 50. | Canterwood | 38.1% | 19.4%(+18.7)#50 | 14.8%(+23.3)#1,573 |
| 51. | Riverpoint | 37.8% | 19.4%(+18.4)#51 | 14.8%(+23.0)#1,596 |
| 52. | Dollars Corner | 37.3% | 19.4%(+17.9)#52 | 14.8%(+22.5)#1,634 |
| 53. | Duluth | 37.0% | 19.4%(+17.6)#53 | 14.8%(+22.2)#1,657 |
| 54. | Shadow Lake | 36.9% | 19.4%(+17.5)#54 | 14.8%(+22.1)#1,667 |
| 55. | Mukilteo | 36.7% | 19.4%(+17.3)#55 | 14.8%(+21.9)#1,683 |
| 56. | Bothell West | 36.5% | 19.4%(+17.1)#56 | 14.8%(+21.7)#1,703 |
| 57. | Cathcart | 36.4% | 19.4%(+17.0)#57 | 14.8%(+21.6)#1,712 |
| 58. | Three Lakes | 36.1% | 19.4%(+16.7)#58 | 14.8%(+21.3)#1,736 |
| 59. | Wollochet | 35.7% | 19.4%(+16.3)#59 | 14.8%(+20.9)#1,771 |
| 60. | Lake Mcmurray | 35.5% | 19.4%(+16.1)#60 | 14.8%(+20.7)#1,794 |
| 61. | Maple Heights Lake Desire | 35.0% | 19.4%(+15.6)#61 | 14.8%(+20.2)#1,844 |
| 62. | Artondale | 34.4% | 19.4%(+15.0)#62 | 14.8%(+19.6)#1,899 |
| 63. | Hobart | 34.4% | 19.4%(+15.0)#63 | 14.8%(+19.6)#1,901 |
| 64. | Riverbend | 34.4% | 19.4%(+15.0)#64 | 14.8%(+19.6)#1,905 |
| 65. | Silver Firs | 34.2% | 19.4%(+14.8)#65 | 14.8%(+19.4)#1,920 |
| 66. | Mill Creek | 33.9% | 19.4%(+14.5)#66 | 14.8%(+19.1)#1,942 |
| 67. | Bothell | 33.7% | 19.4%(+14.3)#67 | 14.8%(+18.9)#1,963 |
| 68. | Green Bluff | 33.3% | 19.4%(+13.9)#68 | 14.8%(+18.5)#2,004 |
| 69. | Rosedale | 33.1% | 19.4%(+13.7)#69 | 14.8%(+18.3)#2,035 |
| 70. | Camas | 32.5% | 19.4%(+13.1)#70 | 14.8%(+17.7)#2,090 |
| 71. | Woods Creek | 32.2% | 19.4%(+12.8)#71 | 14.8%(+17.4)#2,130 |
| 72. | Fall City | 32.0% | 19.4%(+12.6)#72 | 14.8%(+17.2)#2,155 |
| 73. | Edmonds | 31.8% | 19.4%(+12.4)#73 | 14.8%(+17.0)#2,170 |
| 74. | Lake Tapps | 31.8% | 19.4%(+12.4)#74 | 14.8%(+17.0)#2,175 |
| 75. | Roche Harbor | 31.8% | 19.4%(+12.4)#75 | 14.8%(+17.0)#2,180 |
| 76. | Startup | 31.8% | 19.4%(+12.4)#76 | 14.8%(+17.0)#2,181 |
| 77. | Malo | 30.8% | 19.4%(+11.4)#77 | 14.8%(+16.0)#2,285 |
| 78. | Carnation | 30.5% | 19.4%(+11.1)#78 | 14.8%(+15.7)#2,310 |
| 79. | Black Diamond | 30.4% | 19.4%(+11.0)#79 | 14.8%(+15.6)#2,320 |
| 80. | Dash Point | 29.8% | 19.4%(+10.4)#80 | 14.8%(+15.0)#2,396 |
| 81. | Liberty Lake | 29.7% | 19.4%(+10.3)#81 | 14.8%(+14.9)#2,402 |
| 82. | Normandy Park | 29.4% | 19.4%(+10.00)#82 | 14.8%(+14.6)#2,445 |
| 83. | Shoreline | 28.9% | 19.4%(+9.50)#83 | 14.8%(+14.1)#2,504 |
| 84. | Gig Harbor | 28.9% | 19.4%(+9.50)#84 | 14.8%(+14.1)#2,511 |
| 85. | Hockinson | 28.9% | 19.4%(+9.50)#85 | 14.8%(+14.1)#2,515 |
| 86. | Carbonado | 28.6% | 19.4%(+9.20)#86 | 14.8%(+13.8)#2,570 |
| 87. | Vashon | 28.5% | 19.4%(+9.10)#87 | 14.8%(+13.7)#2,581 |
| 88. | Felida | 28.5% | 19.4%(+9.10)#88 | 14.8%(+13.7)#2,582 |
| 89. | Browns Point | 28.5% | 19.4%(+9.10)#89 | 14.8%(+13.7)#2,589 |
| 90. | Sunnyslope | 28.2% | 19.4%(+8.80)#90 | 14.8%(+13.4)#2,626 |
| 91. | Stansberry Lake | 28.2% | 19.4%(+8.80)#91 | 14.8%(+13.4)#2,629 |
| 92. | Martha Lake | 28.1% | 19.4%(+8.70)#92 | 14.8%(+13.3)#2,635 |
| 93. | Maplewood | 27.9% | 19.4%(+8.50)#93 | 14.8%(+13.1)#2,673 |
| 94. | Edgewood | 27.7% | 19.4%(+8.30)#94 | 14.8%(+12.9)#2,707 |
| 95. | Bay Center | 27.7% | 19.4%(+8.30)#95 | 14.8%(+12.9)#2,715 |
| 96. | Maple Valley | 27.5% | 19.4%(+8.10)#96 | 14.8%(+12.7)#2,729 |
| 97. | Easton | 27.4% | 19.4%(+8.00)#97 | 14.8%(+12.6)#2,761 |
| 98. | Ravensdale | 27.1% | 19.4%(+7.70)#98 | 14.8%(+12.3)#2,807 |
| 99. | Machias | 27.0% | 19.4%(+7.60)#99 | 14.8%(+12.2)#2,818 |
| 100. | Lake Morton Berrydale | 26.9% | 19.4%(+7.50)#100 | 14.8%(+12.1)#2,828 |
Common Questions
What are the Top 10 Cities with the Highest Percentage of Families with Income Above $200,000 in Washington?
Top 10 Cities with the Highest Percentage of Families with Income Above $200,000 in Washington are:
#1
100.0%
#2
100.0%
#3
80.0%
#4
73.3%
#5
69.1%
#6
68.1%
#7
65.6%
#8
65.1%
#9
61.4%
#10
60.0%
What city has the Highest Percentage of Families with Income Above $200,000 in Washington?
La Grande has the Highest Percentage of Families with Income Above $200,000 in Washington with 100.0%.
What is the Percentage of Families with Income Above $200,000 in the State of Washington?
Percentage of Families with Income Above $200,000 in Washington is 19.4%.
What is the Percentage of Families with Income Above $200,000 in the United States?
Percentage of Families with Income Above $200,000 in the United States is 14.8%.