Danville, CA Map & Demographics
Danville Map
Danville Overview
$96,855
PER CAPITA INCOME
$242,352
AVG FAMILY INCOME
$209,518
AVG HOUSEHOLD INCOME
47.9%
WAGE / INCOME GAP [ % ]
52.1¢/ $1
WAGE / INCOME GAP [ $ ]
$10,512
FAMILY INCOME DEFICIT
0.43
INEQUALITY / GINI INDEX
43,449
TOTAL POPULATION
21,799
MALE POPULATION
21,650
FEMALE POPULATION
100.69
MALES / 100 FEMALES
99.32
FEMALES / 100 MALES
46.1
MEDIAN AGE
3.1
AVG FAMILY SIZE
2.8
AVG HOUSEHOLD SIZE
21,593
LABOR FORCE [ PEOPLE ]
63.4%
PERCENT IN LABOR FORCE
4.4%
UNEMPLOYMENT RATE
Danville Area Codes
Income in Danville
Income Overview in Danville
Per Capita Income in Danville is $96,855, while median incomes of families and households are $242,352 and $209,518 respectively.
| Characteristic | Number | Measure |
| Per Capita Income | 43,449 | $96,855 |
| Median Family Income | 12,185 | $242,352 |
| Mean Family Income | 12,185 | $301,116 |
| Median Household Income | 15,726 | $209,518 |
| Mean Household Income | 15,726 | $264,134 |
| Income Deficit | 12,185 | $10,512 |
| Wage / Income Gap (%) | 43,449 | 47.89% |
| Wage / Income Gap ($) | 43,449 | 52.11¢ per $1 |
| Gini / Inequality Index | 43,449 | 0.43 |
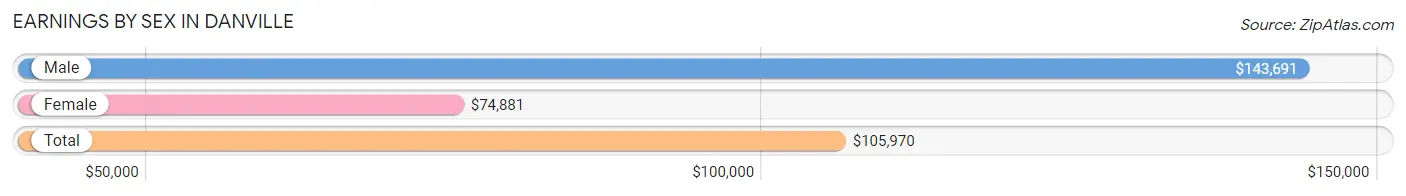
Earnings by Sex in Danville
Average Earnings in Danville are $105,970, $143,691 for men and $74,881 for women, a difference of 47.9%.
| Sex | Number | Average Earnings |
| Male | 12,321 (54.1%) | $143,691 |
| Female | 10,440 (45.9%) | $74,881 |
| Total | 22,761 (100.0%) | $105,970 |
Earnings by Sex by Income Bracket in Danville
The most common earnings brackets in Danville are $100,000+ for men (7,810 | 63.4%) and $100,000+ for women (4,087 | 39.2%).
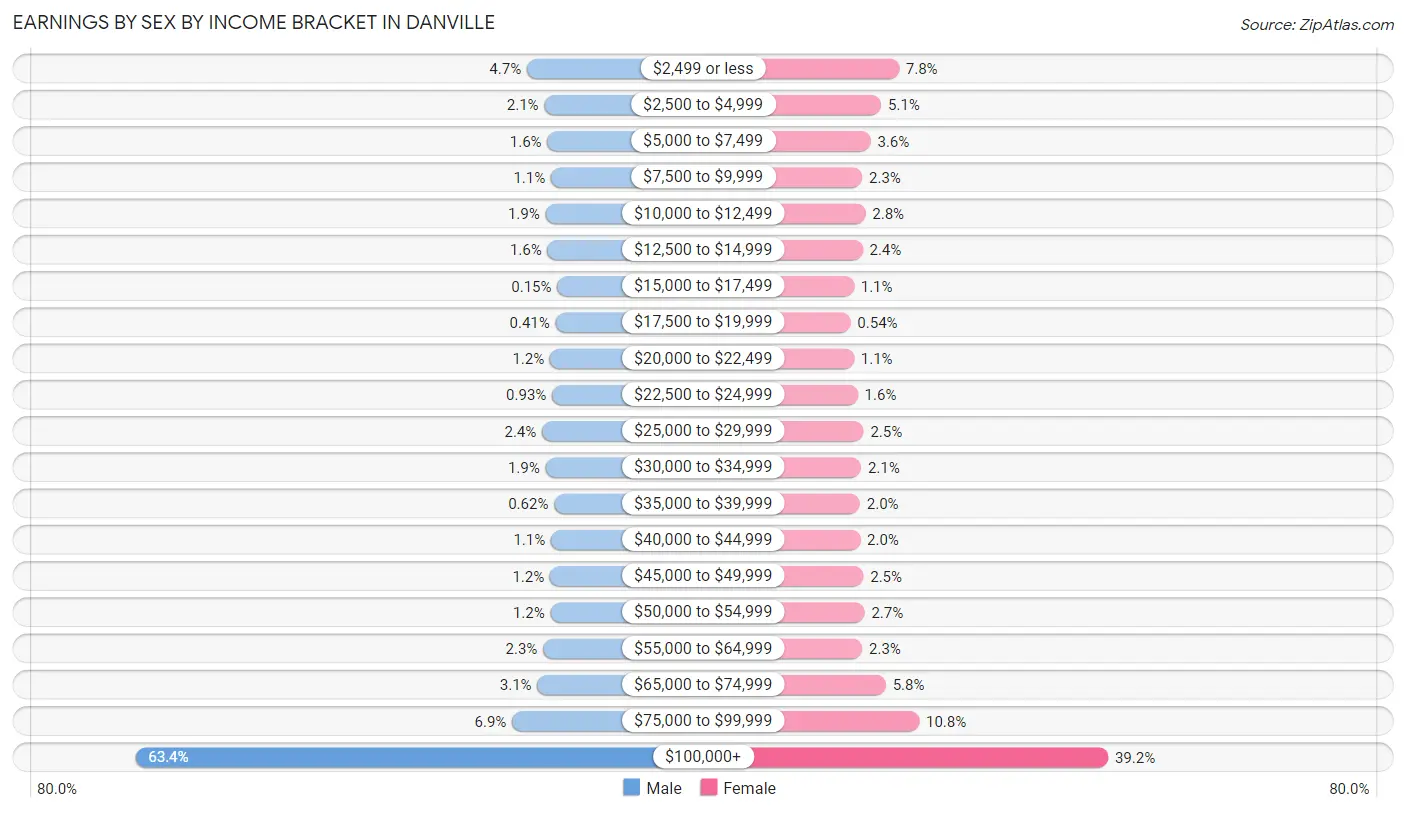
| Income | Male | Female |
| $2,499 or less | 579 (4.7%) | 814 (7.8%) |
| $2,500 to $4,999 | 258 (2.1%) | 537 (5.1%) |
| $5,000 to $7,499 | 202 (1.6%) | 372 (3.6%) |
| $7,500 to $9,999 | 135 (1.1%) | 239 (2.3%) |
| $10,000 to $12,499 | 237 (1.9%) | 290 (2.8%) |
| $12,500 to $14,999 | 200 (1.6%) | 246 (2.4%) |
| $15,000 to $17,499 | 18 (0.2%) | 110 (1.1%) |
| $17,500 to $19,999 | 50 (0.4%) | 56 (0.5%) |
| $20,000 to $22,499 | 153 (1.2%) | 111 (1.1%) |
| $22,500 to $24,999 | 114 (0.9%) | 170 (1.6%) |
| $25,000 to $29,999 | 300 (2.4%) | 261 (2.5%) |
| $30,000 to $34,999 | 237 (1.9%) | 221 (2.1%) |
| $35,000 to $39,999 | 76 (0.6%) | 204 (1.9%) |
| $40,000 to $44,999 | 136 (1.1%) | 208 (2.0%) |
| $45,000 to $49,999 | 153 (1.2%) | 258 (2.5%) |
| $50,000 to $54,999 | 144 (1.2%) | 277 (2.6%) |
| $55,000 to $64,999 | 281 (2.3%) | 239 (2.3%) |
| $65,000 to $74,999 | 386 (3.1%) | 609 (5.8%) |
| $75,000 to $99,999 | 852 (6.9%) | 1,131 (10.8%) |
| $100,000+ | 7,810 (63.4%) | 4,087 (39.2%) |
| Total | 12,321 (100.0%) | 10,440 (100.0%) |
Earnings by Sex by Educational Attainment in Danville
Average earnings in Danville are $163,761 for men and $89,811 for women, a difference of 45.2%. Men with an educational attainment of graduate degree enjoy the highest average annual earnings of $207,803, while those with college or associate's degree education earn the least with $98,042. Women with an educational attainment of graduate degree earn the most with the average annual earnings of $100,873, while those with less than high school education have the smallest earnings of $2,499.
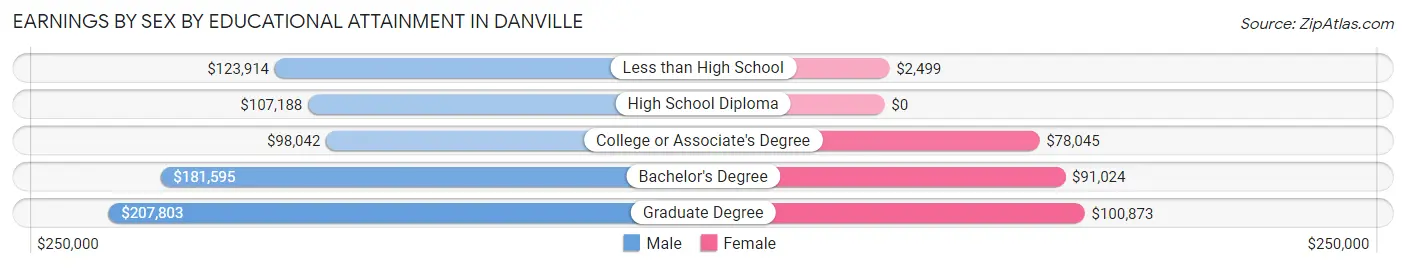
| Educational Attainment | Male Income | Female Income |
| Less than High School | $123,914 | $2,499 |
| High School Diploma | $107,188 | $0 |
| College or Associate's Degree | $98,042 | $78,045 |
| Bachelor's Degree | $181,595 | $91,024 |
| Graduate Degree | $207,803 | $100,873 |
| Total | $163,761 | $89,811 |
Family Income in Danville
Family Income Brackets in Danville
According to the Danville family income data, there are 7,226 families falling into the $200,000+ income range, which is the most common income bracket and makes up 59.3% of all families. Conversely, the $10,000 to $14,999 income bracket is the least frequent group with only 110 families (0.9%) belonging to this category.
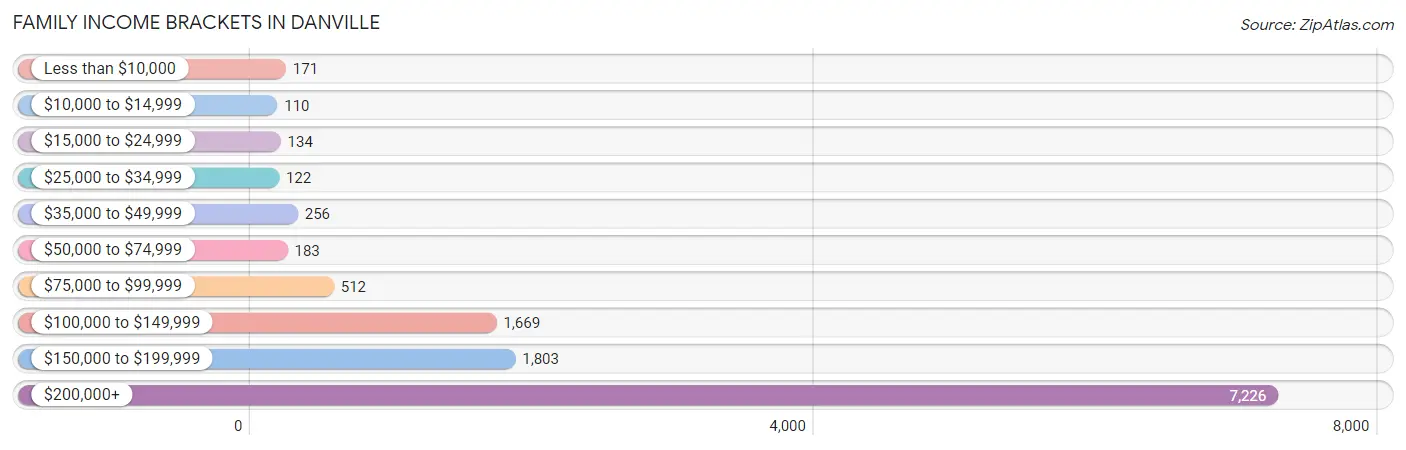
| Income Bracket | # Families | % Families |
| Less than $10,000 | 171 | 1.4% |
| $10,000 to $14,999 | 110 | 0.9% |
| $15,000 to $24,999 | 134 | 1.1% |
| $25,000 to $34,999 | 122 | 1.0% |
| $35,000 to $49,999 | 256 | 2.1% |
| $50,000 to $74,999 | 183 | 1.5% |
| $75,000 to $99,999 | 512 | 4.2% |
| $100,000 to $149,999 | 1,669 | 13.7% |
| $150,000 to $199,999 | 1,803 | 14.8% |
| $200,000+ | 7,226 | 59.3% |
Family Income by Famaliy Size in Danville
4-person families (2,857 | 23.4%) account for the highest median family income in Danville with $250,001 per family, while 2-person families (5,234 | 42.9%) have the highest median income of $91,666 per family member.
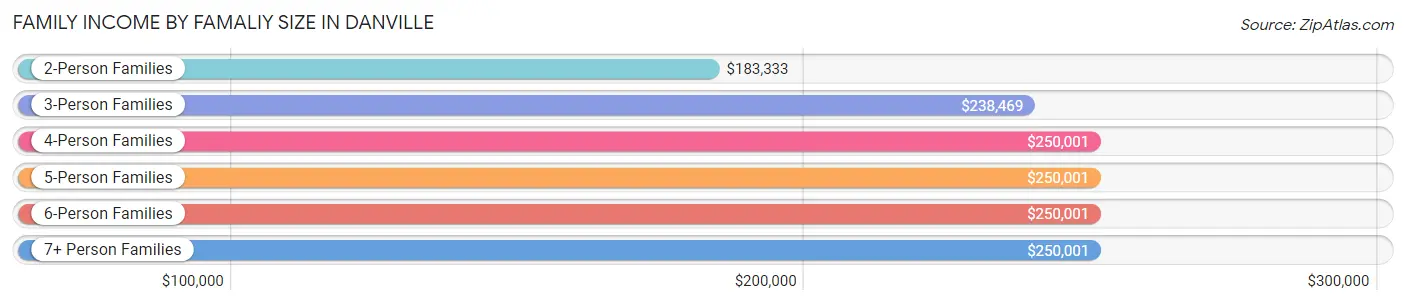
| Income Bracket | # Families | Median Income |
| 2-Person Families | 5,234 (42.9%) | $183,333 |
| 3-Person Families | 2,602 (21.3%) | $238,469 |
| 4-Person Families | 2,857 (23.4%) | $250,001 |
| 5-Person Families | 1,262 (10.4%) | $250,001 |
| 6-Person Families | 164 (1.3%) | $250,001 |
| 7+ Person Families | 66 (0.5%) | $250,001 |
| Total | 12,185 (100.0%) | $242,352 |
Family Income by Number of Earners in Danville
The median family income in Danville is $242,352, with families comprising 2 earners (5,965) having the highest median family income of $250,001, while families with no earners (1,856) have the lowest median family income of $117,857, accounting for 48.9% and 15.2% of families, respectively.
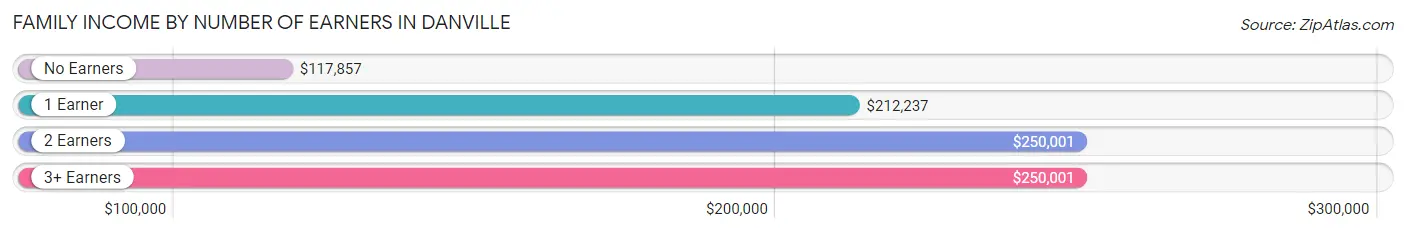
| Number of Earners | # Families | Median Income |
| No Earners | 1,856 (15.2%) | $117,857 |
| 1 Earner | 3,123 (25.6%) | $212,237 |
| 2 Earners | 5,965 (48.9%) | $250,001 |
| 3+ Earners | 1,241 (10.2%) | $250,001 |
| Total | 12,185 (100.0%) | $242,352 |
Household Income in Danville
Household Income Brackets in Danville
With 8,083 households falling in the category, the $200,000+ income range is the most frequent in Danville, accounting for 51.4% of all households. In contrast, only 267 households (1.7%) fall into the $10,000 to $14,999 income bracket, making it the least populous group.
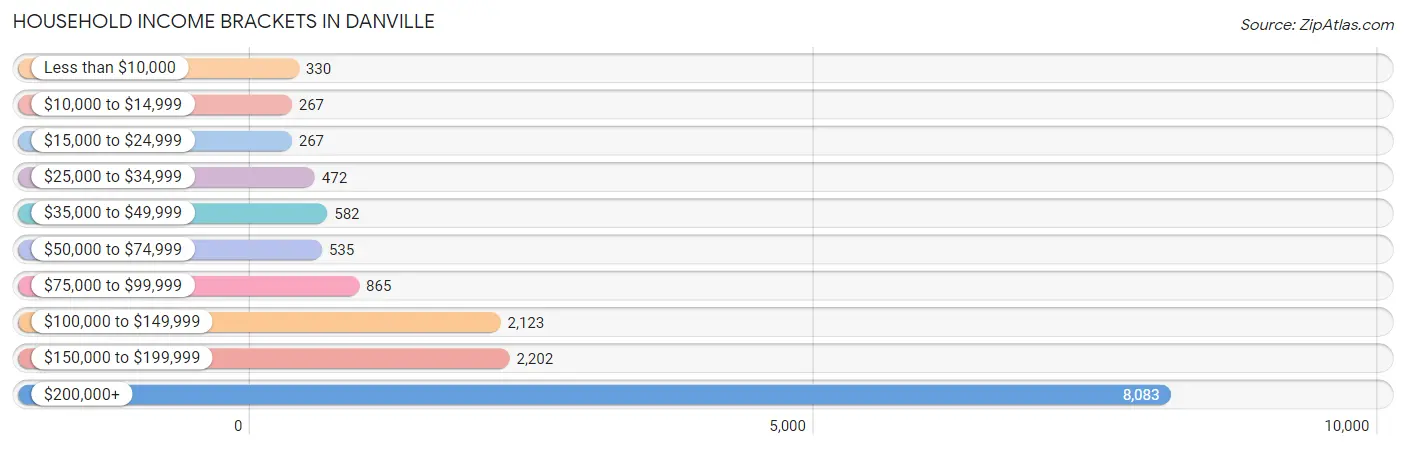
| Income Bracket | # Households | % Households |
| Less than $10,000 | 330 | 2.1% |
| $10,000 to $14,999 | 267 | 1.7% |
| $15,000 to $24,999 | 267 | 1.7% |
| $25,000 to $34,999 | 472 | 3.0% |
| $35,000 to $49,999 | 582 | 3.7% |
| $50,000 to $74,999 | 535 | 3.4% |
| $75,000 to $99,999 | 865 | 5.5% |
| $100,000 to $149,999 | 2,123 | 13.5% |
| $150,000 to $199,999 | 2,202 | 14.0% |
| $200,000+ | 8,083 | 51.4% |
Household Income by Householder Age in Danville
The median household income in Danville is $209,518, with the highest median household income of $250,001 found in the 25 to 44 years age bracket for the primary householder. A total of 3,190 households (20.3%) fall into this category. Meanwhile, the 15 to 24 years age bracket for the primary householder has the lowest median household income of $43,977, with 50 households (0.3%) in this group.
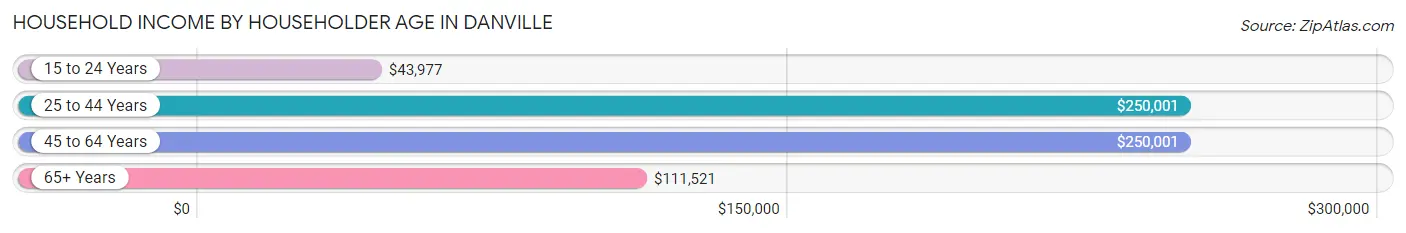
| Income Bracket | # Households | Median Income |
| 15 to 24 Years | 50 (0.3%) | $43,977 |
| 25 to 44 Years | 3,190 (20.3%) | $250,001 |
| 45 to 64 Years | 7,513 (47.8%) | $250,001 |
| 65+ Years | 4,973 (31.6%) | $111,521 |
| Total | 15,726 (100.0%) | $209,518 |
Poverty in Danville
Income Below Poverty by Sex and Age in Danville
With 3.9% poverty level for males and 3.5% for females among the residents of Danville, 65 to 74 year old males and 18 to 24 year old females are the most vulnerable to poverty, with 247 males (10.0%) and 100 females (6.6%) in their respective age groups living below the poverty level.
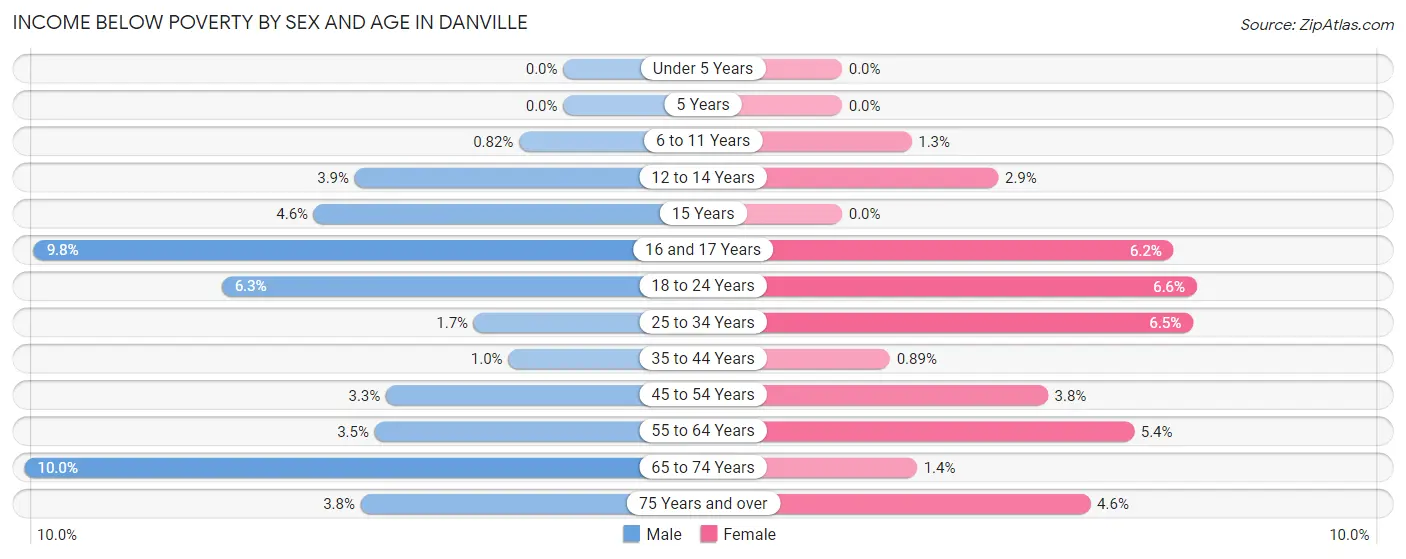
| Age Bracket | Male | Female |
| Under 5 Years | 0 (0.0%) | 0 (0.0%) |
| 5 Years | 0 (0.0%) | 0 (0.0%) |
| 6 to 11 Years | 18 (0.8%) | 18 (1.3%) |
| 12 to 14 Years | 36 (3.9%) | 40 (2.9%) |
| 15 Years | 27 (4.6%) | 0 (0.0%) |
| 16 and 17 Years | 92 (9.8%) | 43 (6.2%) |
| 18 to 24 Years | 92 (6.3%) | 100 (6.6%) |
| 25 to 34 Years | 18 (1.7%) | 73 (6.5%) |
| 35 to 44 Years | 24 (1.0%) | 22 (0.9%) |
| 45 to 54 Years | 116 (3.3%) | 146 (3.8%) |
| 55 to 64 Years | 117 (3.5%) | 186 (5.4%) |
| 65 to 74 Years | 247 (10.0%) | 29 (1.4%) |
| 75 Years and over | 59 (3.8%) | 99 (4.6%) |
| Total | 846 (3.9%) | 756 (3.5%) |
Income Above Poverty by Sex and Age in Danville
According to the poverty statistics in Danville, males aged under 5 years and females aged under 5 years are the age groups that are most secure financially, with 100.0% of males and 100.0% of females in these age groups living above the poverty line.
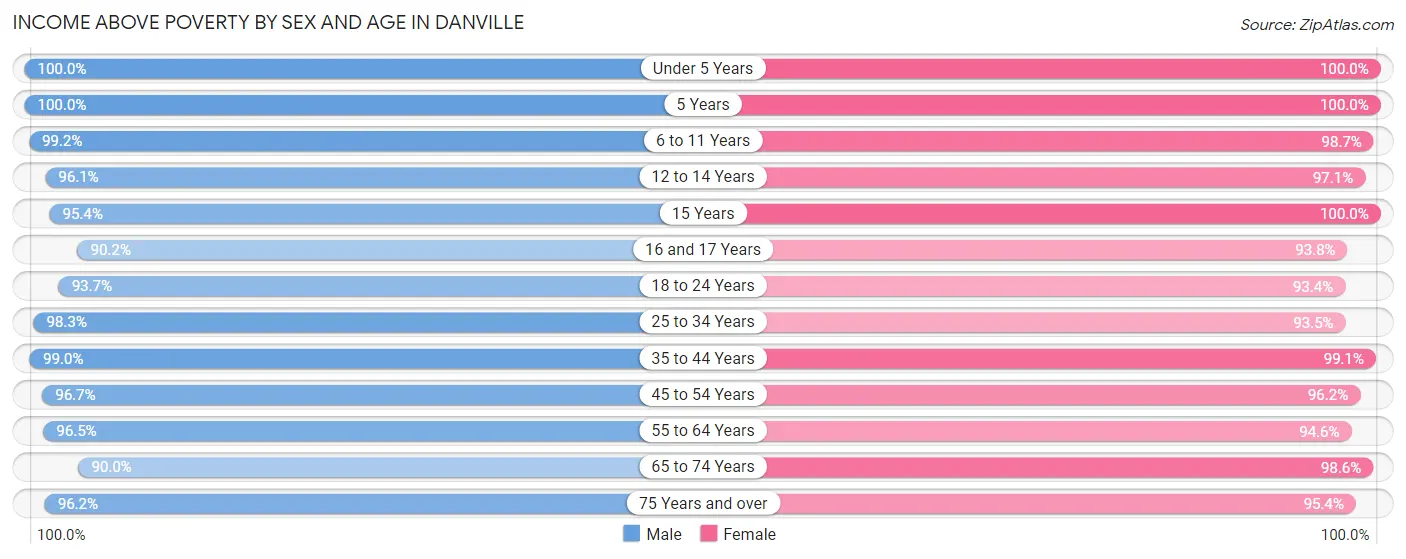
| Age Bracket | Male | Female |
| Under 5 Years | 970 (100.0%) | 828 (100.0%) |
| 5 Years | 322 (100.0%) | 259 (100.0%) |
| 6 to 11 Years | 2,169 (99.2%) | 1,374 (98.7%) |
| 12 to 14 Years | 895 (96.1%) | 1,340 (97.1%) |
| 15 Years | 556 (95.4%) | 459 (100.0%) |
| 16 and 17 Years | 844 (90.2%) | 655 (93.8%) |
| 18 to 24 Years | 1,358 (93.7%) | 1,418 (93.4%) |
| 25 to 34 Years | 1,065 (98.3%) | 1,047 (93.5%) |
| 35 to 44 Years | 2,319 (99.0%) | 2,455 (99.1%) |
| 45 to 54 Years | 3,407 (96.7%) | 3,673 (96.2%) |
| 55 to 64 Years | 3,228 (96.5%) | 3,248 (94.6%) |
| 65 to 74 Years | 2,223 (90.0%) | 2,053 (98.6%) |
| 75 Years and over | 1,510 (96.2%) | 2,048 (95.4%) |
| Total | 20,866 (96.1%) | 20,857 (96.5%) |
Income Below Poverty Among Married-Couple Families in Danville
The poverty statistics for married-couple families in Danville show that 1.5% or 159 of the total 10,578 families live below the poverty line. Families with 3 or 4 children have the highest poverty rate of 3.0%, comprising of 25 families. On the other hand, families with 5 or more children have the lowest poverty rate of 0.0%, which includes 0 families.
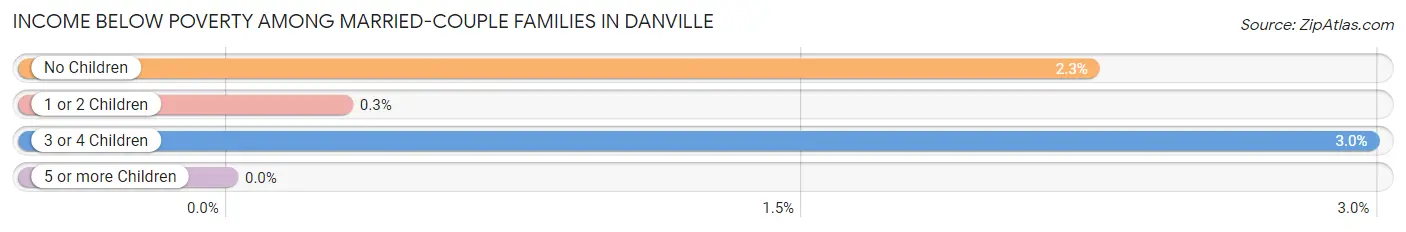
| Children | Above Poverty | Below Poverty |
| No Children | 5,253 (97.8%) | 121 (2.2%) |
| 1 or 2 Children | 4,306 (99.7%) | 13 (0.3%) |
| 3 or 4 Children | 814 (97.0%) | 25 (3.0%) |
| 5 or more Children | 46 (100.0%) | 0 (0.0%) |
| Total | 10,419 (98.5%) | 159 (1.5%) |
Income Below Poverty Among Single-Parent Households in Danville
According to the poverty data in Danville, 22.1% or 73 single-father households and 8.5% or 109 single-mother households are living below the poverty line. Among single-father households, those with no children have the highest poverty rate, with 53 households (26.0%) experiencing poverty. Likewise, among single-mother households, those with 1 or 2 children have the highest poverty rate, with 100 households (14.2%) falling below the poverty line.
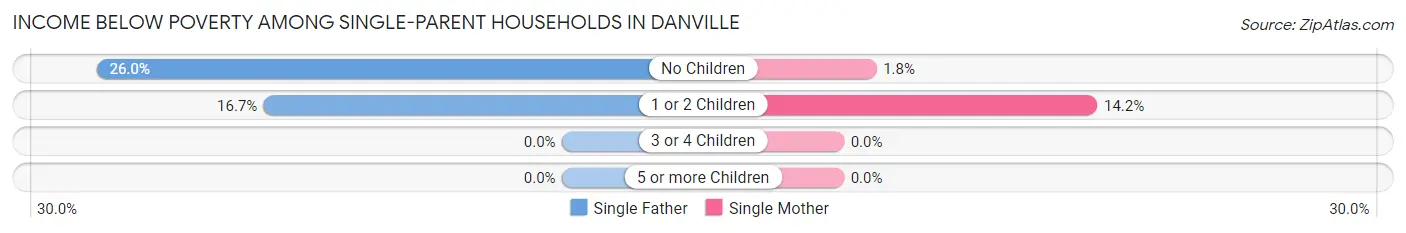
| Children | Single Father | Single Mother |
| No Children | 53 (26.0%) | 9 (1.8%) |
| 1 or 2 Children | 20 (16.7%) | 100 (14.2%) |
| 3 or 4 Children | 0 (0.0%) | 0 (0.0%) |
| 5 or more Children | 0 (0.0%) | 0 (0.0%) |
| Total | 73 (22.1%) | 109 (8.5%) |
Income Below Poverty Among Married-Couple vs Single-Parent Households in Danville
The poverty data for Danville shows that 159 of the married-couple family households (1.5%) and 182 of the single-parent households (11.3%) are living below the poverty level. Within the married-couple family households, those with 3 or 4 children have the highest poverty rate, with 25 households (3.0%) falling below the poverty line. Among the single-parent households, those with 1 or 2 children have the highest poverty rate, with 120 household (14.5%) living below poverty.
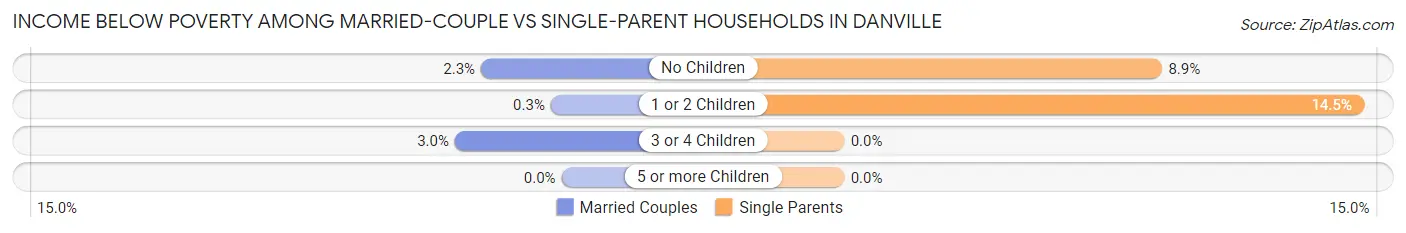
| Children | Married-Couple Families | Single-Parent Households |
| No Children | 121 (2.2%) | 62 (8.9%) |
| 1 or 2 Children | 13 (0.3%) | 120 (14.5%) |
| 3 or 4 Children | 25 (3.0%) | 0 (0.0%) |
| 5 or more Children | 0 (0.0%) | 0 (0.0%) |
| Total | 159 (1.5%) | 182 (11.3%) |
Race in Danville
The most populous races in Danville are White / Caucasian (31,637 | 72.8%), Asian (7,847 | 18.1%), and Two or more Races (3,116 | 7.2%).
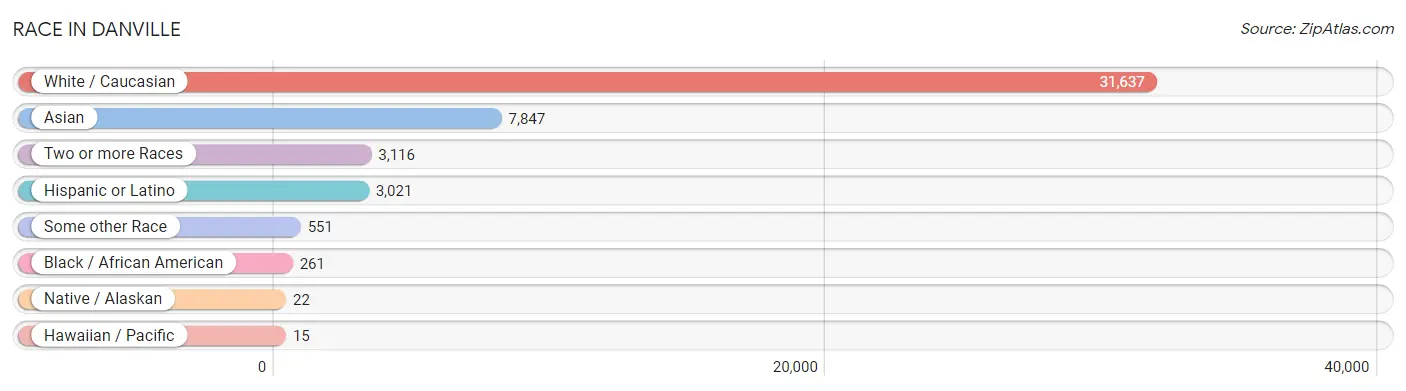
| Race | # Population | % Population |
| Asian | 7,847 | 18.1% |
| Black / African American | 261 | 0.6% |
| Hawaiian / Pacific | 15 | 0.0% |
| Hispanic or Latino | 3,021 | 7.0% |
| Native / Alaskan | 22 | 0.1% |
| White / Caucasian | 31,637 | 72.8% |
| Two or more Races | 3,116 | 7.2% |
| Some other Race | 551 | 1.3% |
| Total | 43,449 | 100.0% |
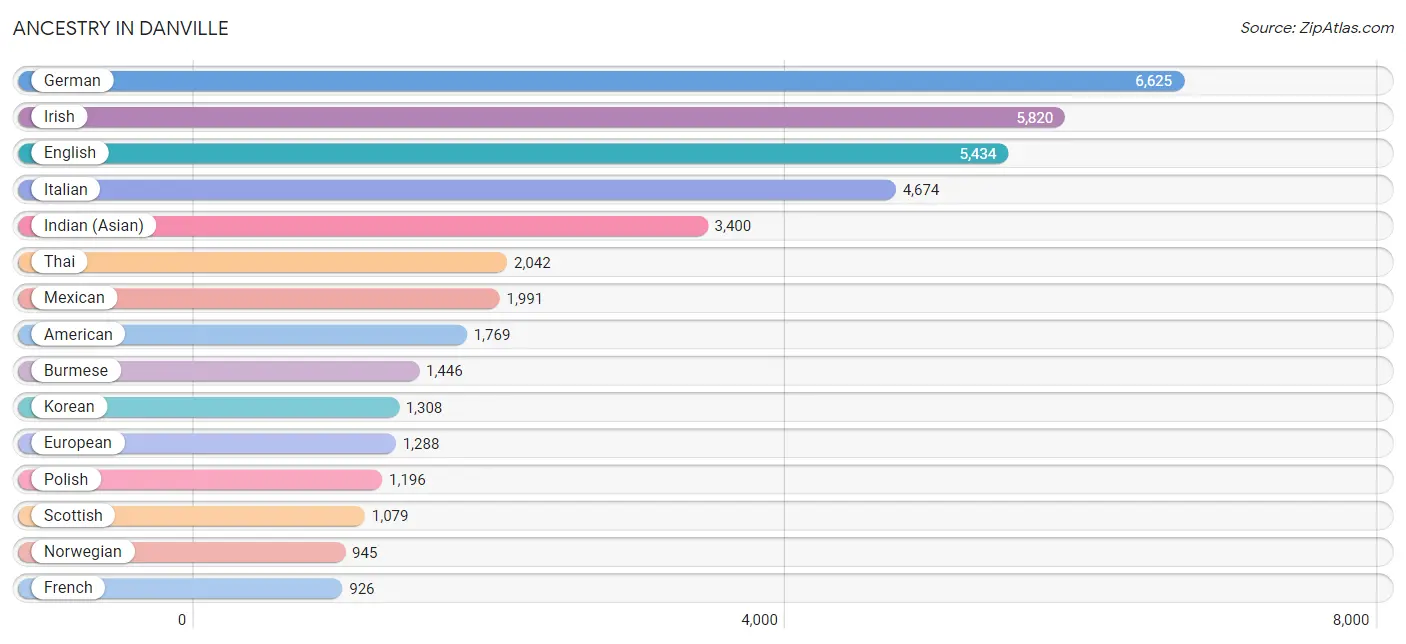
Ancestry in Danville
The most populous ancestries reported in Danville are German (6,625 | 15.2%), Irish (5,820 | 13.4%), English (5,434 | 12.5%), Italian (4,674 | 10.8%), and Indian (Asian) (3,400 | 7.8%), together accounting for 59.8% of all Danville residents.
| Ancestry | # Population | % Population |
| African | 42 | 0.1% |
| American | 1,769 | 4.1% |
| Arab | 200 | 0.5% |
| Argentinean | 91 | 0.2% |
| Armenian | 83 | 0.2% |
| Assyrian / Chaldean / Syriac | 77 | 0.2% |
| Australian | 11 | 0.0% |
| Austrian | 234 | 0.5% |
| Basque | 104 | 0.2% |
| Belgian | 61 | 0.1% |
| Bhutanese | 630 | 1.5% |
| Blackfeet | 10 | 0.0% |
| Bolivian | 13 | 0.0% |
| Brazilian | 130 | 0.3% |
| British | 473 | 1.1% |
| Bulgarian | 78 | 0.2% |
| Burmese | 1,446 | 3.3% |
| Cajun | 46 | 0.1% |
| Canadian | 104 | 0.2% |
| Celtic | 99 | 0.2% |
| Central American | 194 | 0.4% |
| Central American Indian | 4 | 0.0% |
| Cherokee | 108 | 0.3% |
| Chilean | 29 | 0.1% |
| Colombian | 36 | 0.1% |
| Creek | 64 | 0.2% |
| Croatian | 237 | 0.5% |
| Cuban | 148 | 0.3% |
| Czech | 163 | 0.4% |
| Czechoslovakian | 15 | 0.0% |
| Danish | 542 | 1.3% |
| Dutch | 427 | 1.0% |
| Eastern European | 149 | 0.3% |
| Ecuadorian | 61 | 0.1% |
| Egyptian | 15 | 0.0% |
| English | 5,434 | 12.5% |
| Ethiopian | 13 | 0.0% |
| European | 1,288 | 3.0% |
| Filipino | 432 | 1.0% |
| Finnish | 93 | 0.2% |
| French | 926 | 2.1% |
| French Canadian | 491 | 1.1% |
| German | 6,625 | 15.2% |
| Greek | 360 | 0.8% |
| Guamanian / Chamorro | 15 | 0.0% |
| Guatemalan | 28 | 0.1% |
| Hungarian | 153 | 0.4% |
| Indian (Asian) | 3,400 | 7.8% |
| Indonesian | 39 | 0.1% |
| Iranian | 402 | 0.9% |
| Irish | 5,820 | 13.4% |
| Iroquois | 31 | 0.1% |
| Israeli | 96 | 0.2% |
| Italian | 4,674 | 10.8% |
| Jamaican | 61 | 0.1% |
| Japanese | 32 | 0.1% |
| Korean | 1,308 | 3.0% |
| Laotian | 106 | 0.2% |
| Latvian | 33 | 0.1% |
| Lebanese | 85 | 0.2% |
| Lithuanian | 30 | 0.1% |
| Luxembourger | 13 | 0.0% |
| Macedonian | 17 | 0.0% |
| Mexican | 1,991 | 4.6% |
| Mexican American Indian | 13 | 0.0% |
| Nicaraguan | 49 | 0.1% |
| Nigerian | 22 | 0.1% |
| Northern European | 196 | 0.4% |
| Norwegian | 945 | 2.2% |
| Pakistani | 11 | 0.0% |
| Peruvian | 23 | 0.1% |
| Polish | 1,196 | 2.8% |
| Portuguese | 730 | 1.7% |
| Pueblo | 83 | 0.2% |
| Puerto Rican | 22 | 0.1% |
| Romanian | 61 | 0.1% |
| Russian | 469 | 1.1% |
| Salvadoran | 117 | 0.3% |
| Scandinavian | 315 | 0.7% |
| Scotch-Irish | 604 | 1.4% |
| Scottish | 1,079 | 2.5% |
| Serbian | 73 | 0.2% |
| Sioux | 7 | 0.0% |
| Slavic | 9 | 0.0% |
| Slovak | 49 | 0.1% |
| Slovene | 24 | 0.1% |
| South American | 263 | 0.6% |
| Spaniard | 197 | 0.4% |
| Spanish | 169 | 0.4% |
| Sri Lankan | 191 | 0.4% |
| Subsaharan African | 77 | 0.2% |
| Swedish | 808 | 1.9% |
| Swiss | 373 | 0.9% |
| Syrian | 48 | 0.1% |
| Thai | 2,042 | 4.7% |
| Turkish | 30 | 0.1% |
| Ukrainian | 294 | 0.7% |
| Venezuelan | 10 | 0.0% |
| Welsh | 275 | 0.6% |
| West Indian | 24 | 0.1% |
| Yugoslavian | 12 | 0.0% | View All 101 Rows |
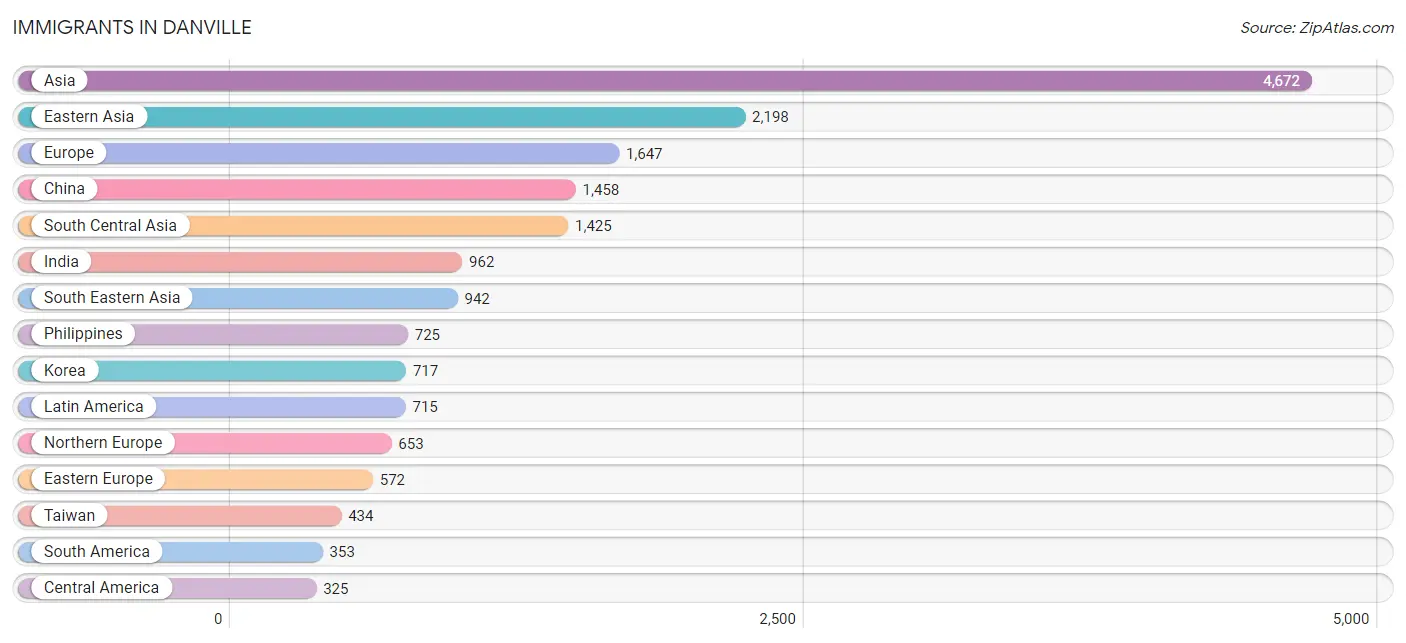
Immigrants in Danville
The most numerous immigrant groups reported in Danville came from Asia (4,672 | 10.7%), Eastern Asia (2,198 | 5.1%), Europe (1,647 | 3.8%), China (1,458 | 3.4%), and South Central Asia (1,425 | 3.3%), together accounting for 26.2% of all Danville residents.
| Immigration Origin | # Population | % Population |
| Afghanistan | 17 | 0.0% |
| Africa | 71 | 0.2% |
| Argentina | 73 | 0.2% |
| Asia | 4,672 | 10.7% |
| Australia | 11 | 0.0% |
| Austria | 8 | 0.0% |
| Belarus | 42 | 0.1% |
| Belgium | 21 | 0.1% |
| Bolivia | 13 | 0.0% |
| Brazil | 158 | 0.4% |
| Bulgaria | 38 | 0.1% |
| Cambodia | 30 | 0.1% |
| Canada | 316 | 0.7% |
| Caribbean | 37 | 0.1% |
| Central America | 325 | 0.7% |
| China | 1,458 | 3.4% |
| Colombia | 36 | 0.1% |
| Denmark | 30 | 0.1% |
| Eastern Africa | 27 | 0.1% |
| Eastern Asia | 2,198 | 5.1% |
| Eastern Europe | 572 | 1.3% |
| Ecuador | 23 | 0.1% |
| El Salvador | 59 | 0.1% |
| England | 80 | 0.2% |
| Ethiopia | 13 | 0.0% |
| Europe | 1,647 | 3.8% |
| France | 94 | 0.2% |
| Germany | 161 | 0.4% |
| Guatemala | 17 | 0.0% |
| Guyana | 17 | 0.0% |
| Hong Kong | 151 | 0.4% |
| India | 962 | 2.2% |
| Indonesia | 41 | 0.1% |
| Iran | 270 | 0.6% |
| Ireland | 41 | 0.1% |
| Israel | 17 | 0.0% |
| Italy | 88 | 0.2% |
| Jamaica | 37 | 0.1% |
| Japan | 23 | 0.1% |
| Korea | 717 | 1.7% |
| Kuwait | 19 | 0.0% |
| Latin America | 715 | 1.7% |
| Latvia | 18 | 0.0% |
| Lebanon | 33 | 0.1% |
| Lithuania | 19 | 0.0% |
| Mexico | 249 | 0.6% |
| Micronesia | 15 | 0.0% |
| Netherlands | 28 | 0.1% |
| Northern Africa | 18 | 0.0% |
| Northern Europe | 653 | 1.5% |
| Oceania | 41 | 0.1% |
| Pakistan | 176 | 0.4% |
| Peru | 23 | 0.1% |
| Philippines | 725 | 1.7% |
| Poland | 304 | 0.7% |
| Portugal | 22 | 0.1% |
| Romania | 8 | 0.0% |
| Russia | 70 | 0.2% |
| Scotland | 53 | 0.1% |
| Singapore | 27 | 0.1% |
| South Africa | 24 | 0.1% |
| South America | 353 | 0.8% |
| South Central Asia | 1,425 | 3.3% |
| South Eastern Asia | 942 | 2.2% |
| Southern Europe | 110 | 0.3% |
| Sweden | 32 | 0.1% |
| Taiwan | 434 | 1.0% |
| Thailand | 11 | 0.0% |
| Turkey | 17 | 0.0% |
| Ukraine | 57 | 0.1% |
| Venezuela | 10 | 0.0% |
| Vietnam | 85 | 0.2% |
| Western Africa | 2 | 0.0% |
| Western Asia | 107 | 0.3% |
| Western Europe | 312 | 0.7% | View All 75 Rows |
Sex and Age in Danville
Sex and Age in Danville
The most populous age groups in Danville are 15 to 19 Years (2,293 | 10.5%) for men and 45 to 49 Years (2,101 | 9.7%) for women.
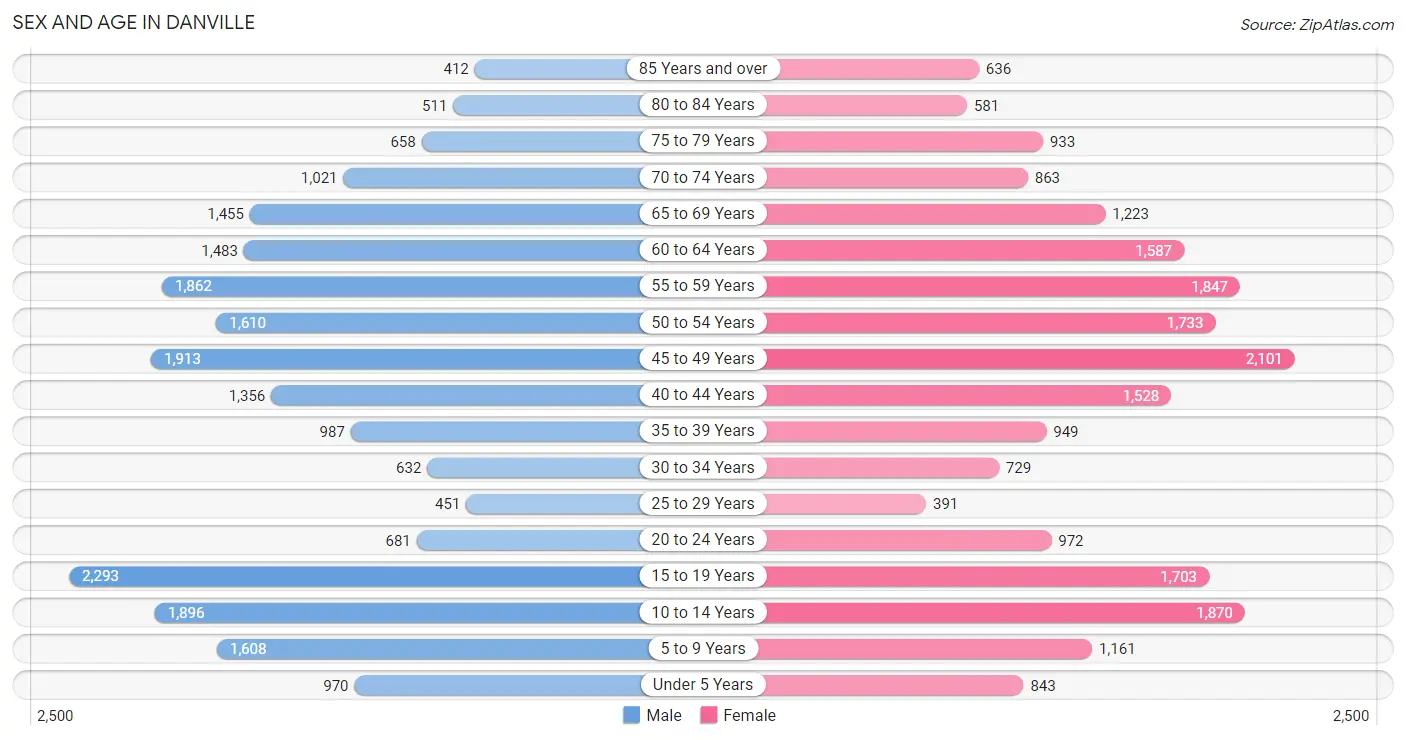
| Age Bracket | Male | Female |
| Under 5 Years | 970 (4.4%) | 843 (3.9%) |
| 5 to 9 Years | 1,608 (7.4%) | 1,161 (5.4%) |
| 10 to 14 Years | 1,896 (8.7%) | 1,870 (8.6%) |
| 15 to 19 Years | 2,293 (10.5%) | 1,703 (7.9%) |
| 20 to 24 Years | 681 (3.1%) | 972 (4.5%) |
| 25 to 29 Years | 451 (2.1%) | 391 (1.8%) |
| 30 to 34 Years | 632 (2.9%) | 729 (3.4%) |
| 35 to 39 Years | 987 (4.5%) | 949 (4.4%) |
| 40 to 44 Years | 1,356 (6.2%) | 1,528 (7.1%) |
| 45 to 49 Years | 1,913 (8.8%) | 2,101 (9.7%) |
| 50 to 54 Years | 1,610 (7.4%) | 1,733 (8.0%) |
| 55 to 59 Years | 1,862 (8.5%) | 1,847 (8.5%) |
| 60 to 64 Years | 1,483 (6.8%) | 1,587 (7.3%) |
| 65 to 69 Years | 1,455 (6.7%) | 1,223 (5.7%) |
| 70 to 74 Years | 1,021 (4.7%) | 863 (4.0%) |
| 75 to 79 Years | 658 (3.0%) | 933 (4.3%) |
| 80 to 84 Years | 511 (2.3%) | 581 (2.7%) |
| 85 Years and over | 412 (1.9%) | 636 (2.9%) |
| Total | 21,799 (100.0%) | 21,650 (100.0%) |
Families and Households in Danville
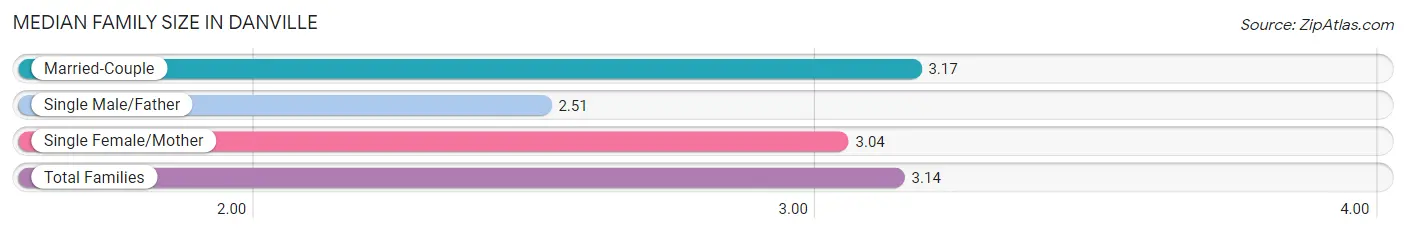
Median Family Size in Danville
The median family size in Danville is 3.14 persons per family, with married-couple families (10,578 | 86.8%) accounting for the largest median family size of 3.17 persons per family. On the other hand, single male/father families (330 | 2.7%) represent the smallest median family size with 2.51 persons per family.
| Family Type | # Families | Family Size |
| Married-Couple | 10,578 (86.8%) | 3.17 |
| Single Male/Father | 330 (2.7%) | 2.51 |
| Single Female/Mother | 1,277 (10.5%) | 3.04 |
| Total Families | 12,185 (100.0%) | 3.14 |
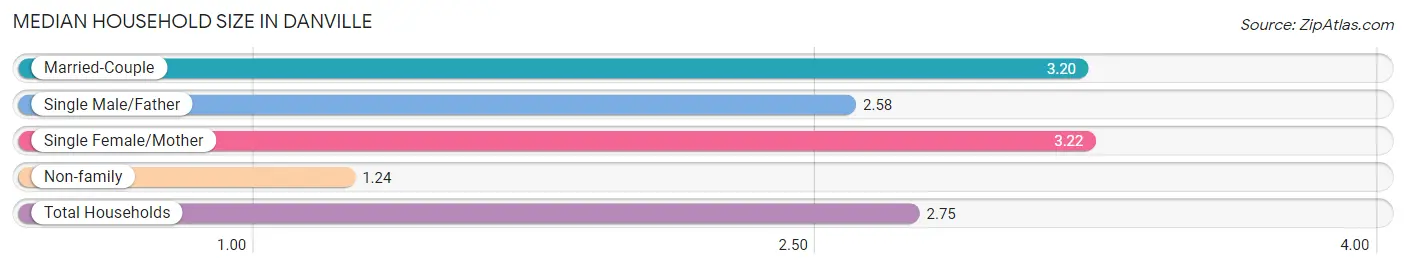
Median Household Size in Danville
The median household size in Danville is 2.75 persons per household, with single female/mother households (1,277 | 8.1%) accounting for the largest median household size of 3.22 persons per household. non-family households (3,541 | 22.5%) represent the smallest median household size with 1.24 persons per household.
| Household Type | # Households | Household Size |
| Married-Couple | 10,578 (67.3%) | 3.20 |
| Single Male/Father | 330 (2.1%) | 2.58 |
| Single Female/Mother | 1,277 (8.1%) | 3.22 |
| Non-family | 3,541 (22.5%) | 1.24 |
| Total Households | 15,726 (100.0%) | 2.75 |
Household Size by Marriage Status in Danville
Out of a total of 15,726 households in Danville, 12,185 (77.5%) are family households, while 3,541 (22.5%) are nonfamily households. The most numerous type of family households are 2-person households, comprising 5,070, and the most common type of nonfamily households are 1-person households, comprising 2,894.
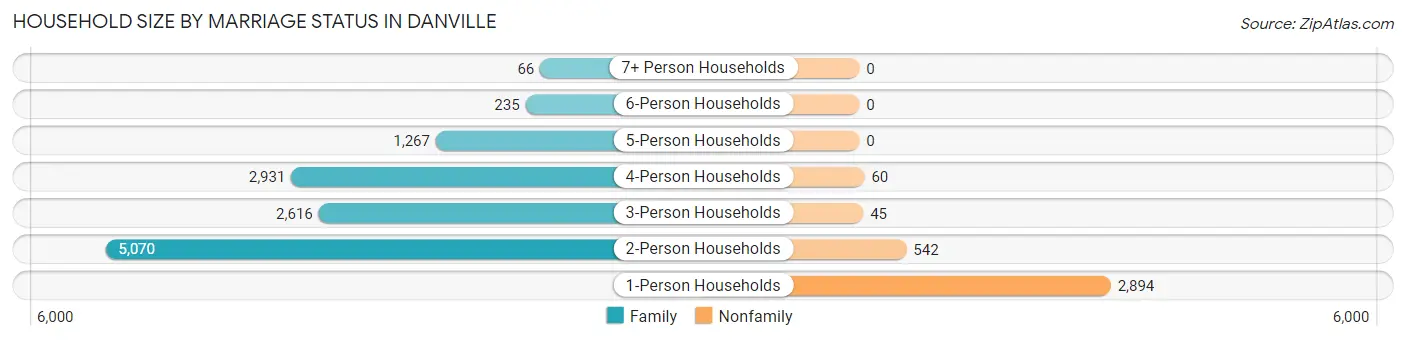
| Household Size | Family Households | Nonfamily Households |
| 1-Person Households | - | 2,894 (18.4%) |
| 2-Person Households | 5,070 (32.2%) | 542 (3.5%) |
| 3-Person Households | 2,616 (16.6%) | 45 (0.3%) |
| 4-Person Households | 2,931 (18.6%) | 60 (0.4%) |
| 5-Person Households | 1,267 (8.1%) | 0 (0.0%) |
| 6-Person Households | 235 (1.5%) | 0 (0.0%) |
| 7+ Person Households | 66 (0.4%) | 0 (0.0%) |
| Total | 12,185 (77.5%) | 3,541 (22.5%) |
Female Fertility in Danville
Fertility by Age in Danville
Average fertility rate in Danville is 34.0 births per 1,000 women. Women in the age bracket of 35 to 50 years have the highest fertility rate with 45.0 births per 1,000 women. Women in the age bracket of 35 to 50 years acount for 74.4% of all women with births.
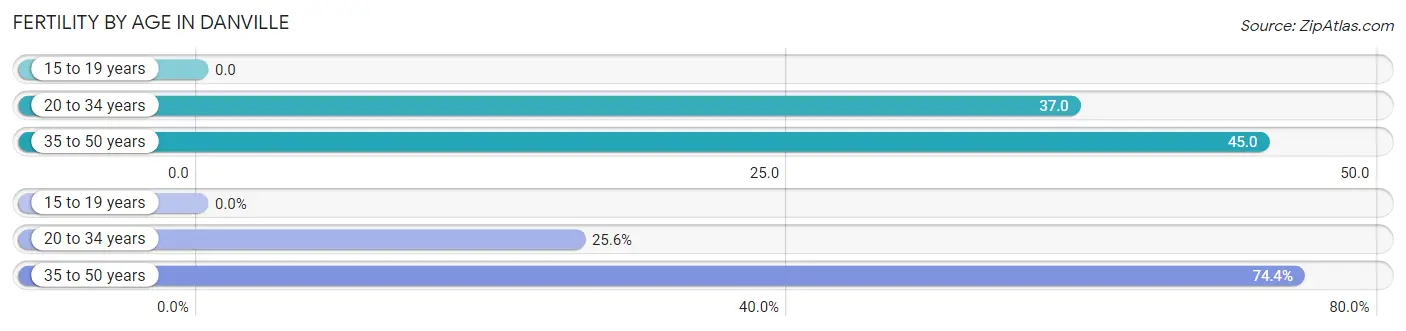
| Age Bracket | Women with Births | Births / 1,000 Women |
| 15 to 19 years | 0 (0.0%) | 0.0 |
| 20 to 34 years | 77 (25.6%) | 37.0 |
| 35 to 50 years | 224 (74.4%) | 45.0 |
| Total | 301 (100.0%) | 34.0 |
Fertility by Age by Marriage Status in Danville
97.0% of women with births (301) in Danville are married. The highest percentage of unmarried women with births falls into 35 to 50 years age bracket with 4.0% of them unmarried at the time of birth, while the lowest percentage of unmarried women with births belong to 20 to 34 years age bracket with 0.0% of them unmarried.
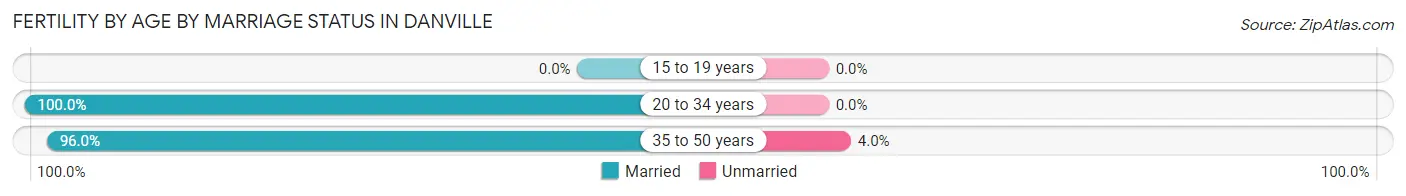
| Age Bracket | Married | Unmarried |
| 15 to 19 years | 0 (0.0%) | 0 (0.0%) |
| 20 to 34 years | 77 (100.0%) | 0 (0.0%) |
| 35 to 50 years | 215 (96.0%) | 9 (4.0%) |
| Total | 292 (97.0%) | 9 (3.0%) |
Fertility by Education in Danville
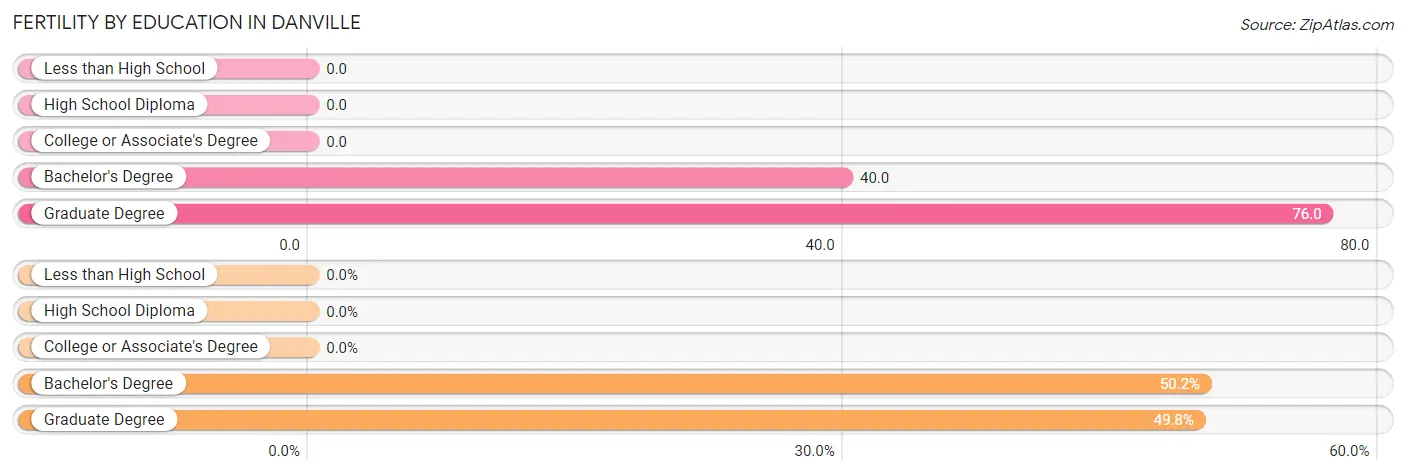
| Educational Attainment | Women with Births | Births / 1,000 Women |
| Less than High School | 0 (0.0%) | 0.0 |
| High School Diploma | 0 (0.0%) | 0.0 |
| College or Associate's Degree | 0 (0.0%) | 0.0 |
| Bachelor's Degree | 151 (50.2%) | 40.0 |
| Graduate Degree | 150 (49.8%) | 76.0 |
| Total | 301 (100.0%) | 34.0 |
Fertility by Education by Marriage Status in Danville
3.0% of women with births in Danville are unmarried. Women with the educational attainment of graduate degree are most likely to be married with 100.0% of them married at childbirth, while women with the educational attainment of bachelor's degree are least likely to be married with 6.0% of them unmarried at childbirth.
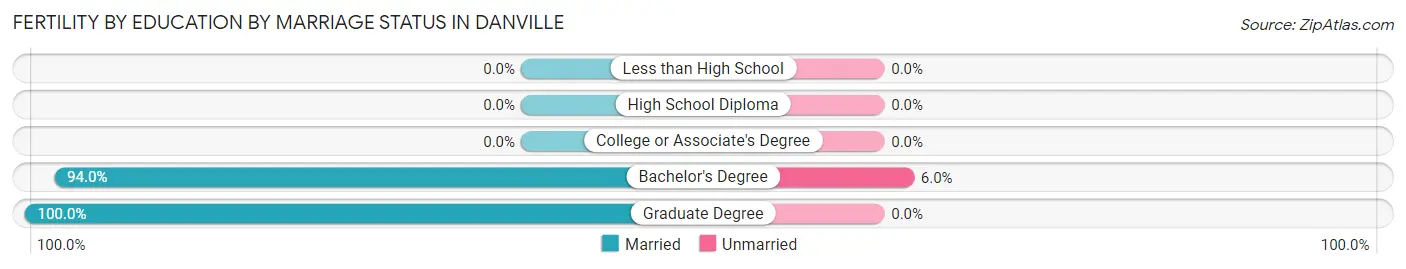
| Educational Attainment | Married | Unmarried |
| Less than High School | 0 (0.0%) | 0 (0.0%) |
| High School Diploma | 0 (0.0%) | 0 (0.0%) |
| College or Associate's Degree | 0 (0.0%) | 0 (0.0%) |
| Bachelor's Degree | 142 (94.0%) | 9 (6.0%) |
| Graduate Degree | 150 (100.0%) | 0 (0.0%) |
| Total | 292 (97.0%) | 9 (3.0%) |
Employment Characteristics in Danville
Employment by Class of Employer in Danville
Among the 20,074 employed individuals in Danville, private company employees (13,133 | 65.4%), self-employed (not incorporated) (1,867 | 9.3%), and self-employed (incorporated) (1,732 | 8.6%) make up the most common classes of employment.
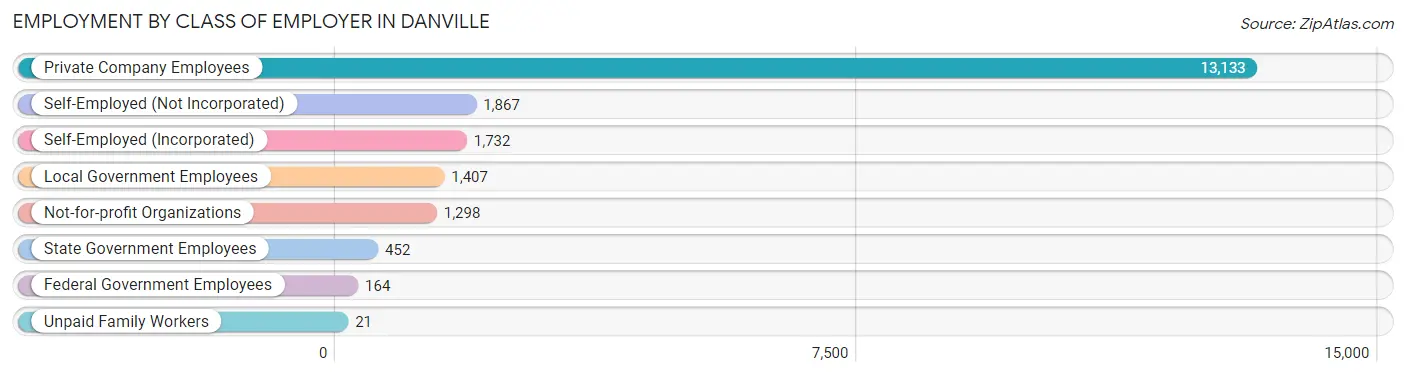
| Employer Class | # Employees | % Employees |
| Private Company Employees | 13,133 | 65.4% |
| Self-Employed (Incorporated) | 1,732 | 8.6% |
| Self-Employed (Not Incorporated) | 1,867 | 9.3% |
| Not-for-profit Organizations | 1,298 | 6.5% |
| Local Government Employees | 1,407 | 7.0% |
| State Government Employees | 452 | 2.2% |
| Federal Government Employees | 164 | 0.8% |
| Unpaid Family Workers | 21 | 0.1% |
| Total | 20,074 | 100.0% |
Employment Status by Age in Danville
According to the labor force statistics for Danville, out of the total population over 16 years of age (34,058), 63.4% or 21,593 individuals are in the labor force, with 4.4% or 950 of them unemployed. The age group with the highest labor force participation rate is 25 to 29 years, with 91.7% or 772 individuals in the labor force. Within the labor force, the 20 to 24 years age range has the highest percentage of unemployed individuals, with 20.4% or 195 of them being unemployed.
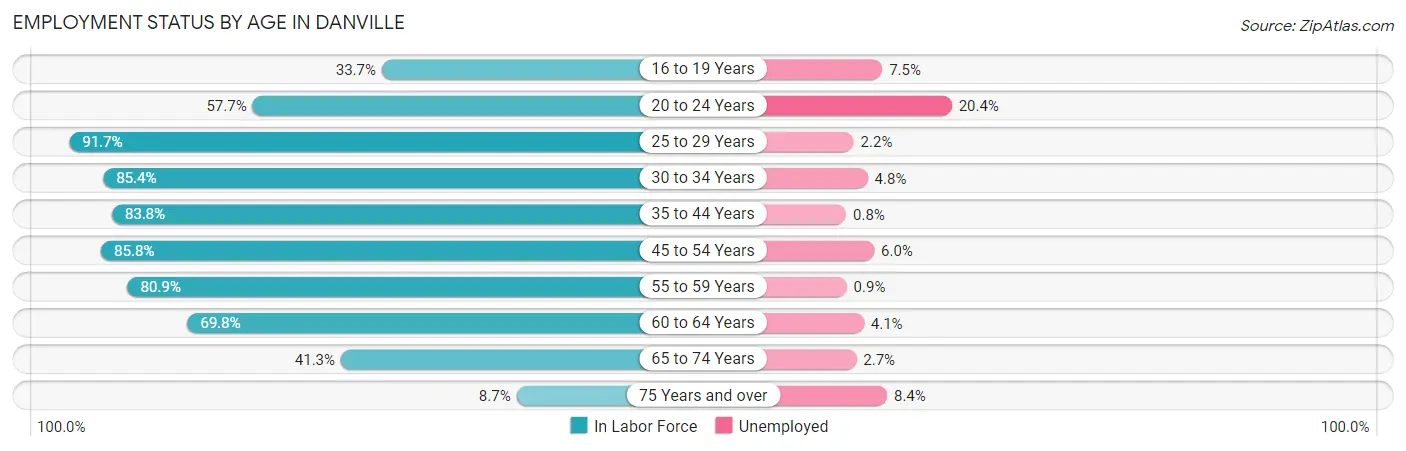
| Age Bracket | In Labor Force | Unemployed |
| 16 to 19 Years | 995 (33.7%) | 75 (7.5%) |
| 20 to 24 Years | 954 (57.7%) | 195 (20.4%) |
| 25 to 29 Years | 772 (91.7%) | 17 (2.2%) |
| 30 to 34 Years | 1,162 (85.4%) | 56 (4.8%) |
| 35 to 44 Years | 4,039 (83.8%) | 32 (0.8%) |
| 45 to 54 Years | 6,312 (85.8%) | 379 (6.0%) |
| 55 to 59 Years | 3,001 (80.9%) | 27 (0.9%) |
| 60 to 64 Years | 2,143 (69.8%) | 88 (4.1%) |
| 65 to 74 Years | 1,884 (41.3%) | 51 (2.7%) |
| 75 Years and over | 325 (8.7%) | 27 (8.4%) |
| Total | 21,593 (63.4%) | 950 (4.4%) |
Employment Status by Educational Attainment in Danville
According to labor force statistics for Danville, 82.4% of individuals (17,435) out of the total population between 25 and 64 years of age (21,159) are in the labor force, with 3.5% or 610 of them being unemployed. The group with the highest labor force participation rate are those with the educational attainment of bachelor's degree or higher, with 84.0% or 13,797 individuals in the labor force. Within the labor force, individuals with bachelor's degree or higher education have the highest percentage of unemployment, with 3.8% or 524 of them being unemployed.
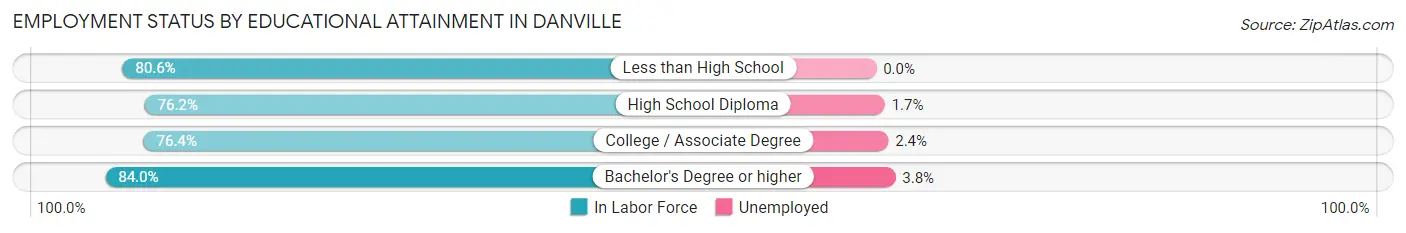
| Educational Attainment | In Labor Force | Unemployed |
| Less than High School | 229 (80.6%) | 0 (0.0%) |
| High School Diploma | 864 (76.2%) | 19 (1.7%) |
| College / Associate Degree | 2,533 (76.4%) | 80 (2.4%) |
| Bachelor's Degree or higher | 13,797 (84.0%) | 624 (3.8%) |
| Total | 17,435 (82.4%) | 741 (3.5%) |
Employment Occupations by Sex in Danville
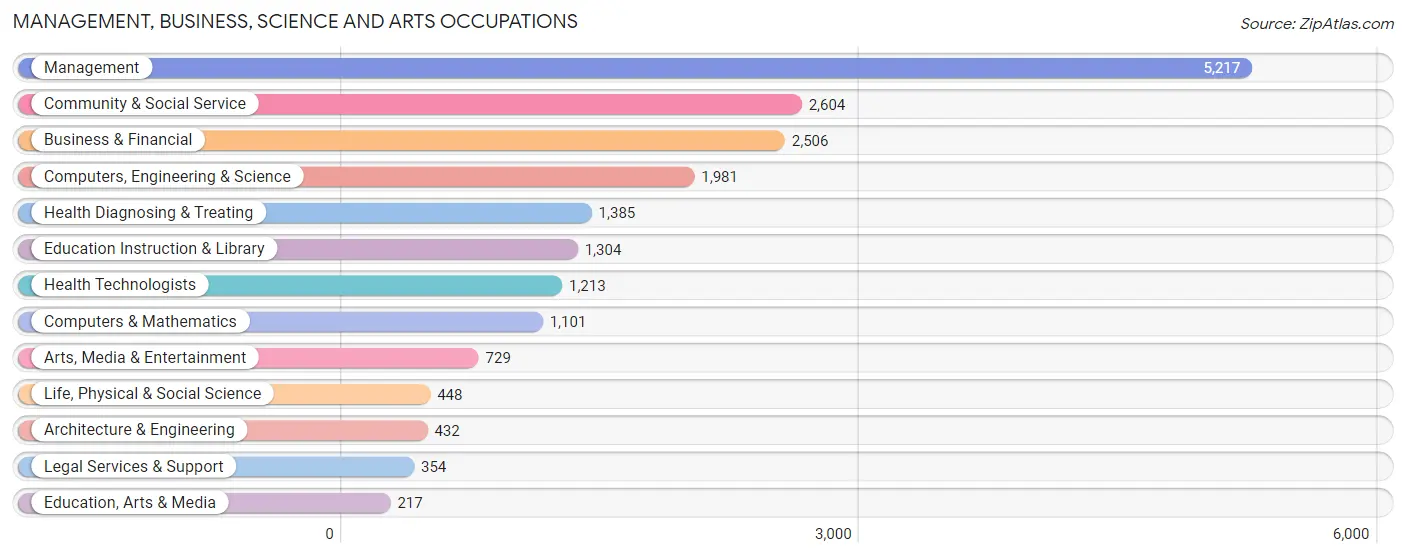
Management, Business, Science and Arts Occupations
The most common Management, Business, Science and Arts occupations in Danville are Management (5,217 | 25.3%), Community & Social Service (2,604 | 12.6%), Business & Financial (2,506 | 12.1%), Computers, Engineering & Science (1,981 | 9.6%), and Health Diagnosing & Treating (1,385 | 6.7%).
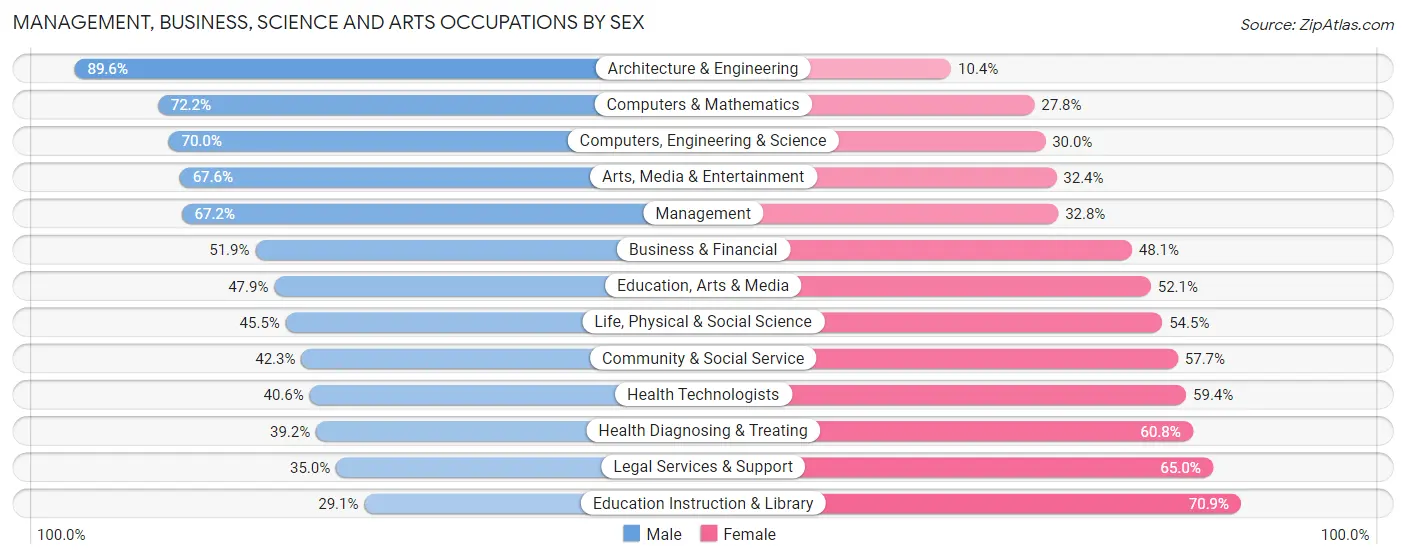
Management, Business, Science and Arts Occupations by Sex
Within the Management, Business, Science and Arts occupations in Danville, the most male-oriented occupations are Architecture & Engineering (89.6%), Computers & Mathematics (72.2%), and Computers, Engineering & Science (70.0%), while the most female-oriented occupations are Education Instruction & Library (70.9%), Legal Services & Support (65.0%), and Health Diagnosing & Treating (60.8%).
| Occupation | Male | Female |
| Management | 3,508 (67.2%) | 1,709 (32.8%) |
| Business & Financial | 1,300 (51.9%) | 1,206 (48.1%) |
| Computers, Engineering & Science | 1,386 (70.0%) | 595 (30.0%) |
| Computers & Mathematics | 795 (72.2%) | 306 (27.8%) |
| Architecture & Engineering | 387 (89.6%) | 45 (10.4%) |
| Life, Physical & Social Science | 204 (45.5%) | 244 (54.5%) |
| Community & Social Service | 1,101 (42.3%) | 1,503 (57.7%) |
| Education, Arts & Media | 104 (47.9%) | 113 (52.1%) |
| Legal Services & Support | 124 (35.0%) | 230 (65.0%) |
| Education Instruction & Library | 380 (29.1%) | 924 (70.9%) |
| Arts, Media & Entertainment | 493 (67.6%) | 236 (32.4%) |
| Health Diagnosing & Treating | 543 (39.2%) | 842 (60.8%) |
| Health Technologists | 492 (40.6%) | 721 (59.4%) |
| Total (Category) | 7,838 (57.2%) | 5,855 (42.8%) |
| Total (Overall) | 11,508 (55.8%) | 9,126 (44.2%) |
Services Occupations
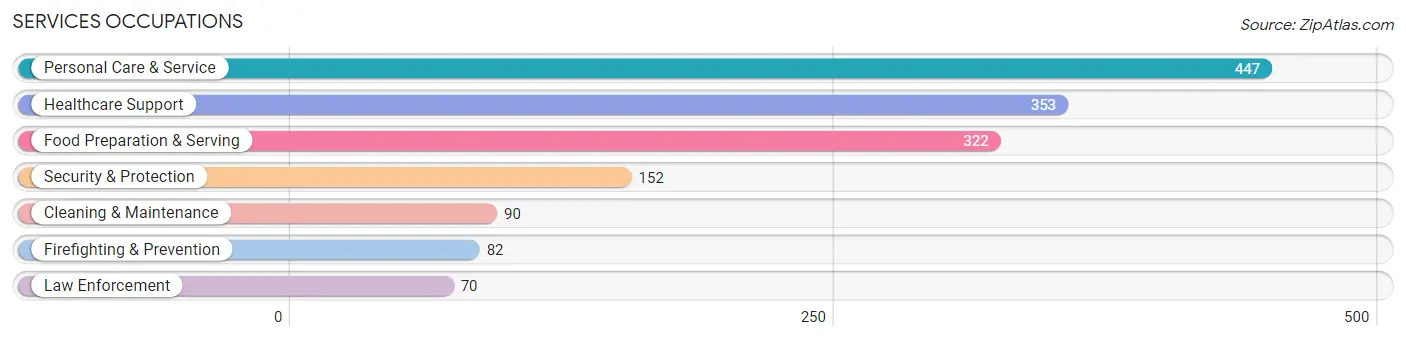
The most common Services occupations in Danville are Personal Care & Service (447 | 2.2%), Healthcare Support (353 | 1.7%), Food Preparation & Serving (322 | 1.6%), Security & Protection (152 | 0.7%), and Cleaning & Maintenance (90 | 0.4%).
Services Occupations by Sex
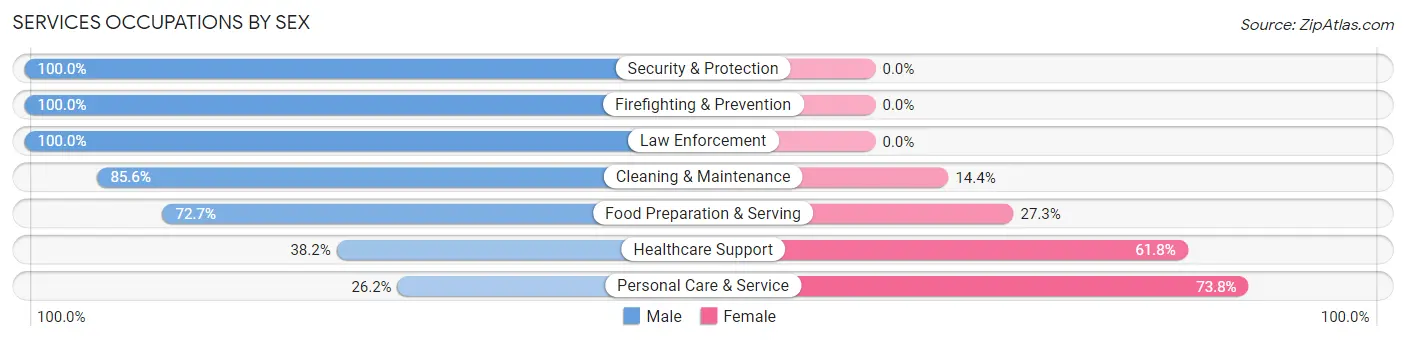
Within the Services occupations in Danville, the most male-oriented occupations are Security & Protection (100.0%), Firefighting & Prevention (100.0%), and Law Enforcement (100.0%), while the most female-oriented occupations are Personal Care & Service (73.8%), Healthcare Support (61.8%), and Food Preparation & Serving (27.3%).
| Occupation | Male | Female |
| Healthcare Support | 135 (38.2%) | 218 (61.8%) |
| Security & Protection | 152 (100.0%) | 0 (0.0%) |
| Firefighting & Prevention | 82 (100.0%) | 0 (0.0%) |
| Law Enforcement | 70 (100.0%) | 0 (0.0%) |
| Food Preparation & Serving | 234 (72.7%) | 88 (27.3%) |
| Cleaning & Maintenance | 77 (85.6%) | 13 (14.4%) |
| Personal Care & Service | 117 (26.2%) | 330 (73.8%) |
| Total (Category) | 715 (52.4%) | 649 (47.6%) |
| Total (Overall) | 11,508 (55.8%) | 9,126 (44.2%) |
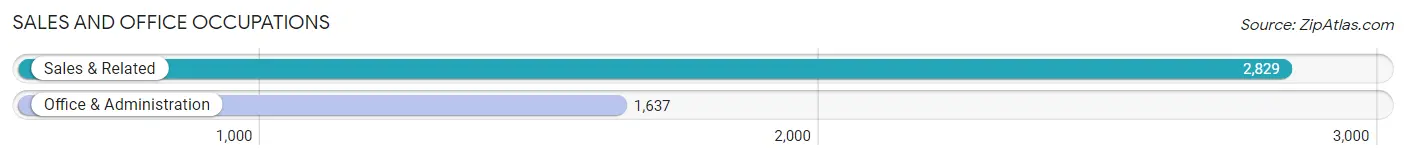
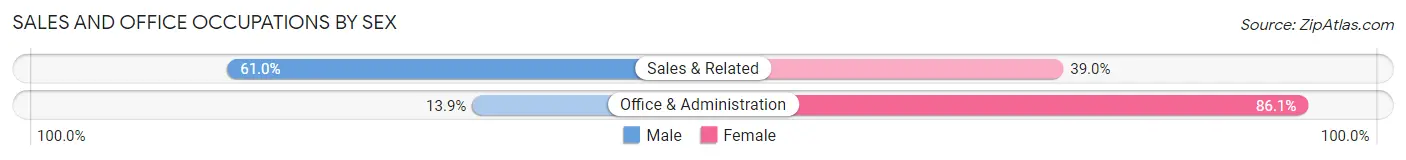
Sales and Office Occupations
The most common Sales and Office occupations in Danville are Sales & Related (2,829 | 13.7%), and Office & Administration (1,637 | 7.9%).
Sales and Office Occupations by Sex
| Occupation | Male | Female |
| Sales & Related | 1,726 (61.0%) | 1,103 (39.0%) |
| Office & Administration | 228 (13.9%) | 1,409 (86.1%) |
| Total (Category) | 1,954 (43.8%) | 2,512 (56.2%) |
| Total (Overall) | 11,508 (55.8%) | 9,126 (44.2%) |
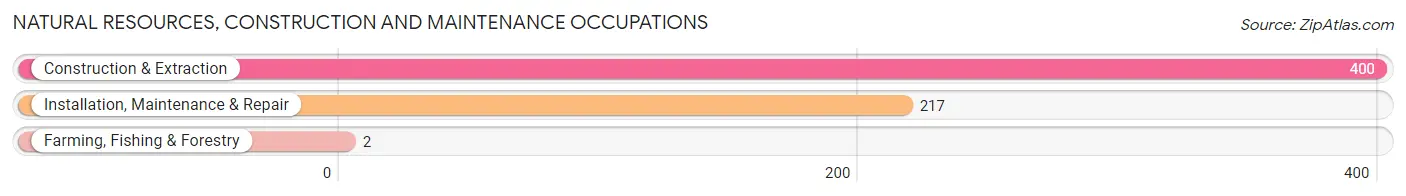
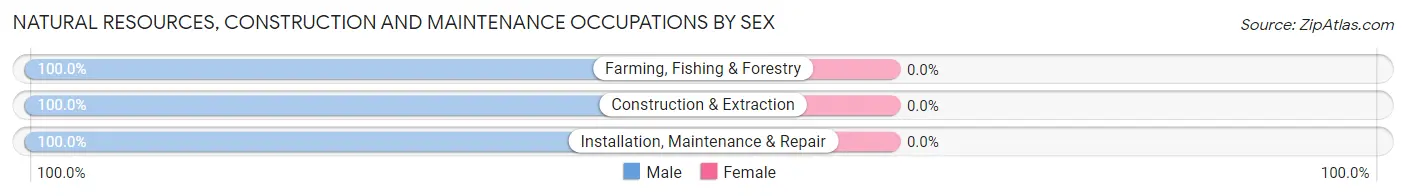
Natural Resources, Construction and Maintenance Occupations
The most common Natural Resources, Construction and Maintenance occupations in Danville are Construction & Extraction (400 | 1.9%), Installation, Maintenance & Repair (217 | 1.1%), and Farming, Fishing & Forestry (2 | 0.0%).
Natural Resources, Construction and Maintenance Occupations by Sex
| Occupation | Male | Female |
| Farming, Fishing & Forestry | 2 (100.0%) | 0 (0.0%) |
| Construction & Extraction | 400 (100.0%) | 0 (0.0%) |
| Installation, Maintenance & Repair | 217 (100.0%) | 0 (0.0%) |
| Total (Category) | 619 (100.0%) | 0 (0.0%) |
| Total (Overall) | 11,508 (55.8%) | 9,126 (44.2%) |
Production, Transportation and Moving Occupations
The most common Production, Transportation and Moving occupations in Danville are Material Moving (253 | 1.2%), Production (172 | 0.8%), and Transportation (67 | 0.3%).
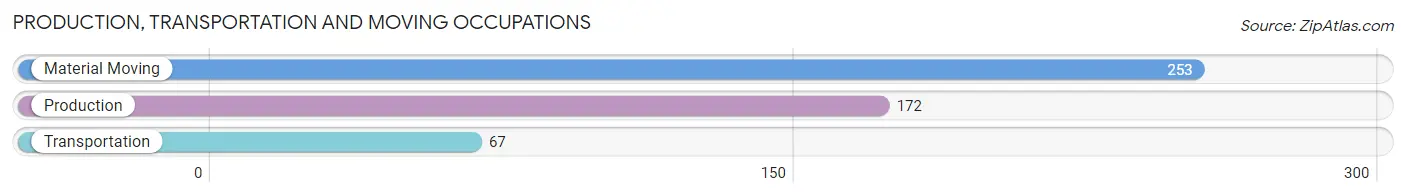
Production, Transportation and Moving Occupations by Sex
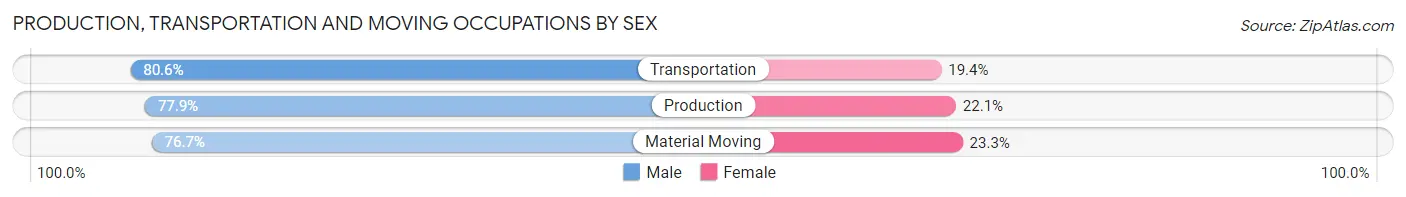
| Occupation | Male | Female |
| Production | 134 (77.9%) | 38 (22.1%) |
| Transportation | 54 (80.6%) | 13 (19.4%) |
| Material Moving | 194 (76.7%) | 59 (23.3%) |
| Total (Category) | 382 (77.6%) | 110 (22.4%) |
| Total (Overall) | 11,508 (55.8%) | 9,126 (44.2%) |
Employment Industries by Sex in Danville
Employment Industries in Danville
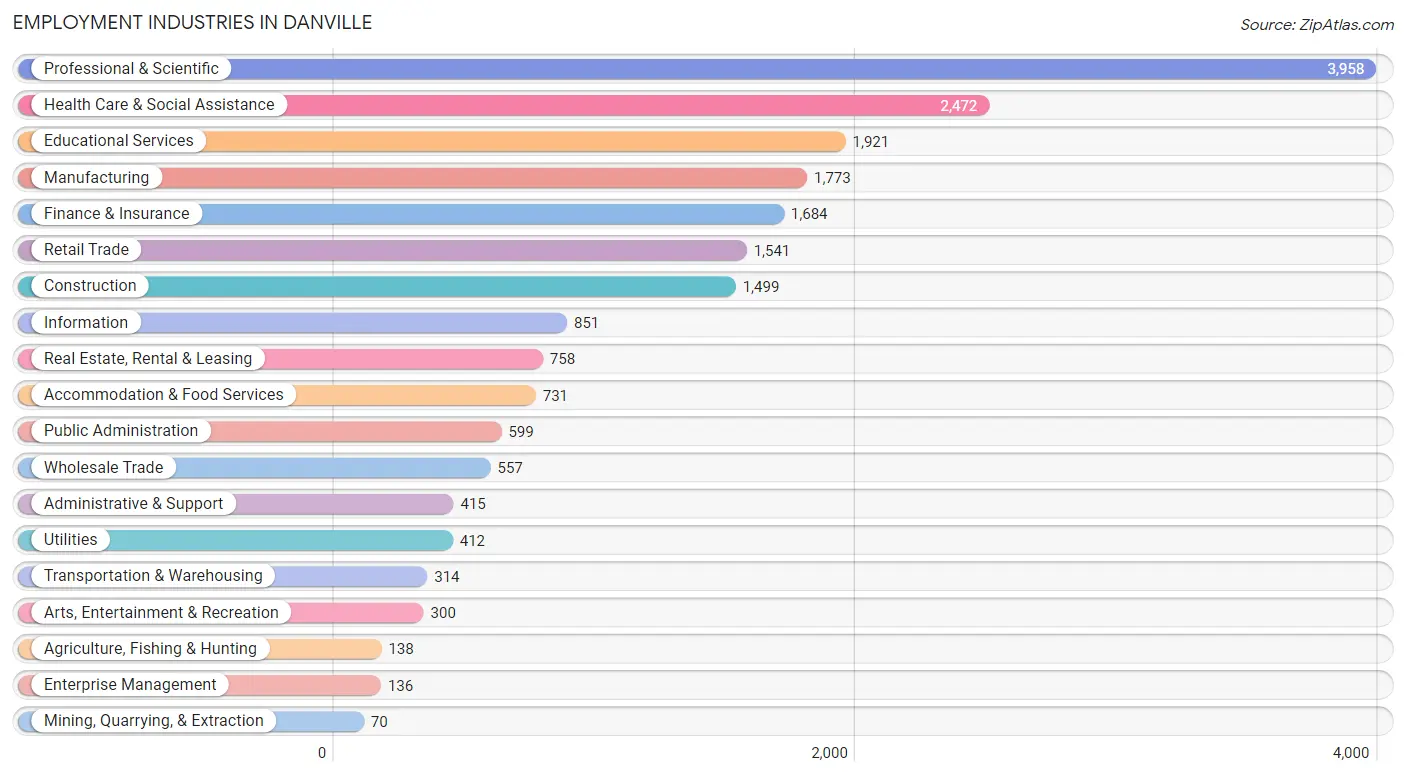
The major employment industries in Danville include Professional & Scientific (3,958 | 19.2%), Health Care & Social Assistance (2,472 | 12.0%), Educational Services (1,921 | 9.3%), Manufacturing (1,773 | 8.6%), and Finance & Insurance (1,684 | 8.2%).
Employment Industries by Sex in Danville
The Danville industries that see more men than women are Mining, Quarrying, & Extraction (100.0%), Construction (88.6%), and Agriculture, Fishing & Hunting (85.5%), whereas the industries that tend to have a higher number of women are Educational Services (68.9%), Health Care & Social Assistance (65.2%), and Administrative & Support (57.6%).
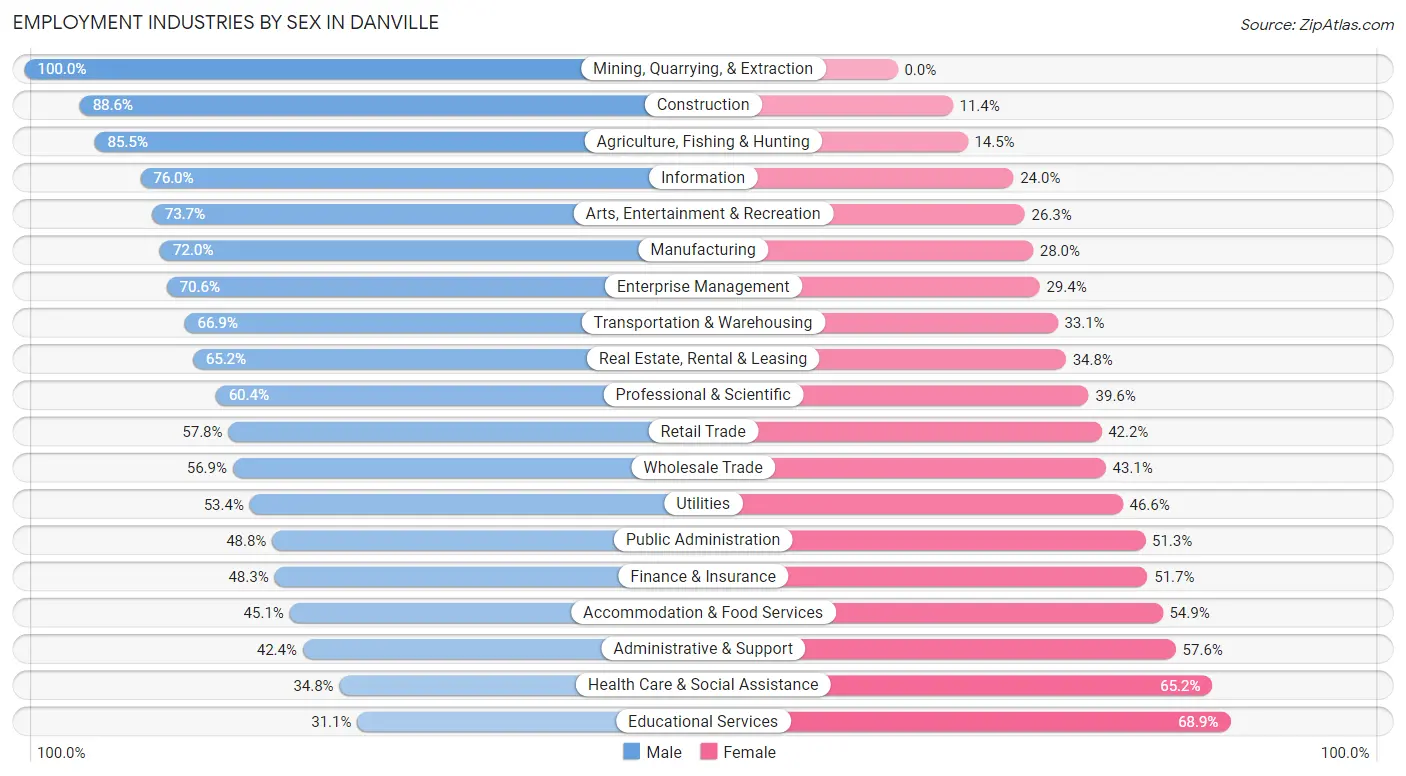
| Industry | Male | Female |
| Agriculture, Fishing & Hunting | 118 (85.5%) | 20 (14.5%) |
| Mining, Quarrying, & Extraction | 70 (100.0%) | 0 (0.0%) |
| Construction | 1,328 (88.6%) | 171 (11.4%) |
| Manufacturing | 1,276 (72.0%) | 497 (28.0%) |
| Wholesale Trade | 317 (56.9%) | 240 (43.1%) |
| Retail Trade | 891 (57.8%) | 650 (42.2%) |
| Transportation & Warehousing | 210 (66.9%) | 104 (33.1%) |
| Utilities | 220 (53.4%) | 192 (46.6%) |
| Information | 647 (76.0%) | 204 (24.0%) |
| Finance & Insurance | 813 (48.3%) | 871 (51.7%) |
| Real Estate, Rental & Leasing | 494 (65.2%) | 264 (34.8%) |
| Professional & Scientific | 2,392 (60.4%) | 1,566 (39.6%) |
| Enterprise Management | 96 (70.6%) | 40 (29.4%) |
| Administrative & Support | 176 (42.4%) | 239 (57.6%) |
| Educational Services | 598 (31.1%) | 1,323 (68.9%) |
| Health Care & Social Assistance | 861 (34.8%) | 1,611 (65.2%) |
| Arts, Entertainment & Recreation | 221 (73.7%) | 79 (26.3%) |
| Accommodation & Food Services | 330 (45.1%) | 401 (54.9%) |
| Public Administration | 292 (48.7%) | 307 (51.2%) |
| Total | 11,508 (55.8%) | 9,126 (44.2%) |
Education in Danville
School Enrollment in Danville
The most common levels of schooling among the 12,736 students in Danville are high school (3,672 | 28.8%), middle school (2,935 | 23.0%), and elementary school (2,295 | 18.0%).
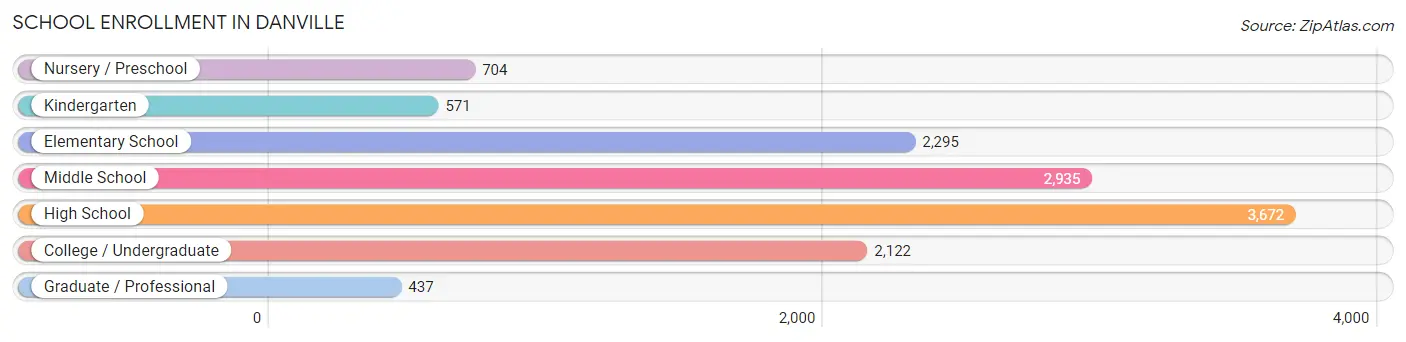
| School Level | # Students | % Students |
| Nursery / Preschool | 704 | 5.5% |
| Kindergarten | 571 | 4.5% |
| Elementary School | 2,295 | 18.0% |
| Middle School | 2,935 | 23.0% |
| High School | 3,672 | 28.8% |
| College / Undergraduate | 2,122 | 16.7% |
| Graduate / Professional | 437 | 3.4% |
| Total | 12,736 | 100.0% |
School Enrollment by Age by Funding Source in Danville
Out of a total of 12,736 students who are enrolled in schools in Danville, 2,305 (18.1%) attend a private institution, while the remaining 10,431 (81.9%) are enrolled in public schools. The age group of 3 to 4 year olds has the highest likelihood of being enrolled in private schools, with 409 (85.9% in the age bracket) enrolled. Conversely, the age group of 18 to 19 year olds has the lowest likelihood of being enrolled in a private school, with 1,150 (90.2% in the age bracket) attending a public institution.
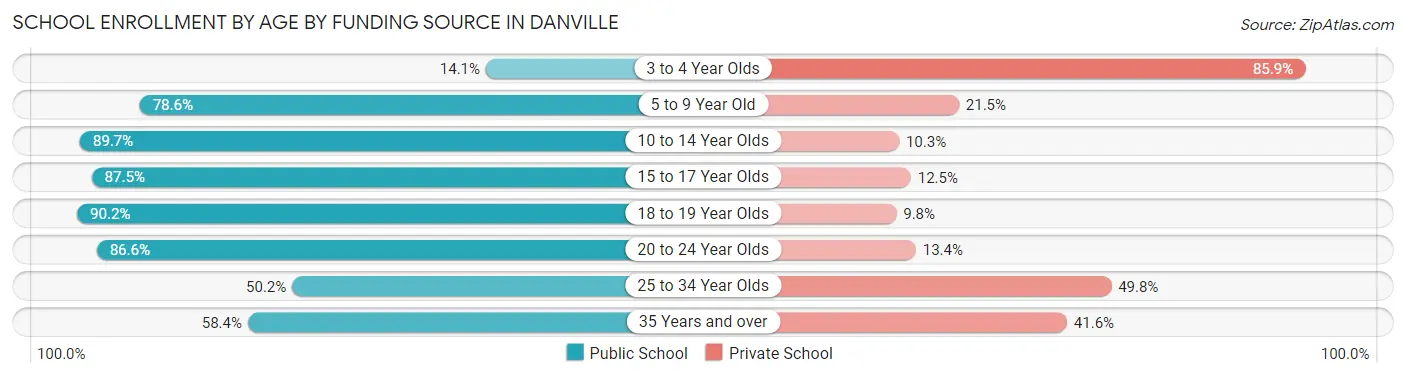
| Age Bracket | Public School | Private School |
| 3 to 4 Year Olds | 67 (14.1%) | 409 (85.9%) |
| 5 to 9 Year Old | 2,113 (78.5%) | 577 (21.4%) |
| 10 to 14 Year Olds | 3,378 (89.7%) | 388 (10.3%) |
| 15 to 17 Year Olds | 2,346 (87.5%) | 335 (12.5%) |
| 18 to 19 Year Olds | 1,150 (90.2%) | 125 (9.8%) |
| 20 to 24 Year Olds | 998 (86.6%) | 155 (13.4%) |
| 25 to 34 Year Olds | 152 (50.2%) | 151 (49.8%) |
| 35 Years and over | 229 (58.4%) | 163 (41.6%) |
| Total | 10,431 (81.9%) | 2,305 (18.1%) |
Educational Attainment by Field of Study in Danville
Business (5,252 | 22.7%), engineering (2,850 | 12.3%), social sciences (2,607 | 11.3%), science & technology (1,894 | 8.2%), and bio, nature & agricultural (1,540 | 6.7%) are the most common fields of study among 23,102 individuals in Danville who have obtained a bachelor's degree or higher.
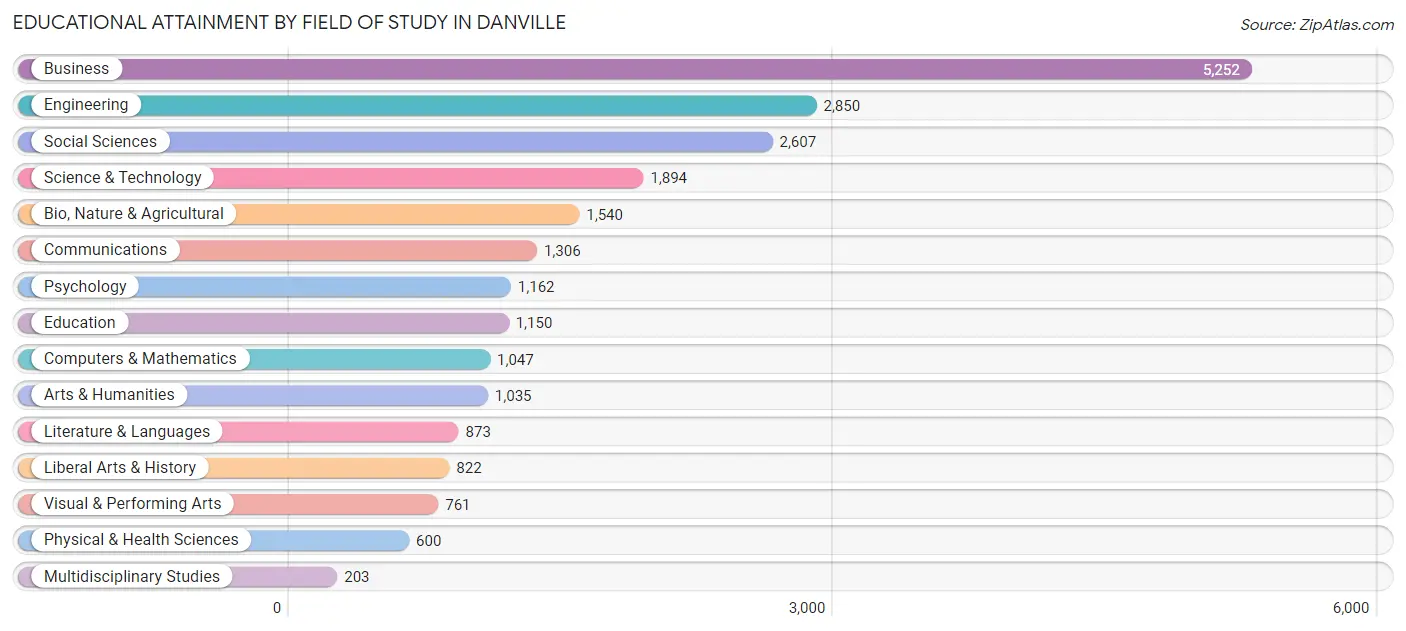
| Field of Study | # Graduates | % Graduates |
| Computers & Mathematics | 1,047 | 4.5% |
| Bio, Nature & Agricultural | 1,540 | 6.7% |
| Physical & Health Sciences | 600 | 2.6% |
| Psychology | 1,162 | 5.0% |
| Social Sciences | 2,607 | 11.3% |
| Engineering | 2,850 | 12.3% |
| Multidisciplinary Studies | 203 | 0.9% |
| Science & Technology | 1,894 | 8.2% |
| Business | 5,252 | 22.7% |
| Education | 1,150 | 5.0% |
| Literature & Languages | 873 | 3.8% |
| Liberal Arts & History | 822 | 3.6% |
| Visual & Performing Arts | 761 | 3.3% |
| Communications | 1,306 | 5.7% |
| Arts & Humanities | 1,035 | 4.5% |
| Total | 23,102 | 100.0% |
Transportation & Commute in Danville
Vehicle Availability by Sex in Danville
The most prevalent vehicle ownership categories in Danville are males with 2 vehicles (5,109, accounting for 45.6%) and females with 2 vehicles (3,903, making up 57.7%).
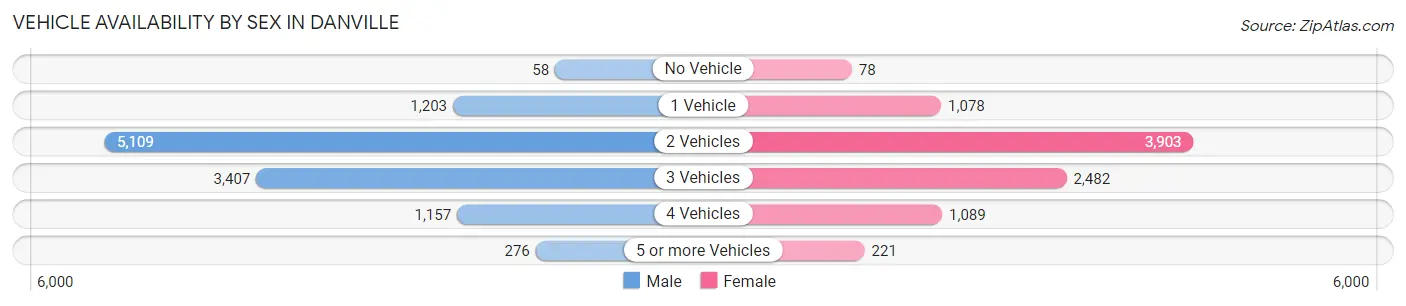
| Vehicles Available | Male | Female |
| No Vehicle | 58 (0.5%) | 78 (0.9%) |
| 1 Vehicle | 1,203 (10.7%) | 1,078 (12.2%) |
| 2 Vehicles | 5,109 (45.6%) | 3,903 (44.1%) |
| 3 Vehicles | 3,407 (30.4%) | 2,482 (28.0%) |
| 4 Vehicles | 1,157 (10.3%) | 1,089 (12.3%) |
| 5 or more Vehicles | 276 (2.5%) | 221 (2.5%) |
| Total | 11,210 (100.0%) | 8,851 (100.0%) |
Commute Time in Danville
The most frequently occuring commute durations in Danville are 15 to 19 minutes (2,011 commuters, 14.4%), 20 to 24 minutes (1,667 commuters, 12.0%), and 45 to 59 minutes (1,647 commuters, 11.8%).
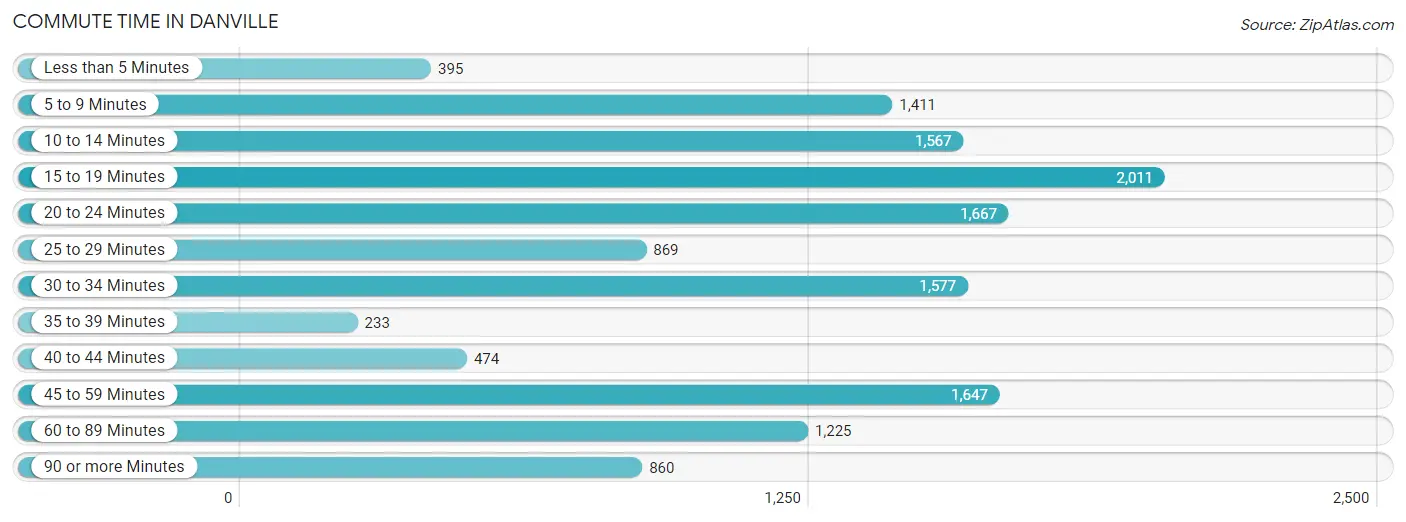
| Commute Time | # Commuters | % Commuters |
| Less than 5 Minutes | 395 | 2.8% |
| 5 to 9 Minutes | 1,411 | 10.1% |
| 10 to 14 Minutes | 1,567 | 11.2% |
| 15 to 19 Minutes | 2,011 | 14.4% |
| 20 to 24 Minutes | 1,667 | 12.0% |
| 25 to 29 Minutes | 869 | 6.2% |
| 30 to 34 Minutes | 1,577 | 11.3% |
| 35 to 39 Minutes | 233 | 1.7% |
| 40 to 44 Minutes | 474 | 3.4% |
| 45 to 59 Minutes | 1,647 | 11.8% |
| 60 to 89 Minutes | 1,225 | 8.8% |
| 90 or more Minutes | 860 | 6.2% |
Commute Time by Sex in Danville
The most common commute times in Danville are 45 to 59 minutes (1,190 commuters, 14.9%) for males and 15 to 19 minutes (1,117 commuters, 18.8%) for females.
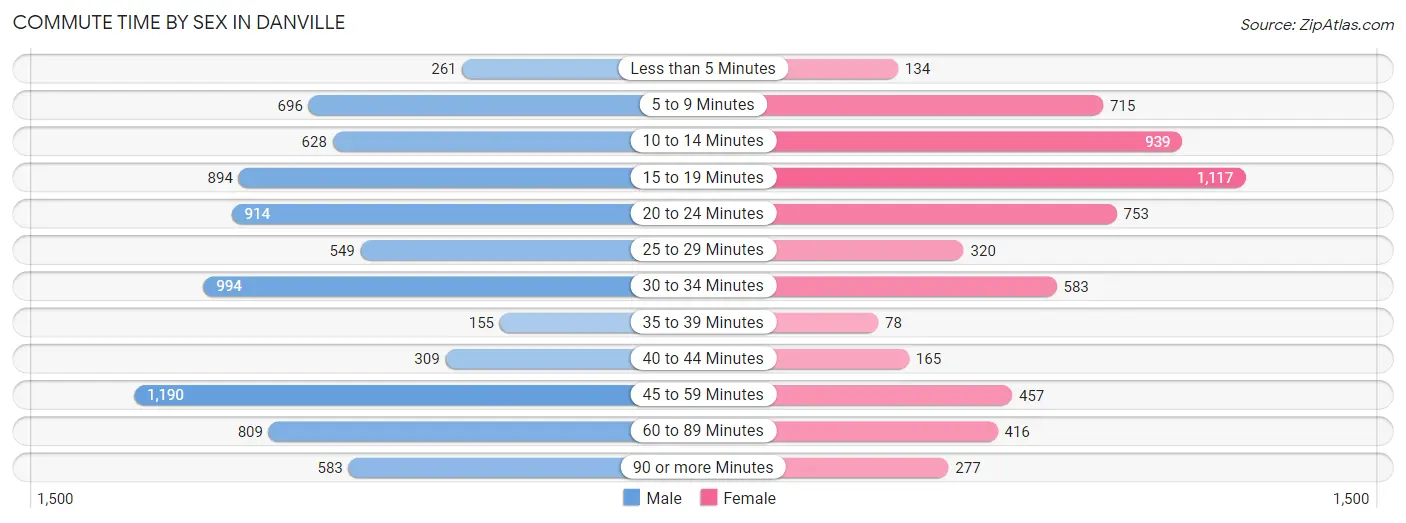
| Commute Time | Male | Female |
| Less than 5 Minutes | 261 (3.3%) | 134 (2.2%) |
| 5 to 9 Minutes | 696 (8.7%) | 715 (12.0%) |
| 10 to 14 Minutes | 628 (7.9%) | 939 (15.8%) |
| 15 to 19 Minutes | 894 (11.2%) | 1,117 (18.8%) |
| 20 to 24 Minutes | 914 (11.5%) | 753 (12.7%) |
| 25 to 29 Minutes | 549 (6.9%) | 320 (5.4%) |
| 30 to 34 Minutes | 994 (12.4%) | 583 (9.8%) |
| 35 to 39 Minutes | 155 (1.9%) | 78 (1.3%) |
| 40 to 44 Minutes | 309 (3.9%) | 165 (2.8%) |
| 45 to 59 Minutes | 1,190 (14.9%) | 457 (7.7%) |
| 60 to 89 Minutes | 809 (10.1%) | 416 (7.0%) |
| 90 or more Minutes | 583 (7.3%) | 277 (4.6%) |
Time of Departure to Work by Sex in Danville
The most frequent times of departure to work in Danville are 8:00 AM to 8:29 AM (1,260, 15.8%) for males and 8:00 AM to 8:29 AM (1,106, 18.6%) for females.
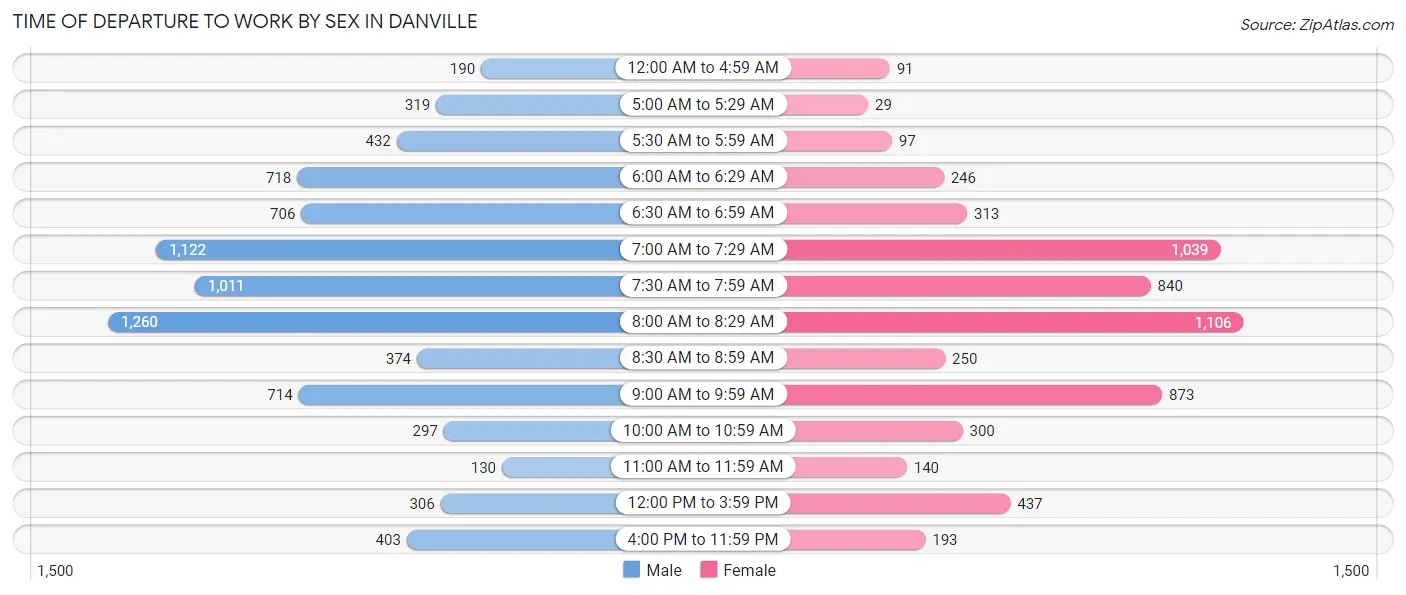
| Time of Departure | Male | Female |
| 12:00 AM to 4:59 AM | 190 (2.4%) | 91 (1.5%) |
| 5:00 AM to 5:29 AM | 319 (4.0%) | 29 (0.5%) |
| 5:30 AM to 5:59 AM | 432 (5.4%) | 97 (1.6%) |
| 6:00 AM to 6:29 AM | 718 (9.0%) | 246 (4.1%) |
| 6:30 AM to 6:59 AM | 706 (8.8%) | 313 (5.3%) |
| 7:00 AM to 7:29 AM | 1,122 (14.1%) | 1,039 (17.4%) |
| 7:30 AM to 7:59 AM | 1,011 (12.7%) | 840 (14.1%) |
| 8:00 AM to 8:29 AM | 1,260 (15.8%) | 1,106 (18.6%) |
| 8:30 AM to 8:59 AM | 374 (4.7%) | 250 (4.2%) |
| 9:00 AM to 9:59 AM | 714 (8.9%) | 873 (14.7%) |
| 10:00 AM to 10:59 AM | 297 (3.7%) | 300 (5.0%) |
| 11:00 AM to 11:59 AM | 130 (1.6%) | 140 (2.4%) |
| 12:00 PM to 3:59 PM | 306 (3.8%) | 437 (7.3%) |
| 4:00 PM to 11:59 PM | 403 (5.1%) | 193 (3.2%) |
| Total | 7,982 (100.0%) | 5,954 (100.0%) |
Housing Occupancy in Danville
Occupancy by Ownership in Danville
Of the total 15,726 dwellings in Danville, owner-occupied units account for 13,659 (86.9%), while renter-occupied units make up 2,067 (13.1%).
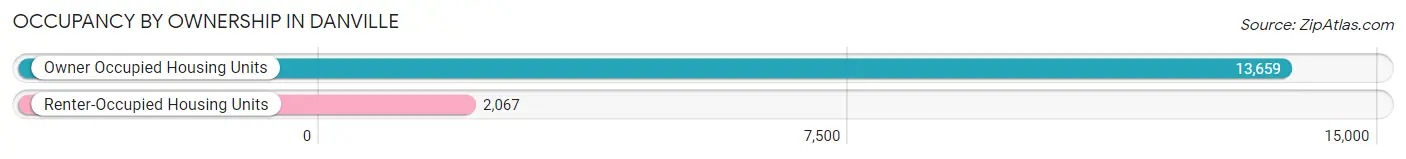
| Occupancy | # Housing Units | % Housing Units |
| Owner Occupied Housing Units | 13,659 | 86.9% |
| Renter-Occupied Housing Units | 2,067 | 13.1% |
| Total Occupied Housing Units | 15,726 | 100.0% |
Occupancy by Household Size in Danville
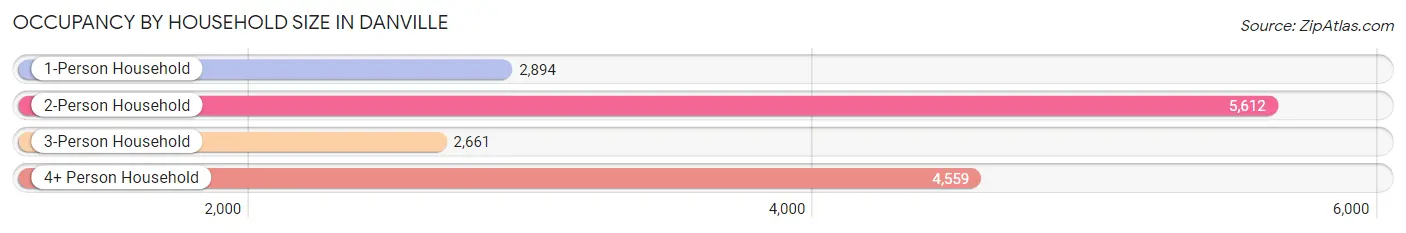
| Household Size | # Housing Units | % Housing Units |
| 1-Person Household | 2,894 | 18.4% |
| 2-Person Household | 5,612 | 35.7% |
| 3-Person Household | 2,661 | 16.9% |
| 4+ Person Household | 4,559 | 29.0% |
| Total Housing Units | 15,726 | 100.0% |
Occupancy by Ownership by Household Size in Danville
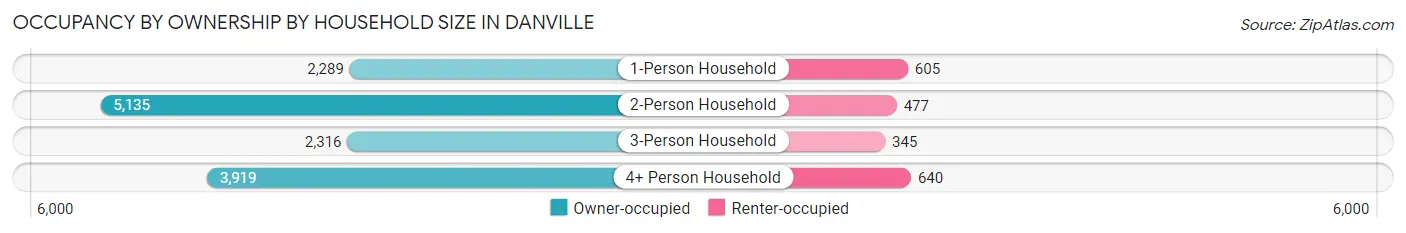
| Household Size | Owner-occupied | Renter-occupied |
| 1-Person Household | 2,289 (79.1%) | 605 (20.9%) |
| 2-Person Household | 5,135 (91.5%) | 477 (8.5%) |
| 3-Person Household | 2,316 (87.0%) | 345 (13.0%) |
| 4+ Person Household | 3,919 (86.0%) | 640 (14.0%) |
| Total Housing Units | 13,659 (86.9%) | 2,067 (13.1%) |
Occupancy by Educational Attainment in Danville
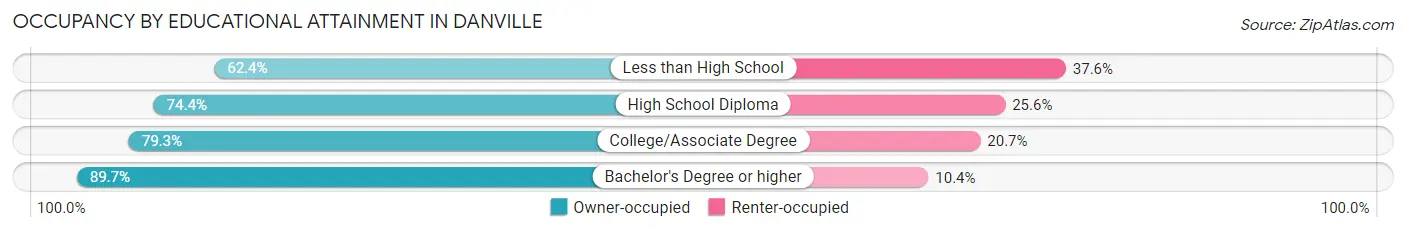
| Household Size | Owner-occupied | Renter-occupied |
| Less than High School | 73 (62.4%) | 44 (37.6%) |
| High School Diploma | 538 (74.4%) | 185 (25.6%) |
| College/Associate Degree | 2,293 (79.3%) | 597 (20.7%) |
| Bachelor's Degree or higher | 10,755 (89.6%) | 1,241 (10.3%) |
Occupancy by Age of Householder in Danville
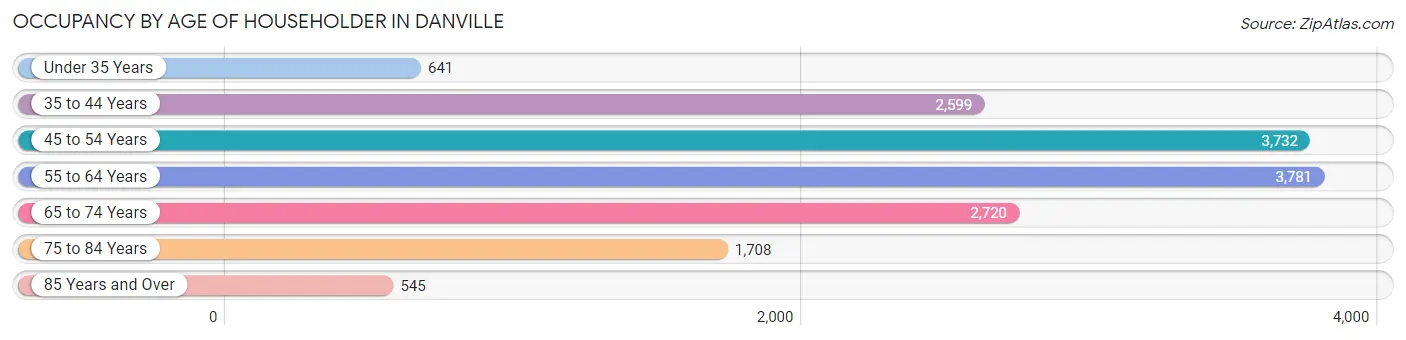
| Age Bracket | # Households | % Households |
| Under 35 Years | 641 | 4.1% |
| 35 to 44 Years | 2,599 | 16.5% |
| 45 to 54 Years | 3,732 | 23.7% |
| 55 to 64 Years | 3,781 | 24.0% |
| 65 to 74 Years | 2,720 | 17.3% |
| 75 to 84 Years | 1,708 | 10.9% |
| 85 Years and Over | 545 | 3.5% |
| Total | 15,726 | 100.0% |
Housing Finances in Danville
Median Income by Occupancy in Danville
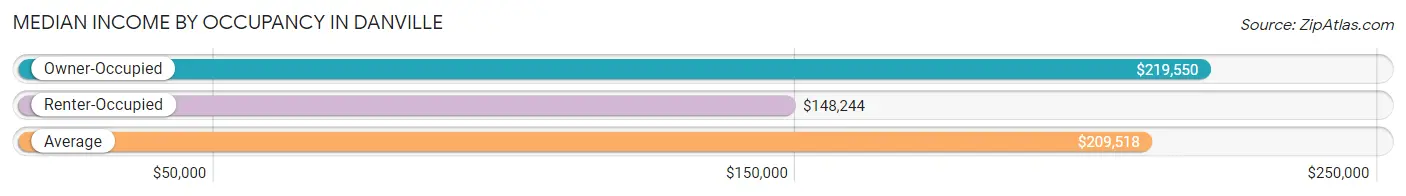
| Occupancy Type | # Households | Median Income |
| Owner-Occupied | 13,659 (86.9%) | $219,550 |
| Renter-Occupied | 2,067 (13.1%) | $148,244 |
| Average | 15,726 (100.0%) | $209,518 |
Occupancy by Householder Income Bracket in Danville
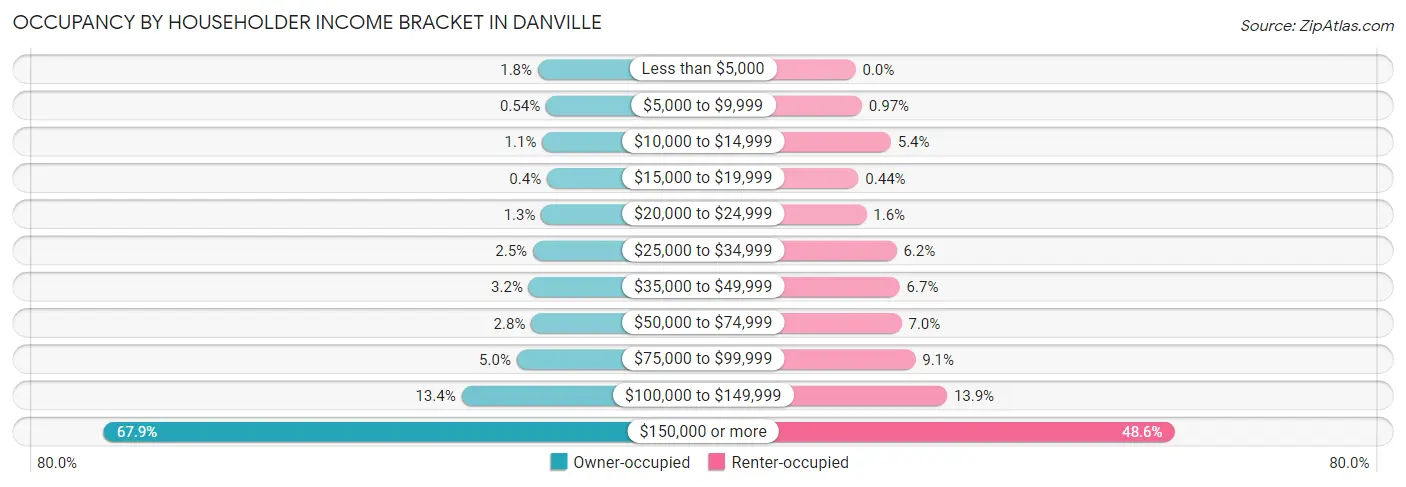
| Income Bracket | Owner-occupied | Renter-occupied |
| Less than $5,000 | 244 (1.8%) | 0 (0.0%) |
| $5,000 to $9,999 | 74 (0.5%) | 20 (1.0%) |
| $10,000 to $14,999 | 153 (1.1%) | 111 (5.4%) |
| $15,000 to $19,999 | 55 (0.4%) | 9 (0.4%) |
| $20,000 to $24,999 | 173 (1.3%) | 34 (1.6%) |
| $25,000 to $34,999 | 347 (2.5%) | 129 (6.2%) |
| $35,000 to $49,999 | 435 (3.2%) | 139 (6.7%) |
| $50,000 to $74,999 | 383 (2.8%) | 145 (7.0%) |
| $75,000 to $99,999 | 684 (5.0%) | 188 (9.1%) |
| $100,000 to $149,999 | 1,835 (13.4%) | 288 (13.9%) |
| $150,000 or more | 9,276 (67.9%) | 1,004 (48.6%) |
| Total | 13,659 (100.0%) | 2,067 (100.0%) |
Monthly Housing Cost Tiers in Danville
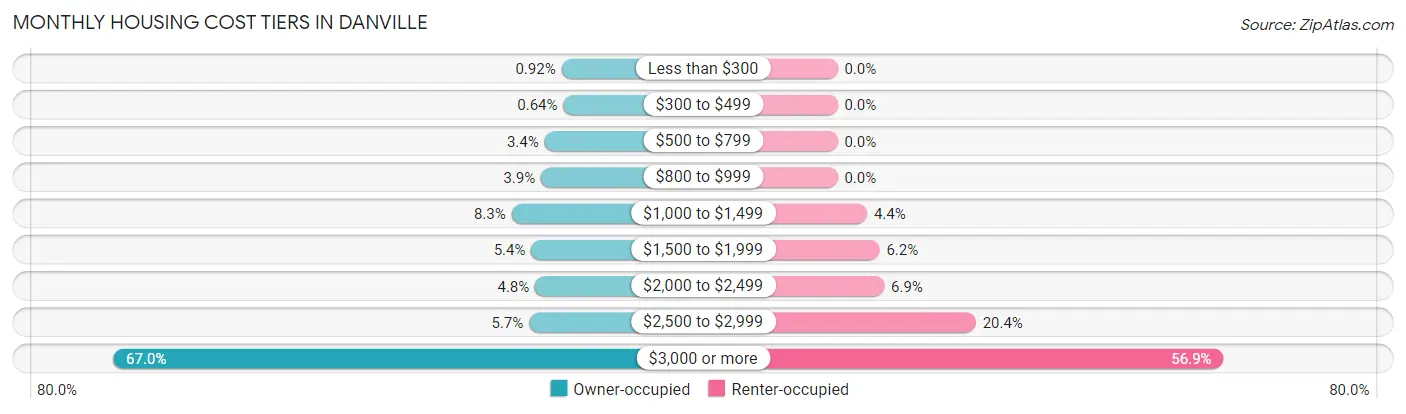
| Monthly Cost | Owner-occupied | Renter-occupied |
| Less than $300 | 126 (0.9%) | 0 (0.0%) |
| $300 to $499 | 87 (0.6%) | 0 (0.0%) |
| $500 to $799 | 467 (3.4%) | 0 (0.0%) |
| $800 to $999 | 537 (3.9%) | 0 (0.0%) |
| $1,000 to $1,499 | 1,129 (8.3%) | 90 (4.3%) |
| $1,500 to $1,999 | 734 (5.4%) | 128 (6.2%) |
| $2,000 to $2,499 | 656 (4.8%) | 142 (6.9%) |
| $2,500 to $2,999 | 777 (5.7%) | 421 (20.4%) |
| $3,000 or more | 9,146 (67.0%) | 1,175 (56.9%) |
| Total | 13,659 (100.0%) | 2,067 (100.0%) |
Physical Housing Characteristics in Danville
Housing Structures in Danville
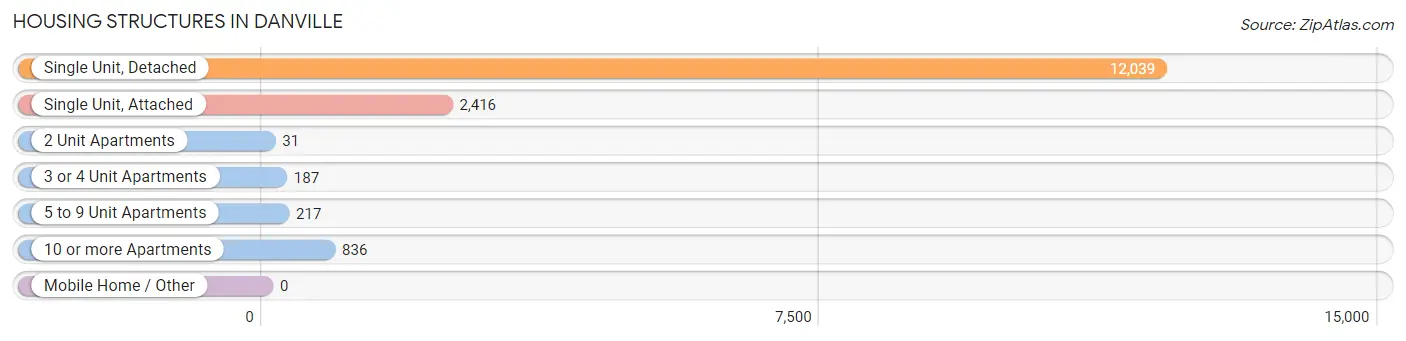
| Structure Type | # Housing Units | % Housing Units |
| Single Unit, Detached | 12,039 | 76.5% |
| Single Unit, Attached | 2,416 | 15.4% |
| 2 Unit Apartments | 31 | 0.2% |
| 3 or 4 Unit Apartments | 187 | 1.2% |
| 5 to 9 Unit Apartments | 217 | 1.4% |
| 10 or more Apartments | 836 | 5.3% |
| Mobile Home / Other | 0 | 0.0% |
| Total | 15,726 | 100.0% |
Housing Structures by Occupancy in Danville
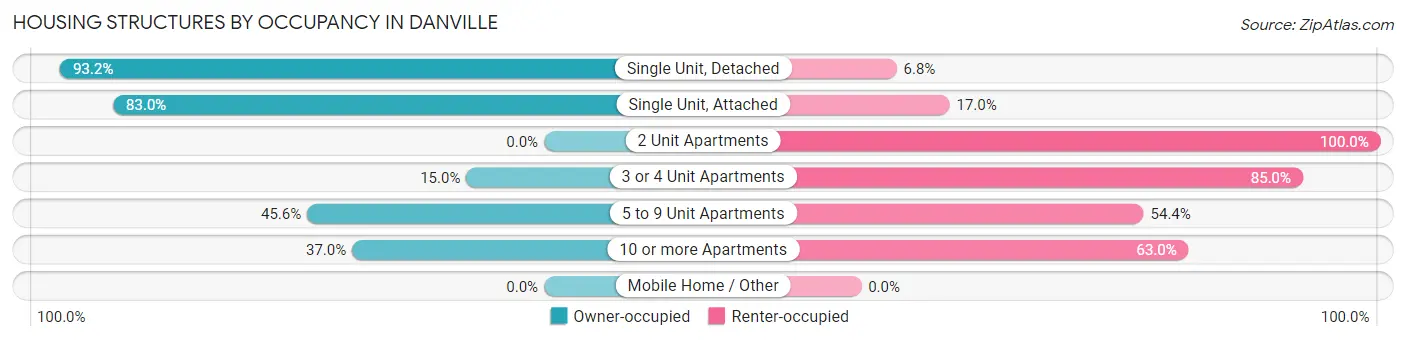
| Structure Type | Owner-occupied | Renter-occupied |
| Single Unit, Detached | 11,218 (93.2%) | 821 (6.8%) |
| Single Unit, Attached | 2,005 (83.0%) | 411 (17.0%) |
| 2 Unit Apartments | 0 (0.0%) | 31 (100.0%) |
| 3 or 4 Unit Apartments | 28 (15.0%) | 159 (85.0%) |
| 5 to 9 Unit Apartments | 99 (45.6%) | 118 (54.4%) |
| 10 or more Apartments | 309 (37.0%) | 527 (63.0%) |
| Mobile Home / Other | 0 (0.0%) | 0 (0.0%) |
| Total | 13,659 (86.9%) | 2,067 (13.1%) |
Housing Structures by Number of Rooms in Danville
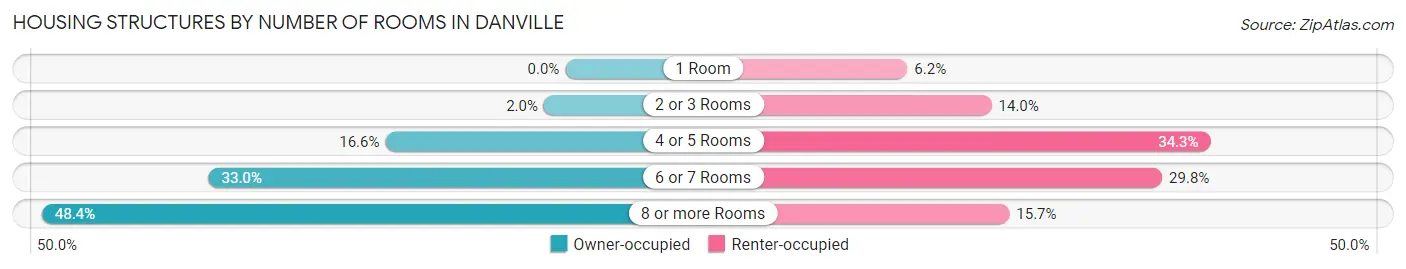
| Number of Rooms | Owner-occupied | Renter-occupied |
| 1 Room | 0 (0.0%) | 129 (6.2%) |
| 2 or 3 Rooms | 270 (2.0%) | 290 (14.0%) |
| 4 or 5 Rooms | 2,273 (16.6%) | 708 (34.3%) |
| 6 or 7 Rooms | 4,505 (33.0%) | 616 (29.8%) |
| 8 or more Rooms | 6,611 (48.4%) | 324 (15.7%) |
| Total | 13,659 (100.0%) | 2,067 (100.0%) |
Housing Structure by Heating Type in Danville
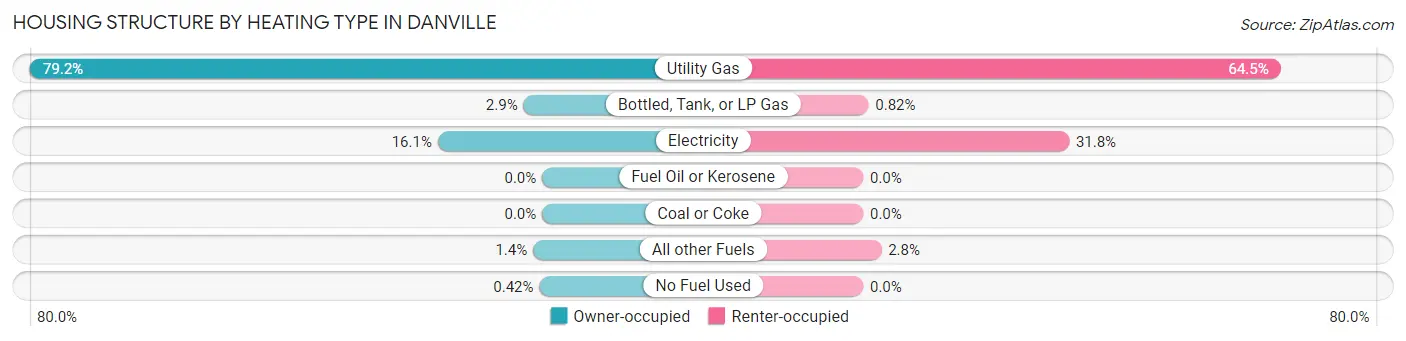
| Heating Type | Owner-occupied | Renter-occupied |
| Utility Gas | 10,814 (79.2%) | 1,334 (64.5%) |
| Bottled, Tank, or LP Gas | 393 (2.9%) | 17 (0.8%) |
| Electricity | 2,203 (16.1%) | 658 (31.8%) |
| Fuel Oil or Kerosene | 0 (0.0%) | 0 (0.0%) |
| Coal or Coke | 0 (0.0%) | 0 (0.0%) |
| All other Fuels | 191 (1.4%) | 58 (2.8%) |
| No Fuel Used | 58 (0.4%) | 0 (0.0%) |
| Total | 13,659 (100.0%) | 2,067 (100.0%) |
Household Vehicle Usage in Danville
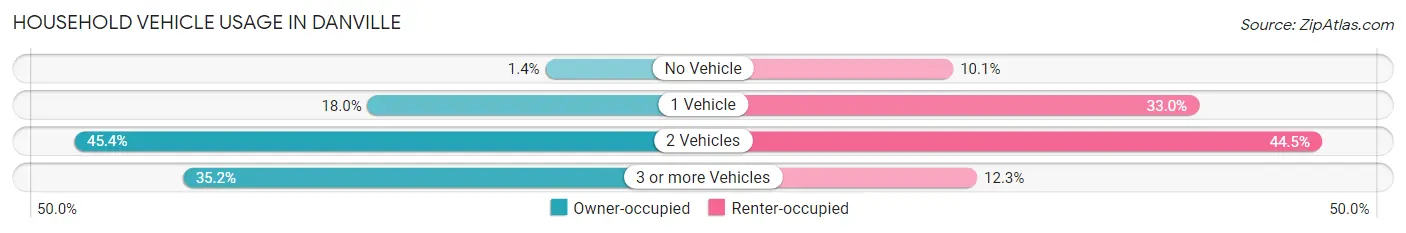
| Vehicles per Household | Owner-occupied | Renter-occupied |
| No Vehicle | 189 (1.4%) | 209 (10.1%) |
| 1 Vehicle | 2,457 (18.0%) | 683 (33.0%) |
| 2 Vehicles | 6,199 (45.4%) | 920 (44.5%) |
| 3 or more Vehicles | 4,814 (35.2%) | 255 (12.3%) |
| Total | 13,659 (100.0%) | 2,067 (100.0%) |
Real Estate & Mortgages in Danville
Real Estate and Mortgage Overview in Danville
| Characteristic | Without Mortgage | With Mortgage |
| Housing Units | 2,818 | 10,841 |
| Median Property Value | $1,345,500 | $1,512,400 |
| Median Household Income | $148,333 | $7,891 |
| Monthly Housing Costs | $1,117 | $8,978 |
| Real Estate Taxes | $6,572 | $0 |
Property Value by Mortgage Status in Danville
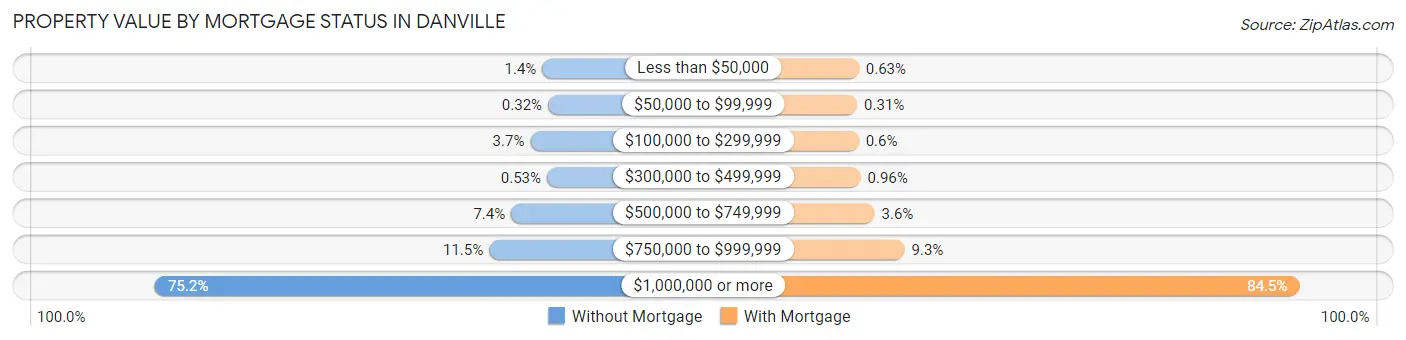
| Property Value | Without Mortgage | With Mortgage |
| Less than $50,000 | 40 (1.4%) | 68 (0.6%) |
| $50,000 to $99,999 | 9 (0.3%) | 34 (0.3%) |
| $100,000 to $299,999 | 104 (3.7%) | 65 (0.6%) |
| $300,000 to $499,999 | 15 (0.5%) | 104 (1.0%) |
| $500,000 to $749,999 | 207 (7.3%) | 394 (3.6%) |
| $750,000 to $999,999 | 325 (11.5%) | 1,013 (9.3%) |
| $1,000,000 or more | 2,118 (75.2%) | 9,163 (84.5%) |
| Total | 2,818 (100.0%) | 10,841 (100.0%) |
Household Income by Mortgage Status in Danville
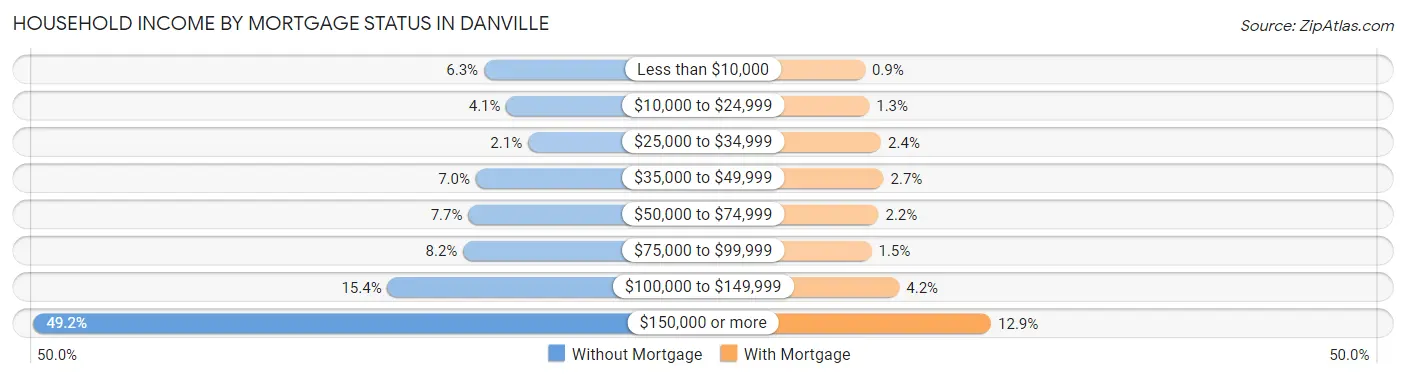
| Household Income | Without Mortgage | With Mortgage |
| Less than $10,000 | 176 (6.2%) | 98 (0.9%) |
| $10,000 to $24,999 | 116 (4.1%) | 142 (1.3%) |
| $25,000 to $34,999 | 58 (2.1%) | 265 (2.4%) |
| $35,000 to $49,999 | 198 (7.0%) | 289 (2.7%) |
| $50,000 to $74,999 | 218 (7.7%) | 237 (2.2%) |
| $75,000 to $99,999 | 232 (8.2%) | 165 (1.5%) |
| $100,000 to $149,999 | 435 (15.4%) | 452 (4.2%) |
| $150,000 or more | 1,385 (49.1%) | 1,400 (12.9%) |
| Total | 2,818 (100.0%) | 10,841 (100.0%) |
Property Value to Household Income Ratio in Danville
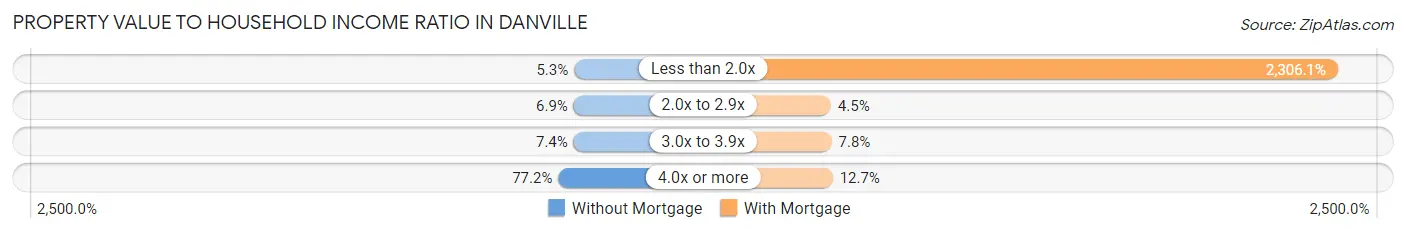
| Value-to-Income Ratio | Without Mortgage | With Mortgage |
| Less than 2.0x | 149 (5.3%) | 250,001 (2,306.1%) |
| 2.0x to 2.9x | 194 (6.9%) | 484 (4.5%) |
| 3.0x to 3.9x | 208 (7.4%) | 843 (7.8%) |
| 4.0x or more | 2,176 (77.2%) | 1,374 (12.7%) |
| Total | 2,818 (100.0%) | 10,841 (100.0%) |
Real Estate Taxes by Mortgage Status in Danville
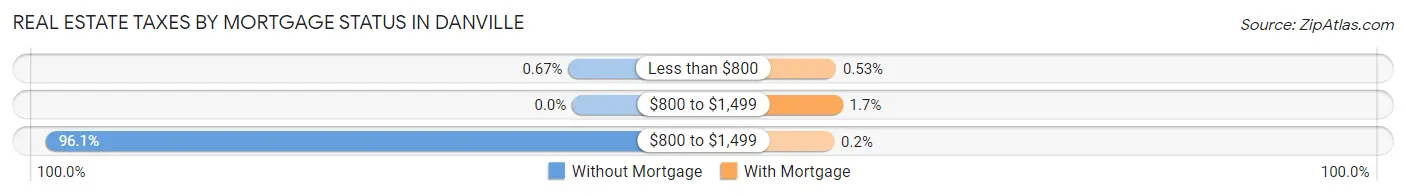
| Property Taxes | Without Mortgage | With Mortgage |
| Less than $800 | 19 (0.7%) | 57 (0.5%) |
| $800 to $1,499 | 0 (0.0%) | 188 (1.7%) |
| $800 to $1,499 | 2,709 (96.1%) | 22 (0.2%) |
| Total | 2,818 (100.0%) | 10,841 (100.0%) |
Health & Disability in Danville
Health Insurance Coverage by Age in Danville
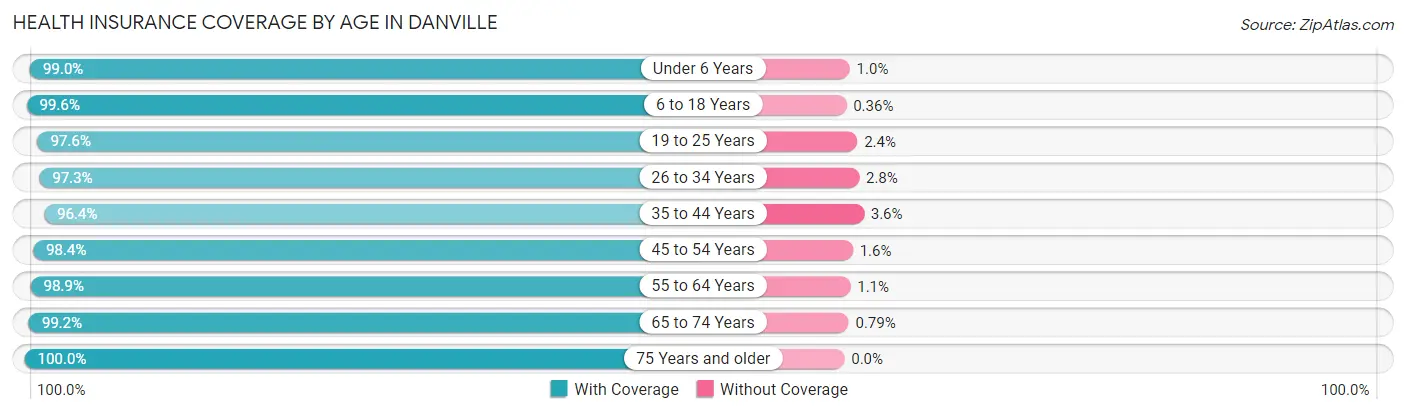
| Age Bracket | With Coverage | Without Coverage |
| Under 6 Years | 2,370 (99.0%) | 24 (1.0%) |
| 6 to 18 Years | 9,347 (99.6%) | 34 (0.4%) |
| 19 to 25 Years | 2,466 (97.6%) | 61 (2.4%) |
| 26 to 34 Years | 1,841 (97.3%) | 52 (2.8%) |
| 35 to 44 Years | 4,645 (96.4%) | 175 (3.6%) |
| 45 to 54 Years | 7,227 (98.4%) | 115 (1.6%) |
| 55 to 64 Years | 6,703 (98.9%) | 76 (1.1%) |
| 65 to 74 Years | 4,516 (99.2%) | 36 (0.8%) |
| 75 Years and older | 3,716 (100.0%) | 0 (0.0%) |
| Total | 42,831 (98.7%) | 573 (1.3%) |
Health Insurance Coverage by Citizenship Status in Danville
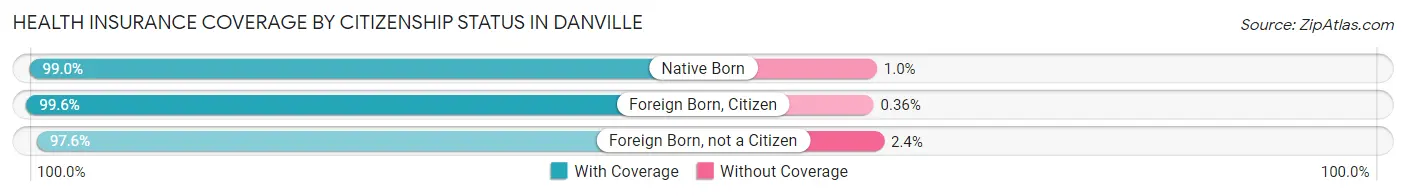
| Citizenship Status | With Coverage | Without Coverage |
| Native Born | 2,370 (99.0%) | 24 (1.0%) |
| Foreign Born, Citizen | 9,347 (99.6%) | 34 (0.4%) |
| Foreign Born, not a Citizen | 2,466 (97.6%) | 61 (2.4%) |
Health Insurance Coverage by Household Income in Danville
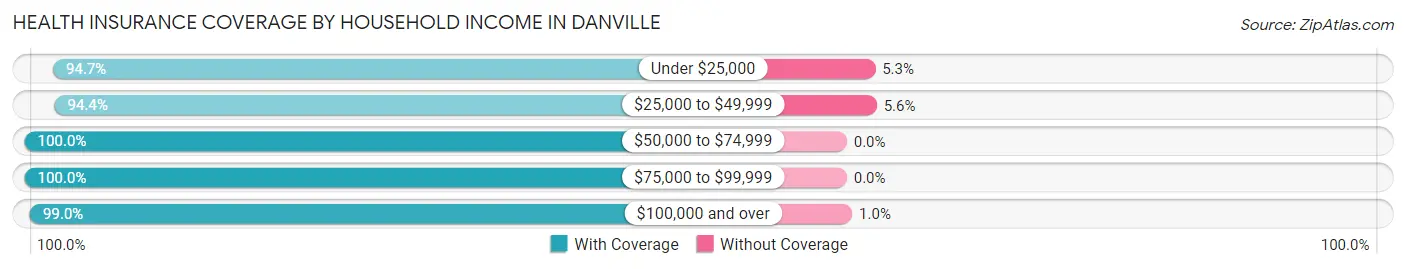
| Household Income | With Coverage | Without Coverage |
| Under $25,000 | 1,352 (94.7%) | 76 (5.3%) |
| $25,000 to $49,999 | 1,717 (94.4%) | 102 (5.6%) |
| $50,000 to $74,999 | 732 (100.0%) | 0 (0.0%) |
| $75,000 to $99,999 | 1,961 (100.0%) | 0 (0.0%) |
| $100,000 and over | 36,872 (99.0%) | 371 (1.0%) |
Public vs Private Health Insurance Coverage by Age in Danville
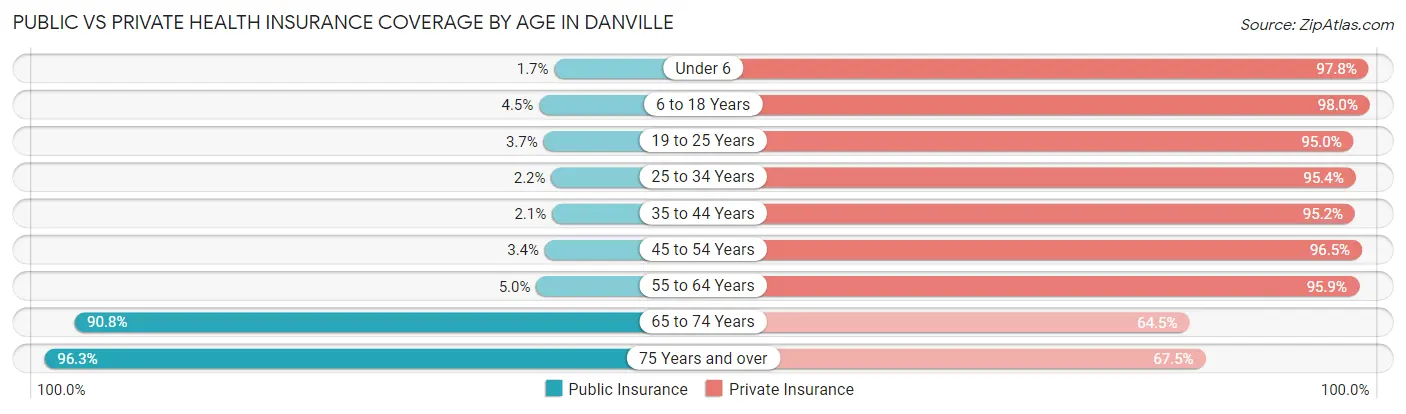
| Age Bracket | Public Insurance | Private Insurance |
| Under 6 | 40 (1.7%) | 2,341 (97.8%) |
| 6 to 18 Years | 422 (4.5%) | 9,194 (98.0%) |
| 19 to 25 Years | 93 (3.7%) | 2,400 (95.0%) |
| 25 to 34 Years | 42 (2.2%) | 1,805 (95.4%) |
| 35 to 44 Years | 101 (2.1%) | 4,590 (95.2%) |
| 45 to 54 Years | 252 (3.4%) | 7,088 (96.5%) |
| 55 to 64 Years | 340 (5.0%) | 6,504 (95.9%) |
| 65 to 74 Years | 4,133 (90.8%) | 2,936 (64.5%) |
| 75 Years and over | 3,580 (96.3%) | 2,508 (67.5%) |
| Total | 9,003 (20.7%) | 39,366 (90.7%) |
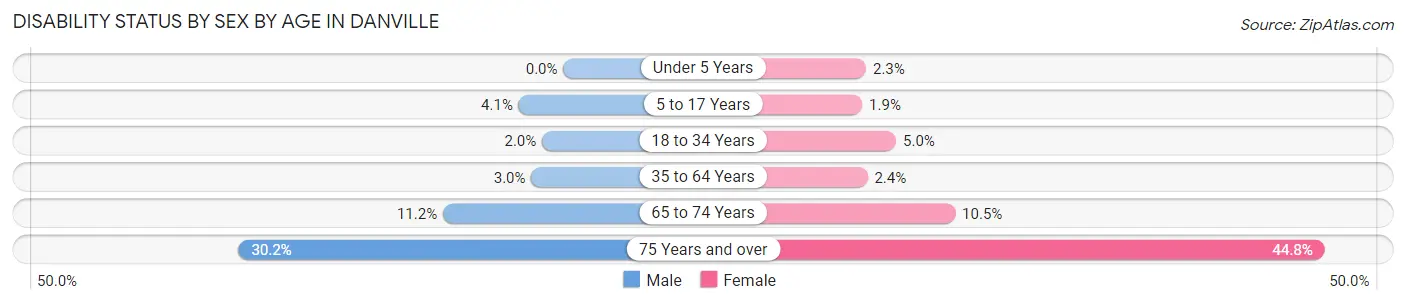
Disability Status by Sex by Age in Danville
| Age Bracket | Male | Female |
| Under 5 Years | 0 (0.0%) | 19 (2.2%) |
| 5 to 17 Years | 208 (4.1%) | 79 (1.9%) |
| 18 to 34 Years | 50 (2.0%) | 133 (5.0%) |
| 35 to 64 Years | 274 (3.0%) | 232 (2.4%) |
| 65 to 74 Years | 276 (11.2%) | 219 (10.5%) |
| 75 Years and over | 473 (30.1%) | 962 (44.8%) |
Disability Class by Sex by Age in Danville
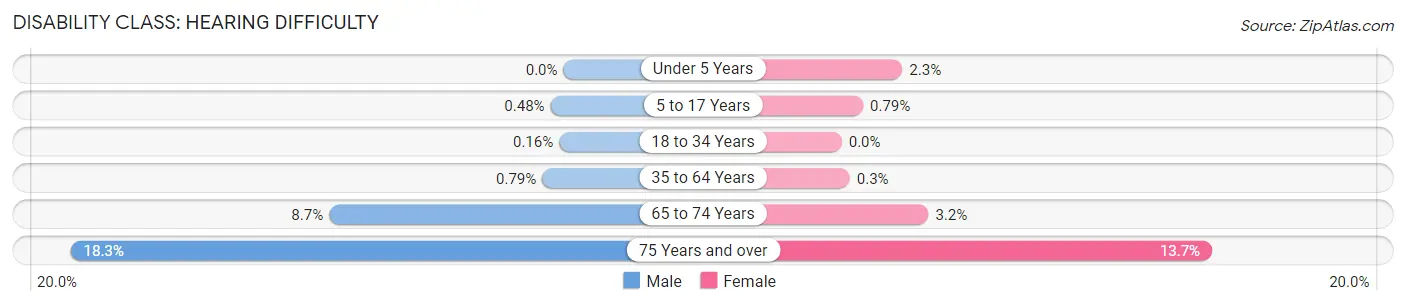
Disability Class: Hearing Difficulty
| Age Bracket | Male | Female |
| Under 5 Years | 0 (0.0%) | 19 (2.2%) |
| 5 to 17 Years | 24 (0.5%) | 33 (0.8%) |
| 18 to 34 Years | 4 (0.2%) | 0 (0.0%) |
| 35 to 64 Years | 73 (0.8%) | 29 (0.3%) |
| 65 to 74 Years | 215 (8.7%) | 67 (3.2%) |
| 75 Years and over | 287 (18.3%) | 295 (13.7%) |
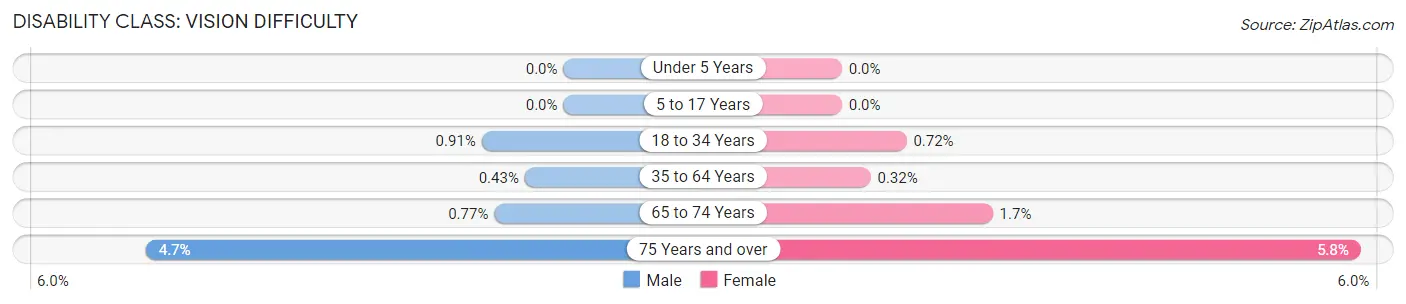
Disability Class: Vision Difficulty
| Age Bracket | Male | Female |
| Under 5 Years | 0 (0.0%) | 0 (0.0%) |
| 5 to 17 Years | 0 (0.0%) | 0 (0.0%) |
| 18 to 34 Years | 23 (0.9%) | 19 (0.7%) |
| 35 to 64 Years | 40 (0.4%) | 31 (0.3%) |
| 65 to 74 Years | 19 (0.8%) | 35 (1.7%) |
| 75 Years and over | 73 (4.6%) | 124 (5.8%) |
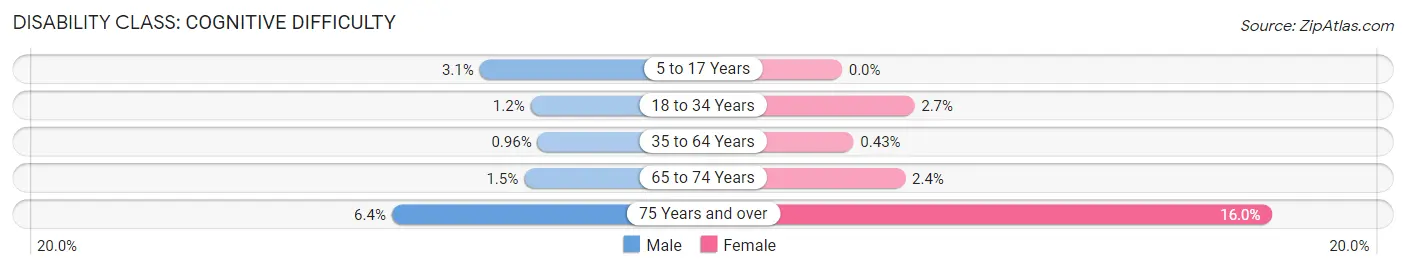
Disability Class: Cognitive Difficulty
| Age Bracket | Male | Female |
| 5 to 17 Years | 156 (3.1%) | 0 (0.0%) |
| 18 to 34 Years | 31 (1.2%) | 71 (2.7%) |
| 35 to 64 Years | 88 (1.0%) | 42 (0.4%) |
| 65 to 74 Years | 36 (1.5%) | 49 (2.4%) |
| 75 Years and over | 100 (6.4%) | 343 (16.0%) |
Disability Class: Ambulatory Difficulty
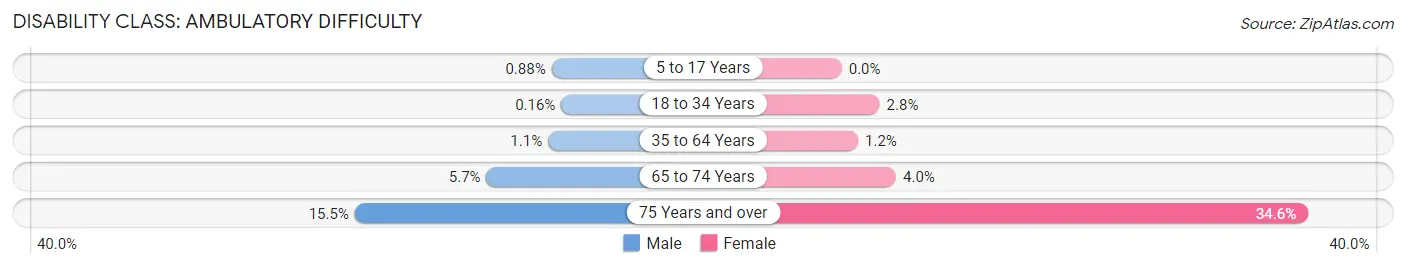
| Age Bracket | Male | Female |
| 5 to 17 Years | 44 (0.9%) | 0 (0.0%) |
| 18 to 34 Years | 4 (0.2%) | 74 (2.8%) |
| 35 to 64 Years | 105 (1.1%) | 118 (1.2%) |
| 65 to 74 Years | 141 (5.7%) | 84 (4.0%) |
| 75 Years and over | 243 (15.5%) | 743 (34.6%) |
Disability Class: Self-Care Difficulty
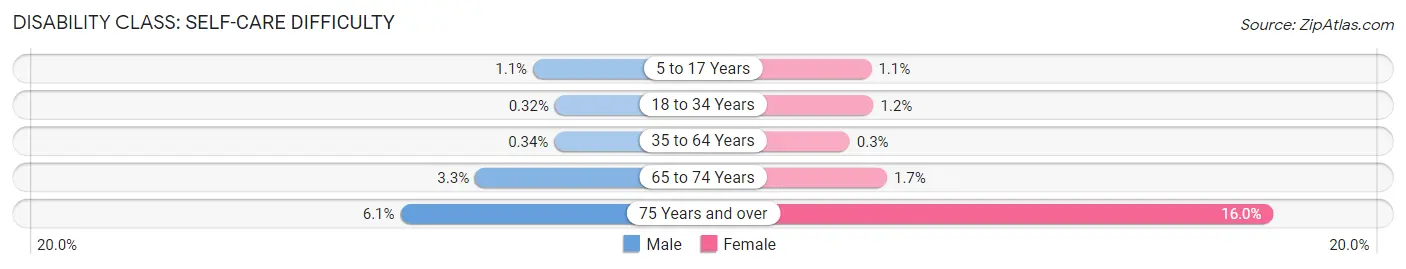
| Age Bracket | Male | Female |
| 5 to 17 Years | 57 (1.1%) | 46 (1.1%) |
| 18 to 34 Years | 8 (0.3%) | 31 (1.2%) |
| 35 to 64 Years | 31 (0.3%) | 29 (0.3%) |
| 65 to 74 Years | 81 (3.3%) | 35 (1.7%) |
| 75 Years and over | 95 (6.0%) | 344 (16.0%) |
Technology Access in Danville
Computing Device Access in Danville
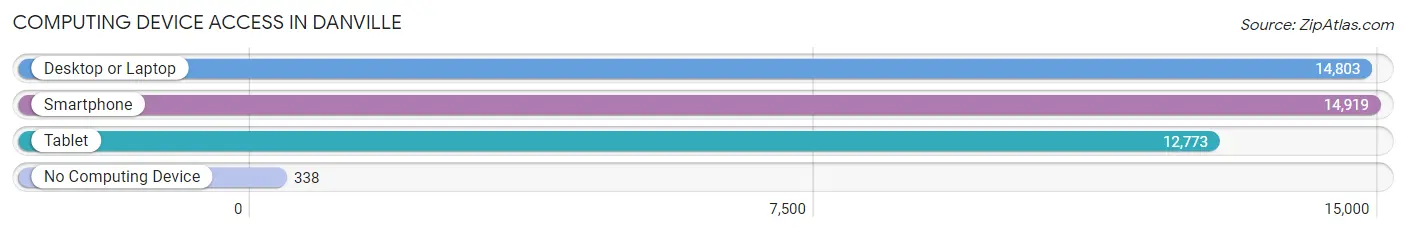
| Device Type | # Households | % Households |
| Desktop or Laptop | 14,803 | 94.1% |
| Smartphone | 14,919 | 94.9% |
| Tablet | 12,773 | 81.2% |
| No Computing Device | 338 | 2.1% |
| Total | 15,726 | 100.0% |
Internet Access in Danville
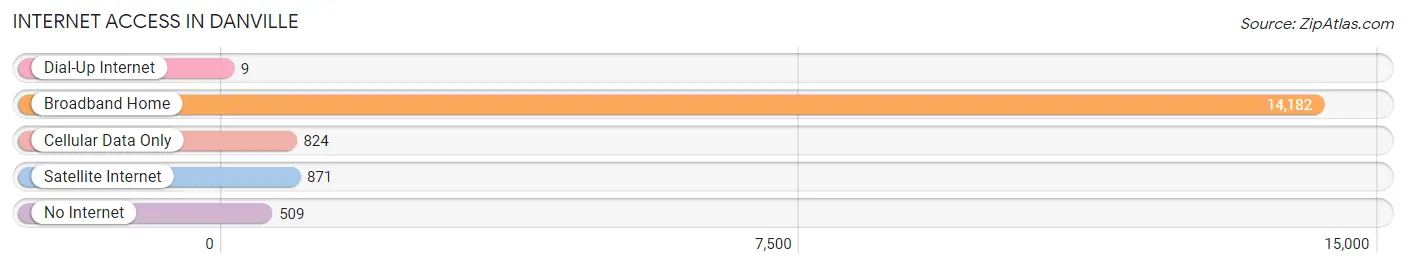
| Internet Type | # Households | % Households |
| Dial-Up Internet | 9 | 0.1% |
| Broadband Home | 14,182 | 90.2% |
| Cellular Data Only | 824 | 5.2% |
| Satellite Internet | 871 | 5.5% |
| No Internet | 509 | 3.2% |
| Total | 15,726 | 100.0% |
Danville Summary
Danville is a town located in Contra Costa County, California, United States. It is one of the most affluent towns in the San Francisco Bay Area and is known for its high quality of life. The population was 42,039 at the 2010 census. Danville is home to some of the most expensive real estate in the United States.
Geography
Danville is located in the San Ramon Valley, at the base of the Diablo Range. The town is bordered by Alamo to the north, San Ramon to the east, Diablo to the south, and Walnut Creek to the west. The town is situated in a small valley surrounded by rolling hills and is located approximately 40 miles east of San Francisco.
Climate
Danville has a Mediterranean climate, with warm, dry summers and mild, wet winters. The average annual temperature is 63°F (17°C). The average annual precipitation is 22.5 inches (572 mm).
Demographics
As of the 2010 census, the population of Danville was 42,039. The racial makeup of the town was 81.2% White, 0.9% African American, 0.2% Native American, 13.3% Asian, 0.1% Pacific Islander, 1.7% from other races, and 3.5% from two or more races. Hispanic or Latino of any race were 6.2% of the population.
Economy
Danville is home to a variety of businesses, including retail stores, restaurants, professional services, and technology companies. The town is also home to several corporate headquarters, including Chevron, Oracle, and 24 Hour Fitness. The town is also home to several medical centers, including John Muir Medical Center and San Ramon Regional Medical Center.
The median household income in Danville was $142,836 in 2019, making it one of the wealthiest towns in the United States. The median home value was $1,092,000 in 2019, making it one of the most expensive towns in the United States.
History
The area that is now Danville was originally inhabited by the Ohlone people. The town was founded in 1854 by John Jones, who named it after his friend, Daniel Inman. The town was incorporated in 1982.
In the late 19th century, Danville became a popular destination for wealthy San Franciscans who wanted to escape the hustle and bustle of the city. The town was known for its luxurious resorts and spas, and it was a popular destination for wealthy San Franciscans until the Great Depression.
In the late 20th century, Danville became a popular destination for commuters who wanted to live in a more rural setting while still having access to the amenities of the Bay Area. The town has since become one of the most affluent towns in the United States.
Common Questions
What is Per Capita Income in Danville?
Per Capita income in Danville is $96,855.
What is the Median Family Income in Danville?
Median Family Income in Danville is $242,352.
What is the Median Household income in Danville?
Median Household Income in Danville is $209,518.
What is Income or Wage Gap in Danville?
Income or Wage Gap in Danville is 47.9%.
Women in Danville earn 52.1 cents for every dollar earned by a man.
What is Family Income Deficit in Danville?
Family Income Deficit in Danville is $10,512.
Families that are below poverty line in Danville earn $10,512 less on average than the poverty threshold level.
What is Inequality or Gini Index in Danville?
Inequality or Gini Index in Danville is 0.43.
What is the Total Population of Danville?
Total Population of Danville is 43,449.
What is the Total Male Population of Danville?
Total Male Population of Danville is 21,799.
What is the Total Female Population of Danville?
Total Female Population of Danville is 21,650.
What is the Ratio of Males per 100 Females in Danville?
There are 100.69 Males per 100 Females in Danville.
What is the Ratio of Females per 100 Males in Danville?
There are 99.32 Females per 100 Males in Danville.
What is the Median Population Age in Danville?
Median Population Age in Danville is 46.1 Years.
What is the Average Family Size in Danville
Average Family Size in Danville is 3.1 People.
What is the Average Household Size in Danville
Average Household Size in Danville is 2.8 People.
How Large is the Labor Force in Danville?
There are 21,593 People in the Labor Forcein in Danville.
What is the Percentage of People in the Labor Force in Danville?
63.4% of People are in the Labor Force in Danville.
What is the Unemployment Rate in Danville?
Unemployment Rate in Danville is 4.4%.