Derby Acres, CA Map & Demographics
Derby Acres Map
Derby Acres Overview
$21,275
PER CAPITA INCOME
$62,500
AVG FAMILY INCOME
$55,125
AVG HOUSEHOLD INCOME
0.43
INEQUALITY / GINI INDEX
416
TOTAL POPULATION
204
MALE POPULATION
212
FEMALE POPULATION
96.23
MALES / 100 FEMALES
103.92
FEMALES / 100 MALES
32.8
MEDIAN AGE
3.9
AVG FAMILY SIZE
3.2
AVG HOUSEHOLD SIZE
152
LABOR FORCE [ PEOPLE ]
51.4%
PERCENT IN LABOR FORCE
16.4%
UNEMPLOYMENT RATE
Income in Derby Acres
Income Overview in Derby Acres
Per Capita Income in Derby Acres is $21,275, while median incomes of families and households are $62,500 and $55,125 respectively.
| Characteristic | Number | Measure |
| Per Capita Income | 416 | $21,275 |
| Median Family Income | 94 | $62,500 |
| Mean Family Income | 94 | $76,997 |
| Median Household Income | 131 | $55,125 |
| Mean Household Income | 131 | $66,737 |
| Income Deficit | 94 | $0 |
| Wage / Income Gap (%) | 416 | 0.00% |
| Wage / Income Gap ($) | 416 | 100.00¢ per $1 |
| Gini / Inequality Index | 416 | 0.43 |
Earnings by Sex in Derby Acres
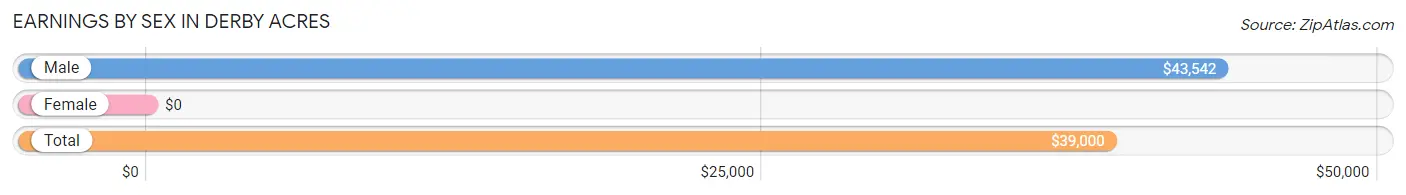
| Sex | Number | Average Earnings |
| Male | 103 (67.8%) | $43,542 |
| Female | 49 (32.2%) | $0 |
| Total | 152 (100.0%) | $39,000 |
Earnings by Sex by Income Bracket in Derby Acres
The most common earnings brackets in Derby Acres are $55,000 to $64,999 for men (18 | 17.5%) and $7,500 to $9,999 for women (8 | 16.3%).
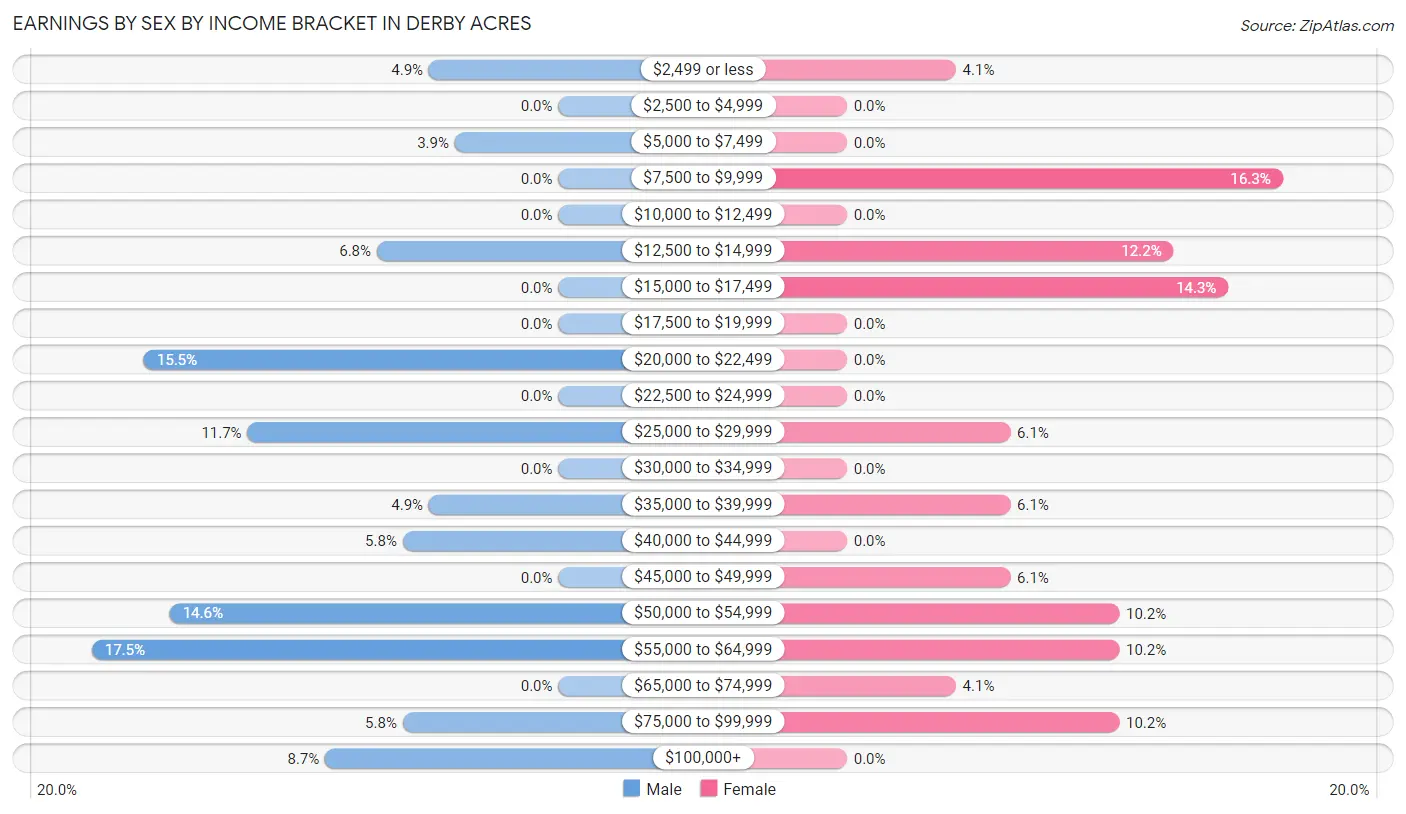
| Income | Male | Female |
| $2,499 or less | 5 (4.9%) | 2 (4.1%) |
| $2,500 to $4,999 | 0 (0.0%) | 0 (0.0%) |
| $5,000 to $7,499 | 4 (3.9%) | 0 (0.0%) |
| $7,500 to $9,999 | 0 (0.0%) | 8 (16.3%) |
| $10,000 to $12,499 | 0 (0.0%) | 0 (0.0%) |
| $12,500 to $14,999 | 7 (6.8%) | 6 (12.2%) |
| $15,000 to $17,499 | 0 (0.0%) | 7 (14.3%) |
| $17,500 to $19,999 | 0 (0.0%) | 0 (0.0%) |
| $20,000 to $22,499 | 16 (15.5%) | 0 (0.0%) |
| $22,500 to $24,999 | 0 (0.0%) | 0 (0.0%) |
| $25,000 to $29,999 | 12 (11.7%) | 3 (6.1%) |
| $30,000 to $34,999 | 0 (0.0%) | 0 (0.0%) |
| $35,000 to $39,999 | 5 (4.9%) | 3 (6.1%) |
| $40,000 to $44,999 | 6 (5.8%) | 0 (0.0%) |
| $45,000 to $49,999 | 0 (0.0%) | 3 (6.1%) |
| $50,000 to $54,999 | 15 (14.6%) | 5 (10.2%) |
| $55,000 to $64,999 | 18 (17.5%) | 5 (10.2%) |
| $65,000 to $74,999 | 0 (0.0%) | 2 (4.1%) |
| $75,000 to $99,999 | 6 (5.8%) | 5 (10.2%) |
| $100,000+ | 9 (8.7%) | 0 (0.0%) |
| Total | 103 (100.0%) | 49 (100.0%) |
Earnings by Sex by Educational Attainment in Derby Acres
Average earnings in Derby Acres are $47,500 for men and $35,833 for women, a difference of 24.6%. Men with an educational attainment of college or associate's degree enjoy the highest average annual earnings of $64,375, while those with high school diploma education earn the least with $42,708. Women with an educational attainment of college or associate's degree earn the most with the average annual earnings of $47,083, while those with high school diploma education have the smallest earnings of $25,833.
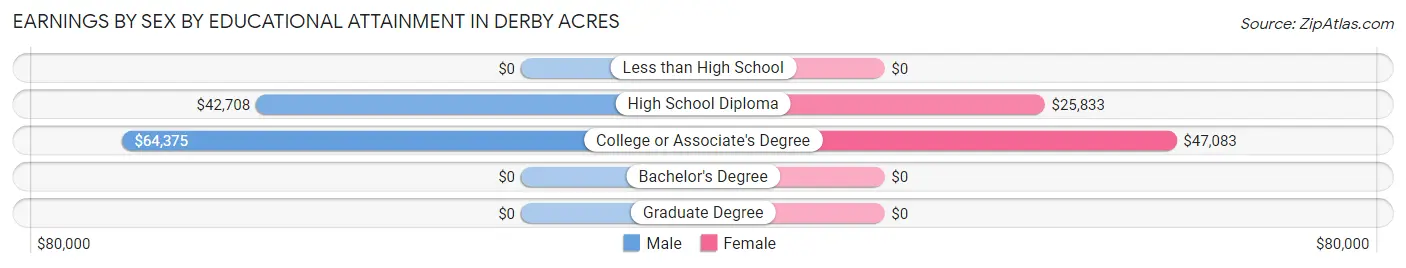
| Educational Attainment | Male Income | Female Income |
| Less than High School | - | - |
| High School Diploma | $42,708 | $25,833 |
| College or Associate's Degree | $64,375 | $47,083 |
| Bachelor's Degree | - | - |
| Graduate Degree | - | - |
| Total | $47,500 | $35,833 |
Family Income in Derby Acres
Family Income Brackets in Derby Acres
According to the Derby Acres family income data, there are 26 families falling into the $35,000 to $49,999 income range, which is the most common income bracket and makes up 27.7% of all families.
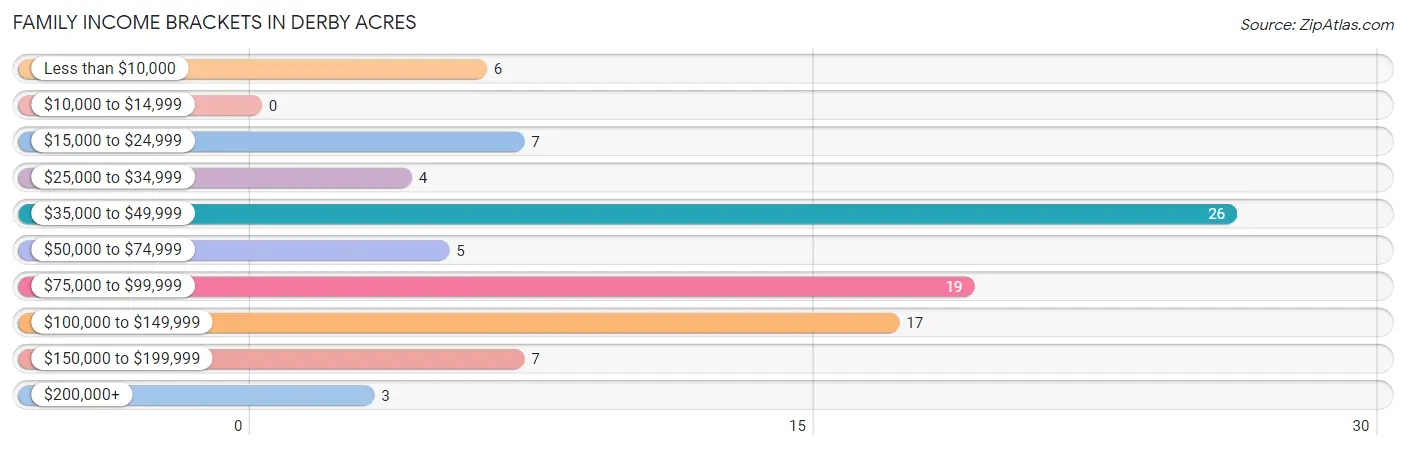
| Income Bracket | # Families | % Families |
| Less than $10,000 | 6 | 6.4% |
| $10,000 to $14,999 | 0 | 0.0% |
| $15,000 to $24,999 | 7 | 7.4% |
| $25,000 to $34,999 | 4 | 4.3% |
| $35,000 to $49,999 | 26 | 27.7% |
| $50,000 to $74,999 | 5 | 5.3% |
| $75,000 to $99,999 | 19 | 20.2% |
| $100,000 to $149,999 | 17 | 18.1% |
| $150,000 to $199,999 | 7 | 7.4% |
| $200,000+ | 3 | 3.2% |
Family Income by Famaliy Size in Derby Acres
3-person families (13 | 13.8%) account for the highest median family income in Derby Acres with $125,250 per family, while 2-person families (32 | 34.0%) have the highest median income of $43,958 per family member.
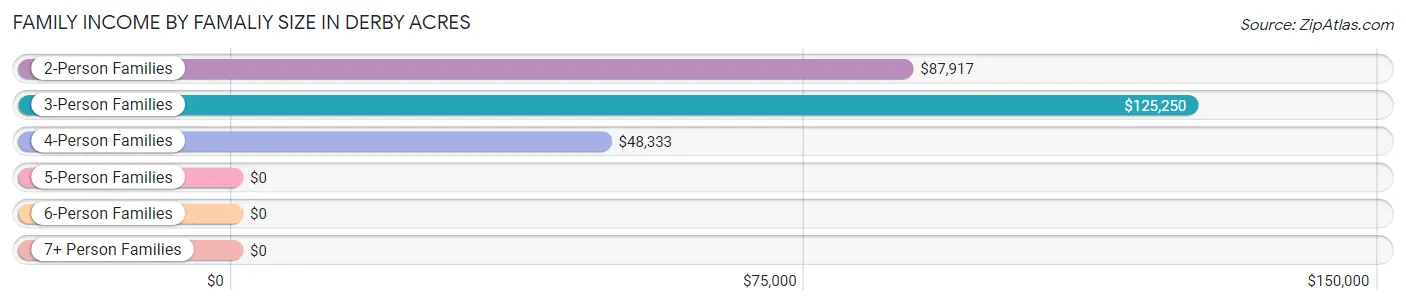
| Income Bracket | # Families | Median Income |
| 2-Person Families | 32 (34.0%) | $87,917 |
| 3-Person Families | 13 (13.8%) | $125,250 |
| 4-Person Families | 30 (31.9%) | $48,333 |
| 5-Person Families | 2 (2.1%) | $0 |
| 6-Person Families | 7 (7.4%) | $0 |
| 7+ Person Families | 10 (10.6%) | $0 |
| Total | 94 (100.0%) | $62,500 |
Family Income by Number of Earners in Derby Acres
The median family income in Derby Acres is $62,500, with families comprising 3+ earners (16) having the highest median family income of $94,167, while families with no earners (25) have the lowest median family income of $38,542, accounting for 17.0% and 26.6% of families, respectively.
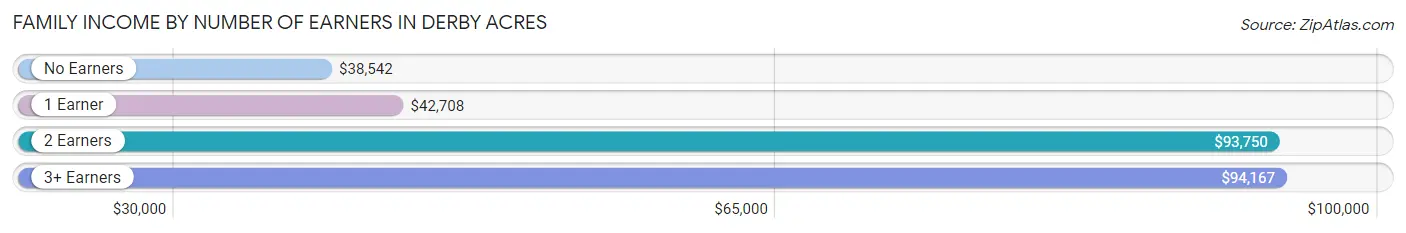
| Number of Earners | # Families | Median Income |
| No Earners | 25 (26.6%) | $38,542 |
| 1 Earner | 31 (33.0%) | $42,708 |
| 2 Earners | 22 (23.4%) | $93,750 |
| 3+ Earners | 16 (17.0%) | $94,167 |
| Total | 94 (100.0%) | $62,500 |
Household Income in Derby Acres
Household Income Brackets in Derby Acres
With 25 households falling in the category, the $35,000 to $49,999 income range is the most frequent in Derby Acres, accounting for 19.1% of all households. In contrast, only 2 households (1.5%) fall into the $10,000 to $14,999 income bracket, making it the least populous group.
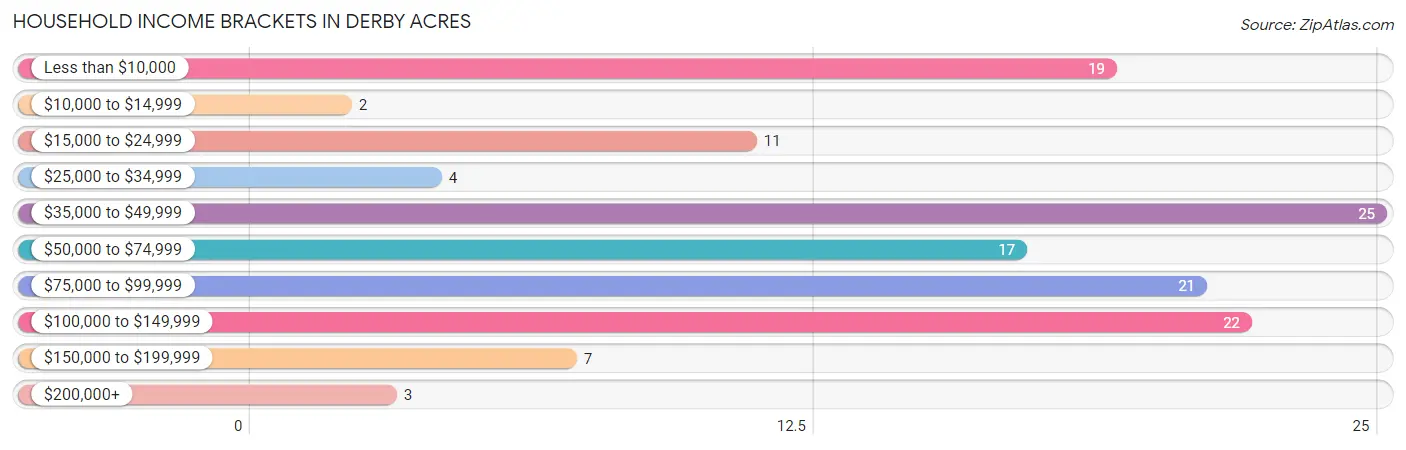
| Income Bracket | # Households | % Households |
| Less than $10,000 | 19 | 14.5% |
| $10,000 to $14,999 | 2 | 1.5% |
| $15,000 to $24,999 | 11 | 8.4% |
| $25,000 to $34,999 | 4 | 3.1% |
| $35,000 to $49,999 | 25 | 19.1% |
| $50,000 to $74,999 | 17 | 13.0% |
| $75,000 to $99,999 | 21 | 16.0% |
| $100,000 to $149,999 | 22 | 16.8% |
| $150,000 to $199,999 | 7 | 5.3% |
| $200,000+ | 3 | 2.3% |
Household Income by Householder Age in Derby Acres
The median household income in Derby Acres is $55,125, with the highest median household income of $72,500 found in the 45 to 64 years age bracket for the primary householder. A total of 66 households (50.4%) fall into this category.
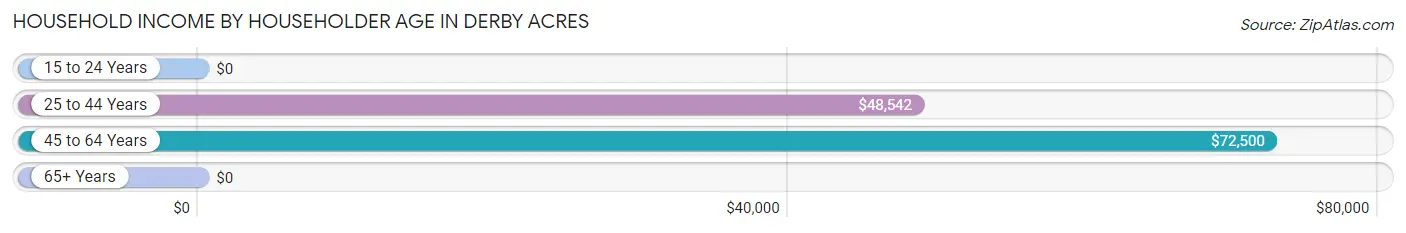
| Income Bracket | # Households | Median Income |
| 15 to 24 Years | 0 (0.0%) | $0 |
| 25 to 44 Years | 27 (20.6%) | $48,542 |
| 45 to 64 Years | 66 (50.4%) | $72,500 |
| 65+ Years | 38 (29.0%) | $0 |
| Total | 131 (100.0%) | $55,125 |
Poverty in Derby Acres
Income Below Poverty by Sex and Age in Derby Acres
With 9.8% poverty level for males and 21.2% for females among the residents of Derby Acres, 55 to 64 year old males and 18 to 24 year old females are the most vulnerable to poverty, with 6 males (30.0%) and 7 females (46.7%) in their respective age groups living below the poverty level.
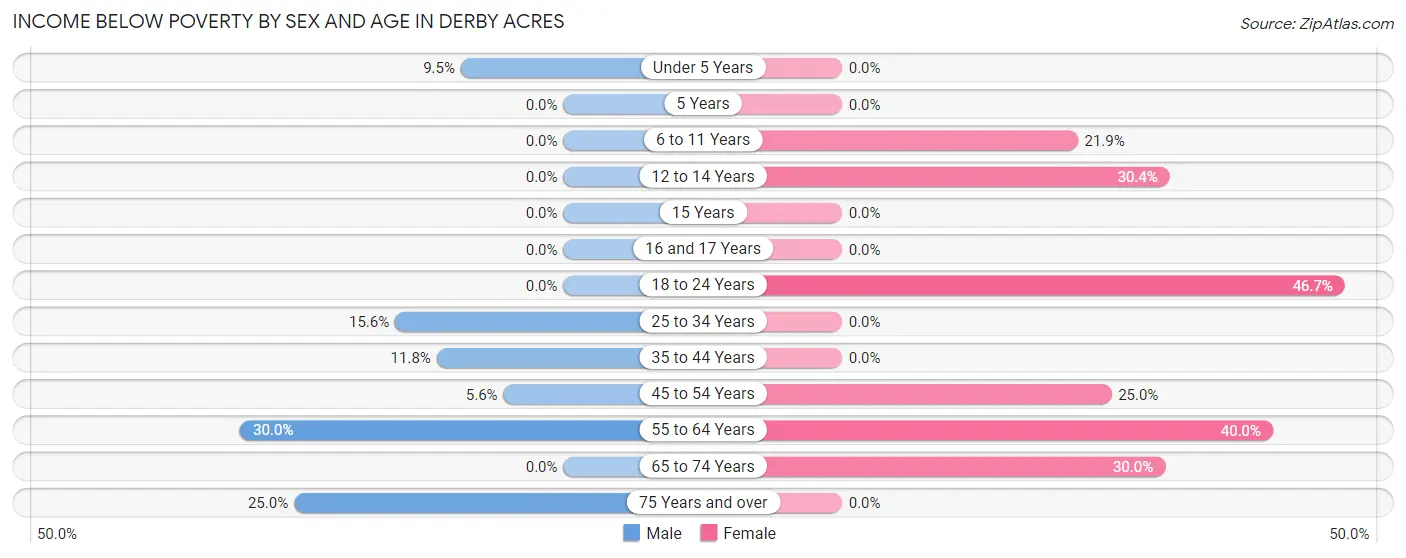
| Age Bracket | Male | Female |
| Under 5 Years | 2 (9.5%) | 0 (0.0%) |
| 5 Years | 0 (0.0%) | 0 (0.0%) |
| 6 to 11 Years | 0 (0.0%) | 7 (21.9%) |
| 12 to 14 Years | 0 (0.0%) | 7 (30.4%) |
| 15 Years | 0 (0.0%) | 0 (0.0%) |
| 16 and 17 Years | 0 (0.0%) | 0 (0.0%) |
| 18 to 24 Years | 0 (0.0%) | 7 (46.7%) |
| 25 to 34 Years | 5 (15.6%) | 0 (0.0%) |
| 35 to 44 Years | 2 (11.8%) | 0 (0.0%) |
| 45 to 54 Years | 2 (5.6%) | 8 (25.0%) |
| 55 to 64 Years | 6 (30.0%) | 10 (40.0%) |
| 65 to 74 Years | 0 (0.0%) | 6 (30.0%) |
| 75 Years and over | 3 (25.0%) | 0 (0.0%) |
| Total | 20 (9.8%) | 45 (21.2%) |
Income Above Poverty by Sex and Age in Derby Acres
According to the poverty statistics in Derby Acres, males aged 6 to 11 years and females aged under 5 years are the age groups that are most secure financially, with 100.0% of males and 100.0% of females in these age groups living above the poverty line.
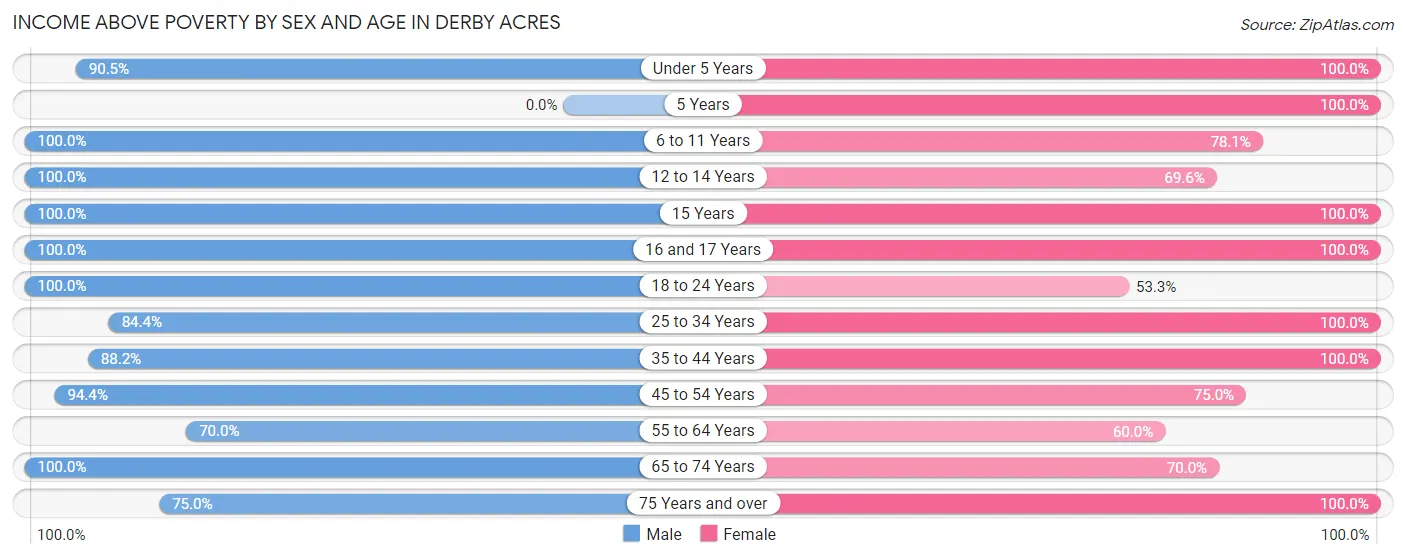
| Age Bracket | Male | Female |
| Under 5 Years | 19 (90.5%) | 3 (100.0%) |
| 5 Years | 0 (0.0%) | 6 (100.0%) |
| 6 to 11 Years | 15 (100.0%) | 25 (78.1%) |
| 12 to 14 Years | 12 (100.0%) | 16 (69.6%) |
| 15 Years | 2 (100.0%) | 6 (100.0%) |
| 16 and 17 Years | 7 (100.0%) | 13 (100.0%) |
| 18 to 24 Years | 10 (100.0%) | 8 (53.3%) |
| 25 to 34 Years | 27 (84.4%) | 17 (100.0%) |
| 35 to 44 Years | 15 (88.2%) | 12 (100.0%) |
| 45 to 54 Years | 34 (94.4%) | 24 (75.0%) |
| 55 to 64 Years | 14 (70.0%) | 15 (60.0%) |
| 65 to 74 Years | 20 (100.0%) | 14 (70.0%) |
| 75 Years and over | 9 (75.0%) | 8 (100.0%) |
| Total | 184 (90.2%) | 167 (78.8%) |
Income Below Poverty Among Married-Couple Families in Derby Acres
The poverty statistics for married-couple families in Derby Acres show that 10.9% or 6 of the total 55 families live below the poverty line. Families with no children have the highest poverty rate of 20.7%, comprising of 6 families. On the other hand, families with 1 or 2 children have the lowest poverty rate of 0.0%, which includes 0 families.
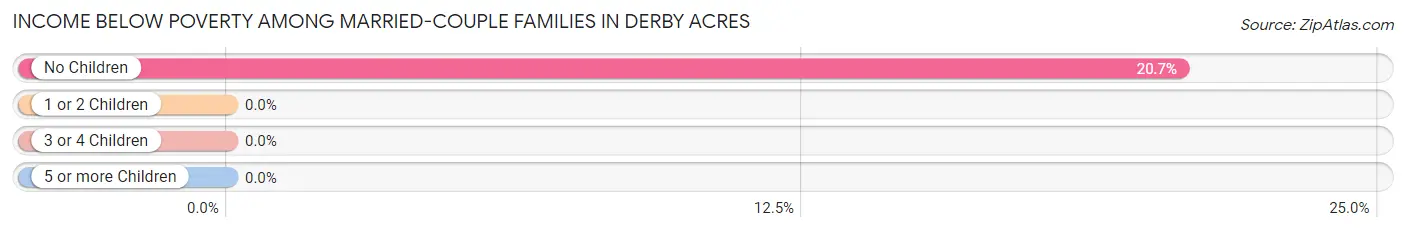
| Children | Above Poverty | Below Poverty |
| No Children | 23 (79.3%) | 6 (20.7%) |
| 1 or 2 Children | 13 (100.0%) | 0 (0.0%) |
| 3 or 4 Children | 7 (100.0%) | 0 (0.0%) |
| 5 or more Children | 6 (100.0%) | 0 (0.0%) |
| Total | 49 (89.1%) | 6 (10.9%) |
Income Below Poverty Among Single-Parent Households in Derby Acres
According to the poverty data in Derby Acres, 10.5% or 2 single-father households and 25.0% or 5 single-mother households are living below the poverty line. Among single-father households, those with 1 or 2 children have the highest poverty rate, with 2 households (25.0%) experiencing poverty. Likewise, among single-mother households, those with 1 or 2 children have the highest poverty rate, with 5 households (62.5%) falling below the poverty line.
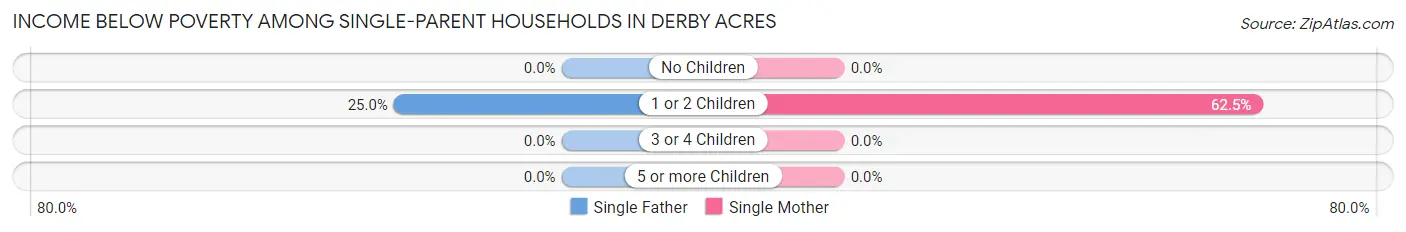
| Children | Single Father | Single Mother |
| No Children | 0 (0.0%) | 0 (0.0%) |
| 1 or 2 Children | 2 (25.0%) | 5 (62.5%) |
| 3 or 4 Children | 0 (0.0%) | 0 (0.0%) |
| 5 or more Children | 0 (0.0%) | 0 (0.0%) |
| Total | 2 (10.5%) | 5 (25.0%) |
Income Below Poverty Among Married-Couple vs Single-Parent Households in Derby Acres
The poverty data for Derby Acres shows that 6 of the married-couple family households (10.9%) and 7 of the single-parent households (17.9%) are living below the poverty level. Within the married-couple family households, those with no children have the highest poverty rate, with 6 households (20.7%) falling below the poverty line. Among the single-parent households, those with 1 or 2 children have the highest poverty rate, with 7 household (43.8%) living below poverty.
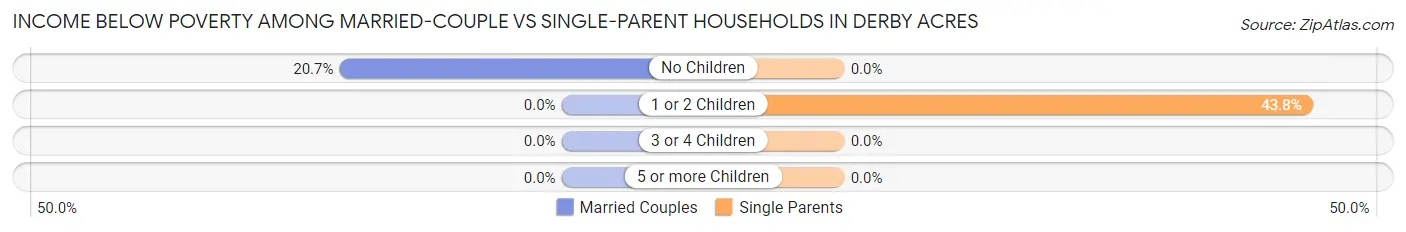
| Children | Married-Couple Families | Single-Parent Households |
| No Children | 6 (20.7%) | 0 (0.0%) |
| 1 or 2 Children | 0 (0.0%) | 7 (43.8%) |
| 3 or 4 Children | 0 (0.0%) | 0 (0.0%) |
| 5 or more Children | 0 (0.0%) | 0 (0.0%) |
| Total | 6 (10.9%) | 7 (17.9%) |
Race in Derby Acres
The most populous races in Derby Acres are White / Caucasian (330 | 79.3%), Hispanic or Latino (74 | 17.8%), and Two or more Races (59 | 14.2%).
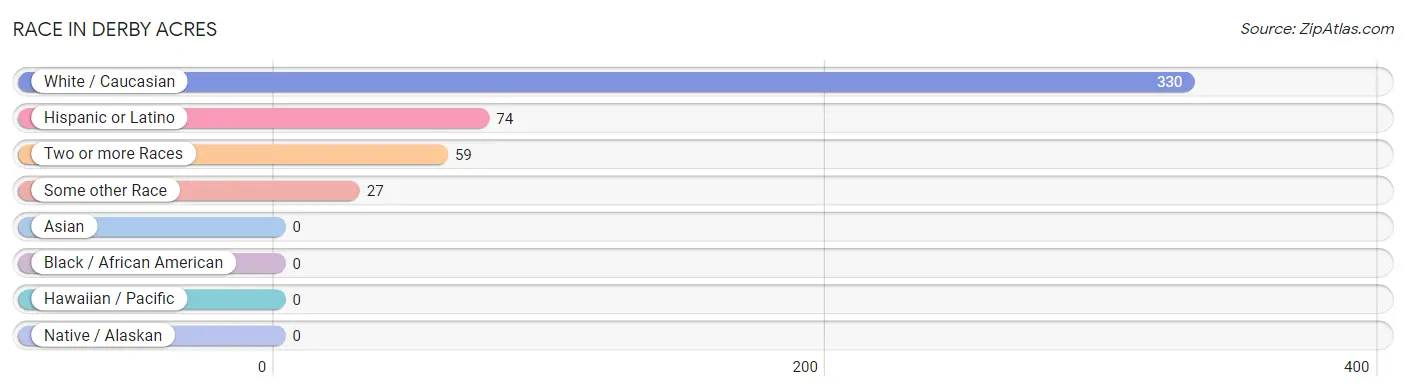
| Race | # Population | % Population |
| Asian | 0 | 0.0% |
| Black / African American | 0 | 0.0% |
| Hawaiian / Pacific | 0 | 0.0% |
| Hispanic or Latino | 74 | 17.8% |
| Native / Alaskan | 0 | 0.0% |
| White / Caucasian | 330 | 79.3% |
| Two or more Races | 59 | 14.2% |
| Some other Race | 27 | 6.5% |
| Total | 416 | 100.0% |
Ancestry in Derby Acres
The most populous ancestries reported in Derby Acres are Irish (55 | 13.2%), German (46 | 11.1%), Mexican (35 | 8.4%), English (22 | 5.3%), and Dutch (20 | 4.8%), together accounting for 42.8% of all Derby Acres residents.
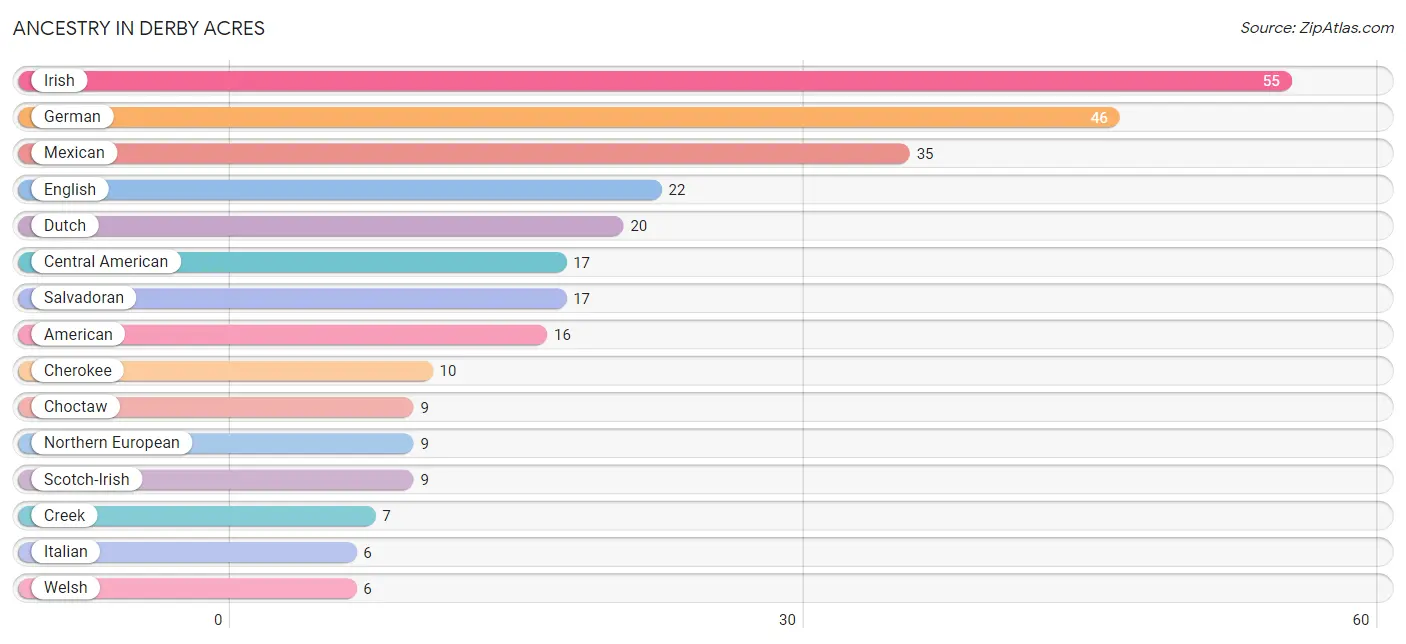
| Ancestry | # Population | % Population |
| American | 16 | 3.8% |
| British | 2 | 0.5% |
| Central American | 17 | 4.1% |
| Cherokee | 10 | 2.4% |
| Choctaw | 9 | 2.2% |
| Creek | 7 | 1.7% |
| Dutch | 20 | 4.8% |
| Eastern European | 3 | 0.7% |
| English | 22 | 5.3% |
| German | 46 | 11.1% |
| Irish | 55 | 13.2% |
| Italian | 6 | 1.4% |
| Mexican | 35 | 8.4% |
| Northern European | 9 | 2.2% |
| Portuguese | 2 | 0.5% |
| Salvadoran | 17 | 4.1% |
| Scotch-Irish | 9 | 2.2% |
| Scottish | 3 | 0.7% |
| Slovak | 2 | 0.5% |
| Welsh | 6 | 1.4% | View All 20 Rows |
Immigrants in Derby Acres
The most numerous immigrant groups reported in Derby Acres came from Central America (40 | 9.6%), Latin America (40 | 9.6%), and Mexico (40 | 9.6%), together accounting for 28.9% of all Derby Acres residents.
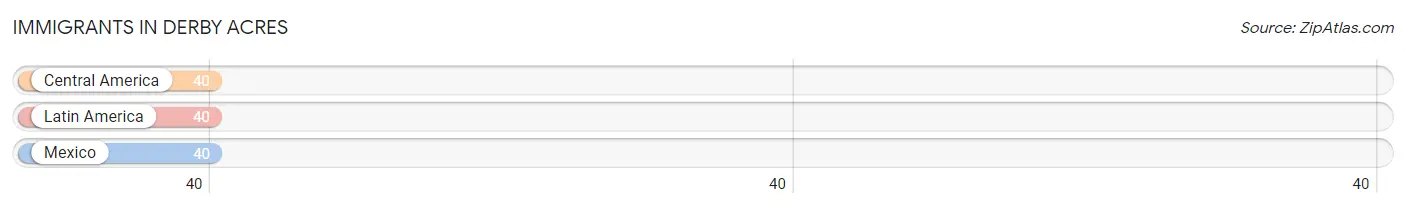
| Immigration Origin | # Population | % Population |
| Central America | 40 | 9.6% |
| Latin America | 40 | 9.6% |
| Mexico | 40 | 9.6% | View All 3 Rows |
Sex and Age in Derby Acres
Sex and Age in Derby Acres
The most populous age groups in Derby Acres are 45 to 49 Years (25 | 12.2%) for men and 10 to 14 Years (39 | 18.4%) for women.
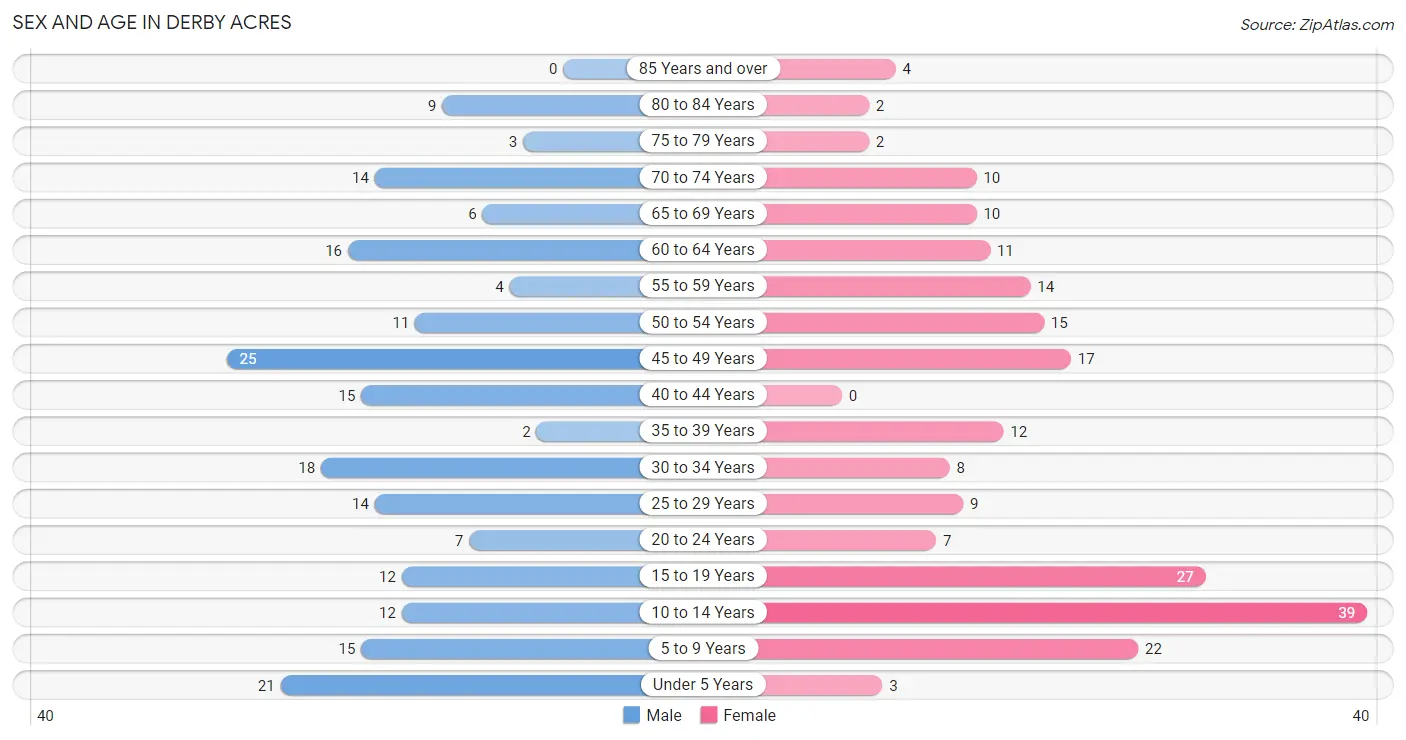
| Age Bracket | Male | Female |
| Under 5 Years | 21 (10.3%) | 3 (1.4%) |
| 5 to 9 Years | 15 (7.3%) | 22 (10.4%) |
| 10 to 14 Years | 12 (5.9%) | 39 (18.4%) |
| 15 to 19 Years | 12 (5.9%) | 27 (12.7%) |
| 20 to 24 Years | 7 (3.4%) | 7 (3.3%) |
| 25 to 29 Years | 14 (6.9%) | 9 (4.3%) |
| 30 to 34 Years | 18 (8.8%) | 8 (3.8%) |
| 35 to 39 Years | 2 (1.0%) | 12 (5.7%) |
| 40 to 44 Years | 15 (7.3%) | 0 (0.0%) |
| 45 to 49 Years | 25 (12.2%) | 17 (8.0%) |
| 50 to 54 Years | 11 (5.4%) | 15 (7.1%) |
| 55 to 59 Years | 4 (2.0%) | 14 (6.6%) |
| 60 to 64 Years | 16 (7.8%) | 11 (5.2%) |
| 65 to 69 Years | 6 (2.9%) | 10 (4.7%) |
| 70 to 74 Years | 14 (6.9%) | 10 (4.7%) |
| 75 to 79 Years | 3 (1.5%) | 2 (0.9%) |
| 80 to 84 Years | 9 (4.4%) | 2 (0.9%) |
| 85 Years and over | 0 (0.0%) | 4 (1.9%) |
| Total | 204 (100.0%) | 212 (100.0%) |
Families and Households in Derby Acres
Median Family Size in Derby Acres
The median family size in Derby Acres is 3.90 persons per family, with single female/mother families (20 | 21.3%) accounting for the largest median family size of 5.1 persons per family. On the other hand, single male/father families (19 | 20.2%) represent the smallest median family size with 3.16 persons per family.
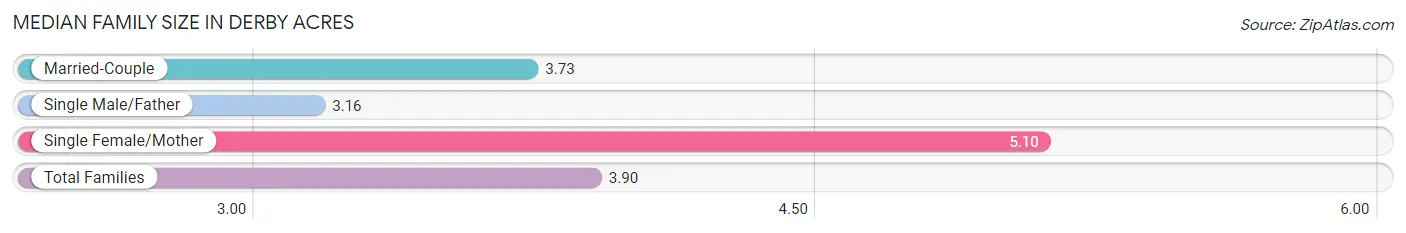
| Family Type | # Families | Family Size |
| Married-Couple | 55 (58.5%) | 3.73 |
| Single Male/Father | 19 (20.2%) | 3.16 |
| Single Female/Mother | 20 (21.3%) | 5.10 |
| Total Families | 94 (100.0%) | 3.90 |
Median Household Size in Derby Acres
The median household size in Derby Acres is 3.18 persons per household, with single female/mother households (20 | 15.3%) accounting for the largest median household size of 5.4 persons per household. non-family households (37 | 28.2%) represent the smallest median household size with 1.16 persons per household.
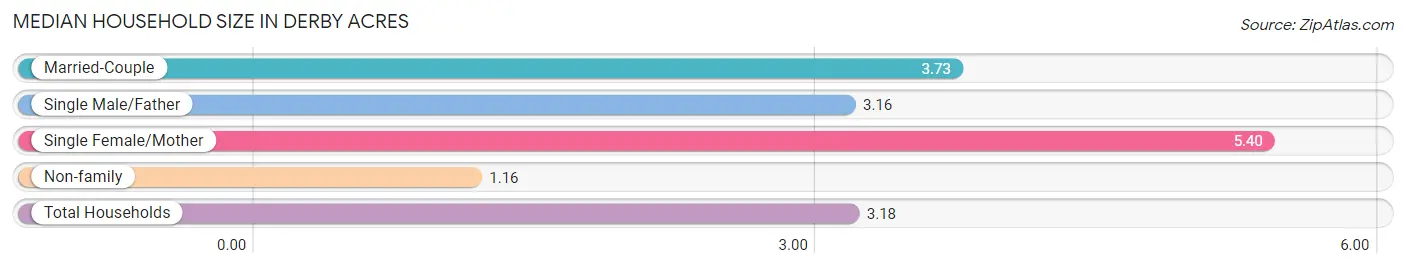
| Household Type | # Households | Household Size |
| Married-Couple | 55 (42.0%) | 3.73 |
| Single Male/Father | 19 (14.5%) | 3.16 |
| Single Female/Mother | 20 (15.3%) | 5.40 |
| Non-family | 37 (28.2%) | 1.16 |
| Total Households | 131 (100.0%) | 3.18 |
Household Size by Marriage Status in Derby Acres
Out of a total of 131 households in Derby Acres, 94 (71.8%) are family households, while 37 (28.2%) are nonfamily households. The most numerous type of family households are 4-person households, comprising 33, and the most common type of nonfamily households are 1-person households, comprising 31.
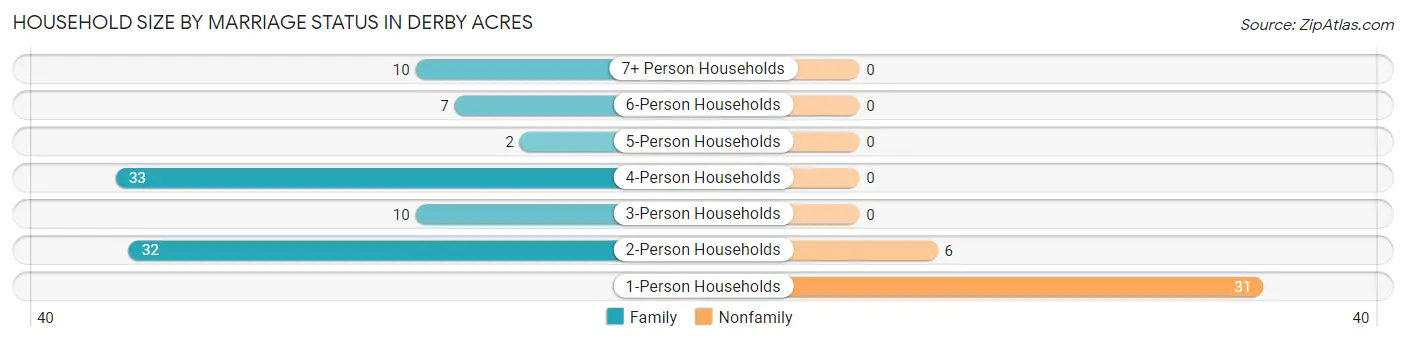
| Household Size | Family Households | Nonfamily Households |
| 1-Person Households | - | 31 (23.7%) |
| 2-Person Households | 32 (24.4%) | 6 (4.6%) |
| 3-Person Households | 10 (7.6%) | 0 (0.0%) |
| 4-Person Households | 33 (25.2%) | 0 (0.0%) |
| 5-Person Households | 2 (1.5%) | 0 (0.0%) |
| 6-Person Households | 7 (5.3%) | 0 (0.0%) |
| 7+ Person Households | 10 (7.6%) | 0 (0.0%) |
| Total | 94 (71.8%) | 37 (28.2%) |
Female Fertility in Derby Acres
Fertility by Age in Derby Acres
Average fertility rate in Derby Acres is 38.0 births per 1,000 women. Women in the age bracket of 20 to 34 years have the highest fertility rate with 125.0 births per 1,000 women. Women in the age bracket of 20 to 34 years acount for 100.0% of all women with births.
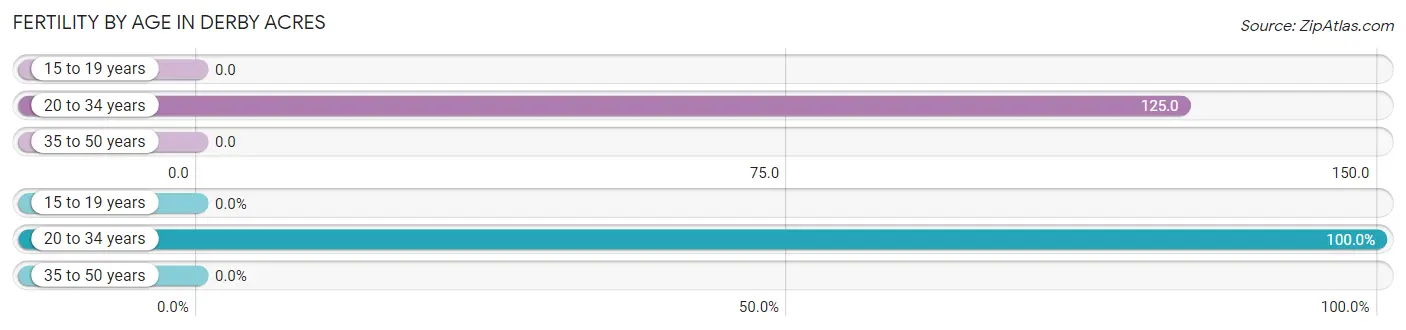
| Age Bracket | Women with Births | Births / 1,000 Women |
| 15 to 19 years | 0 (0.0%) | 0.0 |
| 20 to 34 years | 3 (100.0%) | 125.0 |
| 35 to 50 years | 0 (0.0%) | 0.0 |
| Total | 3 (100.0%) | 38.0 |
Fertility by Age by Marriage Status in Derby Acres
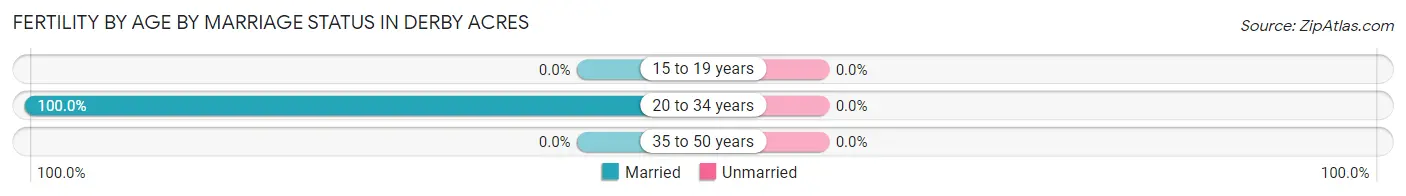
| Age Bracket | Married | Unmarried |
| 15 to 19 years | 0 (0.0%) | 0 (0.0%) |
| 20 to 34 years | 3 (100.0%) | 0 (0.0%) |
| 35 to 50 years | 0 (0.0%) | 0 (0.0%) |
| Total | 3 (100.0%) | 0 (0.0%) |
Fertility by Education in Derby Acres
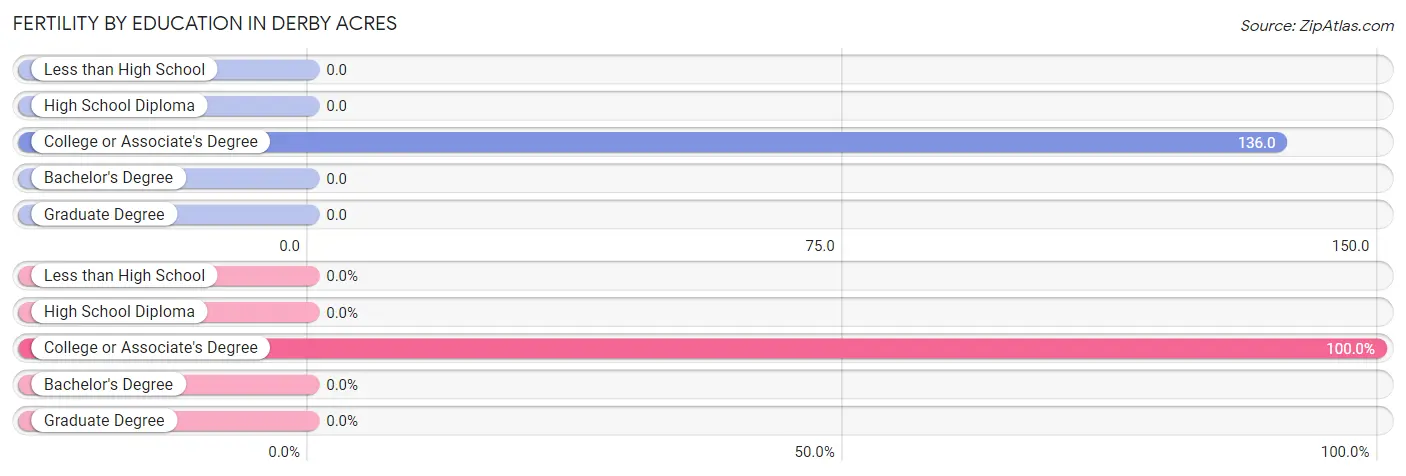
| Educational Attainment | Women with Births | Births / 1,000 Women |
| Less than High School | 0 (0.0%) | 0.0 |
| High School Diploma | 0 (0.0%) | 0.0 |
| College or Associate's Degree | 3 (100.0%) | 136.0 |
| Bachelor's Degree | 0 (0.0%) | 0.0 |
| Graduate Degree | 0 (0.0%) | 0.0 |
| Total | 3 (100.0%) | 38.0 |
Fertility by Education by Marriage Status in Derby Acres
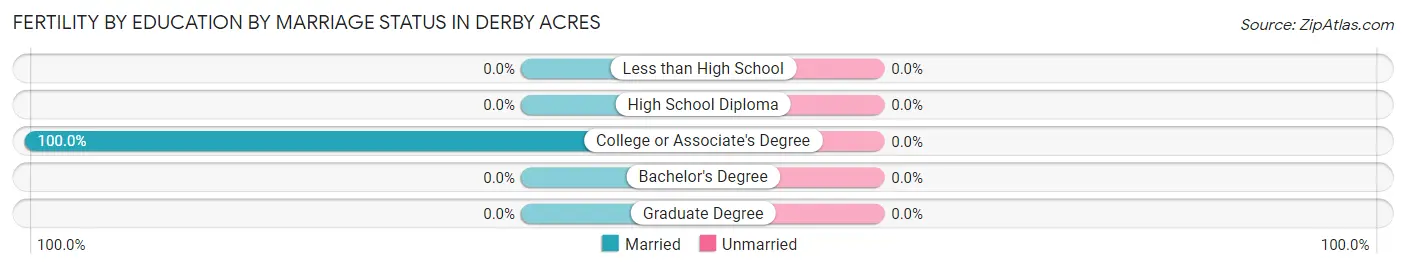
| Educational Attainment | Married | Unmarried |
| Less than High School | 0 (0.0%) | 0 (0.0%) |
| High School Diploma | 0 (0.0%) | 0 (0.0%) |
| College or Associate's Degree | 3 (100.0%) | 0 (0.0%) |
| Bachelor's Degree | 0 (0.0%) | 0 (0.0%) |
| Graduate Degree | 0 (0.0%) | 0 (0.0%) |
| Total | 3 (100.0%) | 0 (0.0%) |
Employment Characteristics in Derby Acres
Employment by Class of Employer in Derby Acres
Among the 127 employed individuals in Derby Acres, private company employees (107 | 84.3%), local government employees (18 | 14.2%), and state government employees (2 | 1.6%) make up the most common classes of employment.
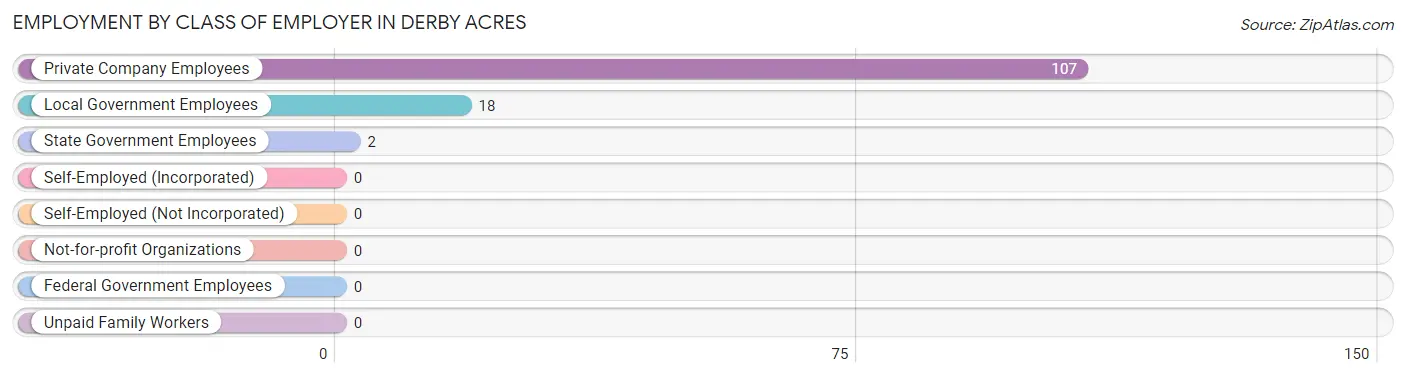
| Employer Class | # Employees | % Employees |
| Private Company Employees | 107 | 84.3% |
| Self-Employed (Incorporated) | 0 | 0.0% |
| Self-Employed (Not Incorporated) | 0 | 0.0% |
| Not-for-profit Organizations | 0 | 0.0% |
| Local Government Employees | 18 | 14.2% |
| State Government Employees | 2 | 1.6% |
| Federal Government Employees | 0 | 0.0% |
| Unpaid Family Workers | 0 | 0.0% |
| Total | 127 | 100.0% |
Employment Status by Age in Derby Acres
According to the labor force statistics for Derby Acres, out of the total population over 16 years of age (296), 51.4% or 152 individuals are in the labor force, with 16.4% or 25 of them unemployed. The age group with the highest labor force participation rate is 20 to 24 years, with 100.0% or 14 individuals in the labor force. Within the labor force, the 75 years and over age range has the highest percentage of unemployed individuals, with 100.0% or 7 of them being unemployed.
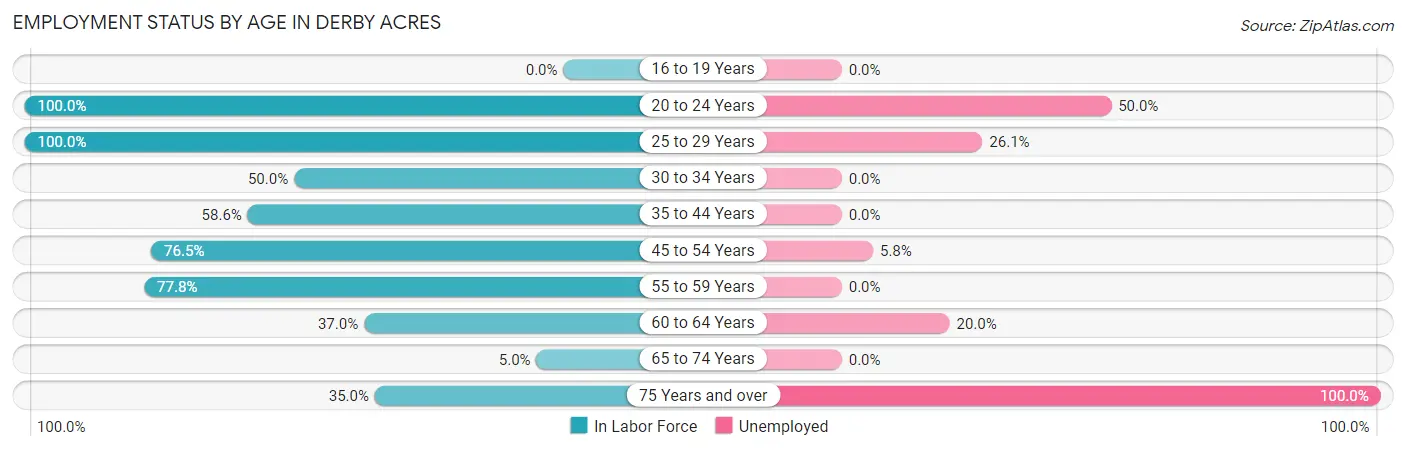
| Age Bracket | In Labor Force | Unemployed |
| 16 to 19 Years | 0 (0.0%) | 0 (0.0%) |
| 20 to 24 Years | 14 (100.0%) | 7 (50.0%) |
| 25 to 29 Years | 23 (100.0%) | 6 (26.1%) |
| 30 to 34 Years | 13 (50.0%) | 0 (0.0%) |
| 35 to 44 Years | 17 (58.6%) | 0 (0.0%) |
| 45 to 54 Years | 52 (76.5%) | 3 (5.8%) |
| 55 to 59 Years | 14 (77.8%) | 0 (0.0%) |
| 60 to 64 Years | 10 (37.0%) | 2 (20.0%) |
| 65 to 74 Years | 2 (5.0%) | 0 (0.0%) |
| 75 Years and over | 7 (35.0%) | 7 (100.0%) |
| Total | 152 (51.4%) | 25 (16.4%) |
Employment Status by Educational Attainment in Derby Acres
According to labor force statistics for Derby Acres, 67.5% of individuals (129) out of the total population between 25 and 64 years of age (191) are in the labor force, with 8.5% or 11 of them being unemployed. The group with the highest labor force participation rate are those with the educational attainment of college / associate degree, with 71.4% or 40 individuals in the labor force. Within the labor force, individuals with bachelor's degree or higher education have the highest percentage of unemployment, with 100.0% or 2 of them being unemployed.
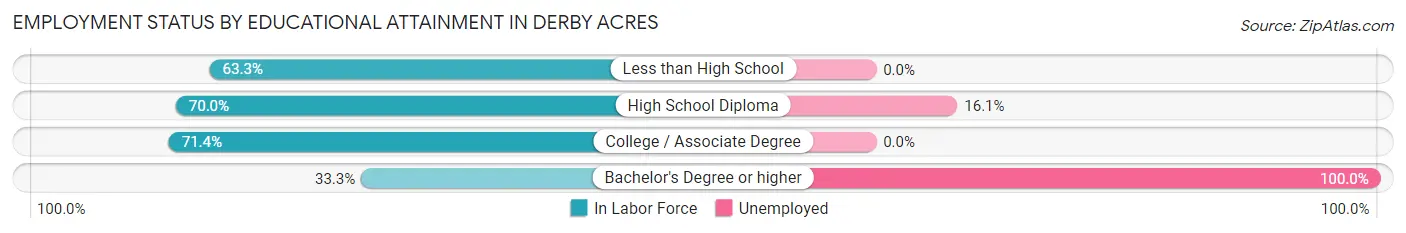
| Educational Attainment | In Labor Force | Unemployed |
| Less than High School | 31 (63.3%) | 0 (0.0%) |
| High School Diploma | 56 (70.0%) | 13 (16.1%) |
| College / Associate Degree | 40 (71.4%) | 0 (0.0%) |
| Bachelor's Degree or higher | 2 (33.3%) | 6 (100.0%) |
| Total | 129 (67.5%) | 16 (8.5%) |
Employment Occupations by Sex in Derby Acres
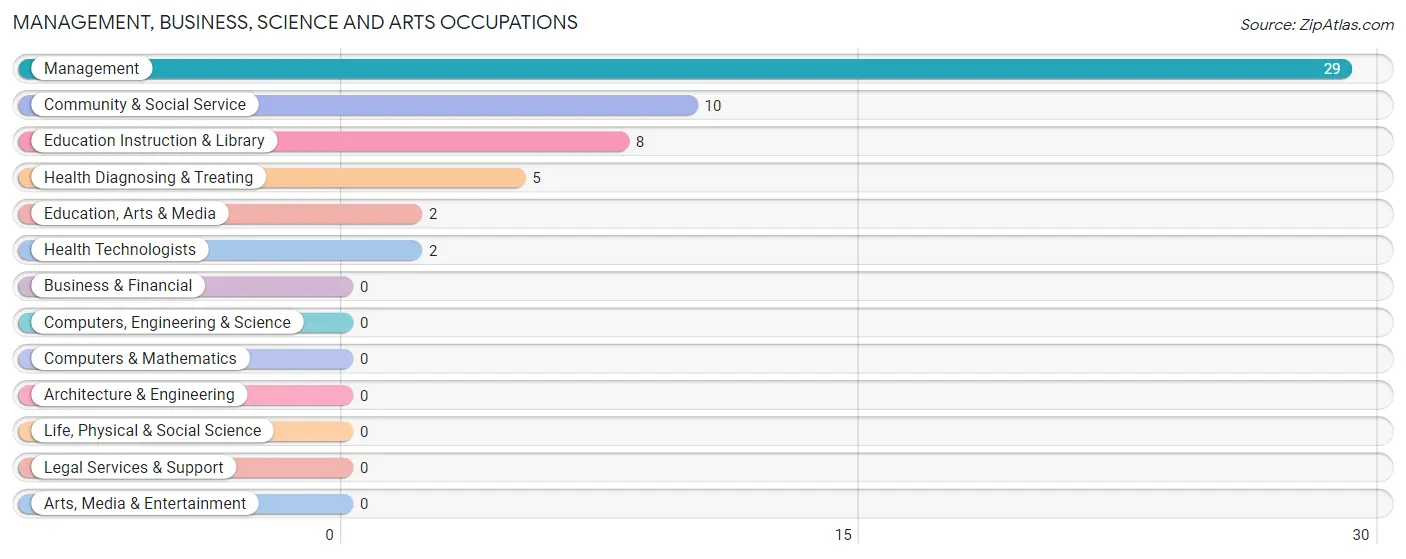
Management, Business, Science and Arts Occupations
The most common Management, Business, Science and Arts occupations in Derby Acres are Management (29 | 22.8%), Community & Social Service (10 | 7.9%), Education Instruction & Library (8 | 6.3%), Health Diagnosing & Treating (5 | 3.9%), and Education, Arts & Media (2 | 1.6%).
Management, Business, Science and Arts Occupations by Sex
Within the Management, Business, Science and Arts occupations in Derby Acres, the most male-oriented occupations are Health Technologists (100.0%), Management (79.3%), and Health Diagnosing & Treating (40.0%), while the most female-oriented occupations are Community & Social Service (100.0%), Education, Arts & Media (100.0%), and Education Instruction & Library (100.0%).
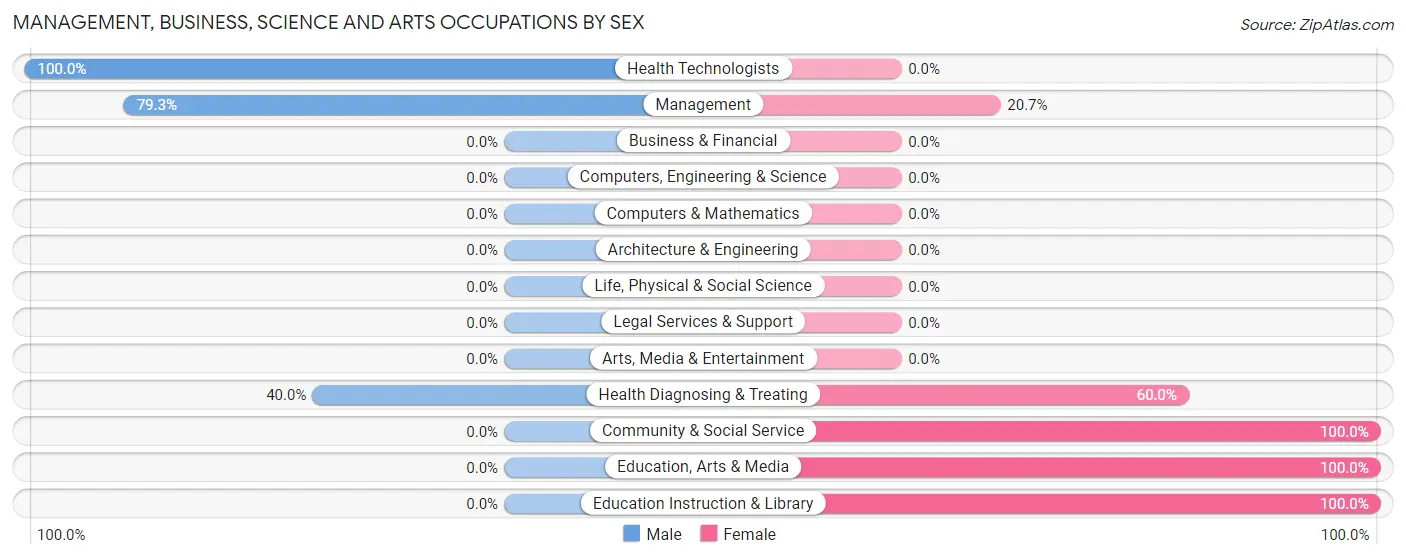
| Occupation | Male | Female |
| Management | 23 (79.3%) | 6 (20.7%) |
| Business & Financial | 0 (0.0%) | 0 (0.0%) |
| Computers, Engineering & Science | 0 (0.0%) | 0 (0.0%) |
| Computers & Mathematics | 0 (0.0%) | 0 (0.0%) |
| Architecture & Engineering | 0 (0.0%) | 0 (0.0%) |
| Life, Physical & Social Science | 0 (0.0%) | 0 (0.0%) |
| Community & Social Service | 0 (0.0%) | 10 (100.0%) |
| Education, Arts & Media | 0 (0.0%) | 2 (100.0%) |
| Legal Services & Support | 0 (0.0%) | 0 (0.0%) |
| Education Instruction & Library | 0 (0.0%) | 8 (100.0%) |
| Arts, Media & Entertainment | 0 (0.0%) | 0 (0.0%) |
| Health Diagnosing & Treating | 2 (40.0%) | 3 (60.0%) |
| Health Technologists | 2 (100.0%) | 0 (0.0%) |
| Total (Category) | 25 (56.8%) | 19 (43.2%) |
| Total (Overall) | 88 (69.3%) | 39 (30.7%) |
Services Occupations
The most common Services occupations in Derby Acres are Food Preparation & Serving (7 | 5.5%), Cleaning & Maintenance (6 | 4.7%), and Personal Care & Service (3 | 2.4%).
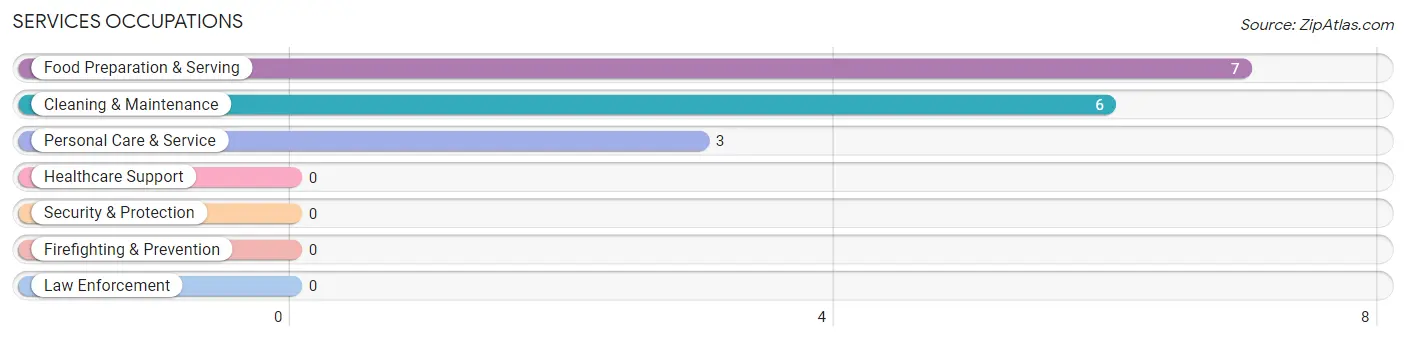
Services Occupations by Sex
Within the Services occupations in Derby Acres, the most male-oriented occupations are Cleaning & Maintenance (100.0%), and Food Preparation & Serving (28.6%), while the most female-oriented occupations are Personal Care & Service (100.0%), and Food Preparation & Serving (71.4%).
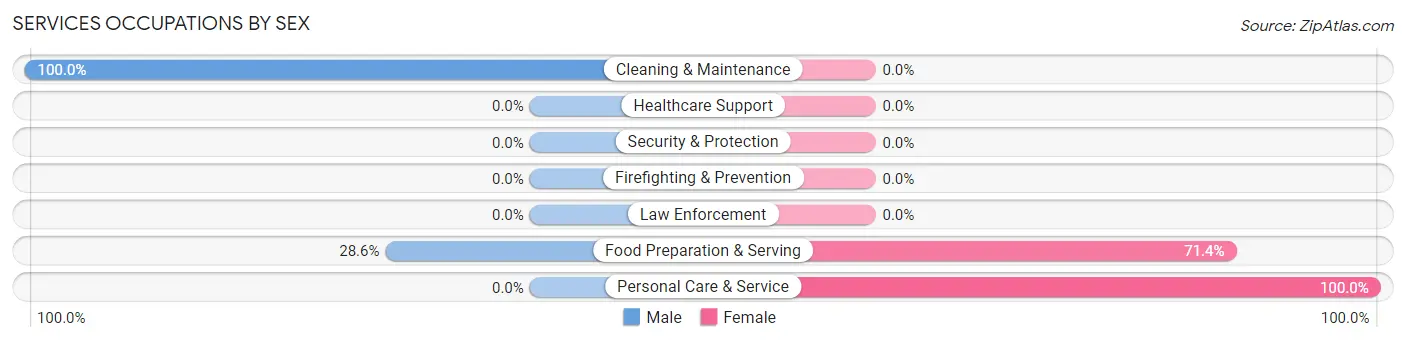
| Occupation | Male | Female |
| Healthcare Support | 0 (0.0%) | 0 (0.0%) |
| Security & Protection | 0 (0.0%) | 0 (0.0%) |
| Firefighting & Prevention | 0 (0.0%) | 0 (0.0%) |
| Law Enforcement | 0 (0.0%) | 0 (0.0%) |
| Food Preparation & Serving | 2 (28.6%) | 5 (71.4%) |
| Cleaning & Maintenance | 6 (100.0%) | 0 (0.0%) |
| Personal Care & Service | 0 (0.0%) | 3 (100.0%) |
| Total (Category) | 8 (50.0%) | 8 (50.0%) |
| Total (Overall) | 88 (69.3%) | 39 (30.7%) |
Sales and Office Occupations
The most common Sales and Office occupations in Derby Acres are Office & Administration (7 | 5.5%), and Sales & Related (3 | 2.4%).
Sales and Office Occupations by Sex
| Occupation | Male | Female |
| Sales & Related | 3 (100.0%) | 0 (0.0%) |
| Office & Administration | 0 (0.0%) | 7 (100.0%) |
| Total (Category) | 3 (30.0%) | 7 (70.0%) |
| Total (Overall) | 88 (69.3%) | 39 (30.7%) |
Natural Resources, Construction and Maintenance Occupations
The most common Natural Resources, Construction and Maintenance occupations in Derby Acres are Farming, Fishing & Forestry (24 | 18.9%), Construction & Extraction (9 | 7.1%), and Installation, Maintenance & Repair (4 | 3.2%).
Natural Resources, Construction and Maintenance Occupations by Sex
| Occupation | Male | Female |
| Farming, Fishing & Forestry | 19 (79.2%) | 5 (20.8%) |
| Construction & Extraction | 9 (100.0%) | 0 (0.0%) |
| Installation, Maintenance & Repair | 4 (100.0%) | 0 (0.0%) |
| Total (Category) | 32 (86.5%) | 5 (13.5%) |
| Total (Overall) | 88 (69.3%) | 39 (30.7%) |
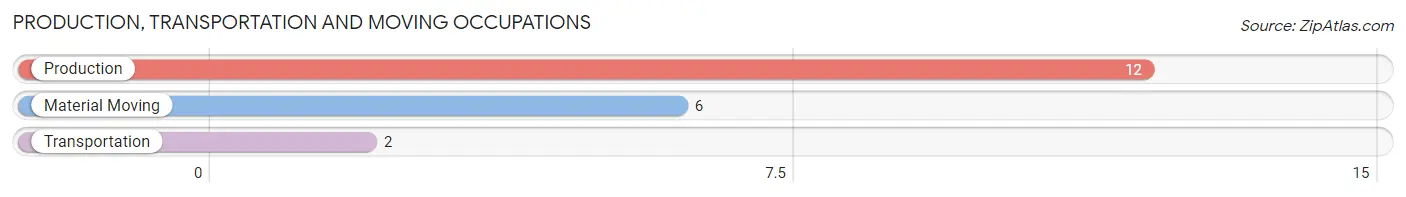
Production, Transportation and Moving Occupations
The most common Production, Transportation and Moving occupations in Derby Acres are Production (12 | 9.5%), Material Moving (6 | 4.7%), and Transportation (2 | 1.6%).
Production, Transportation and Moving Occupations by Sex
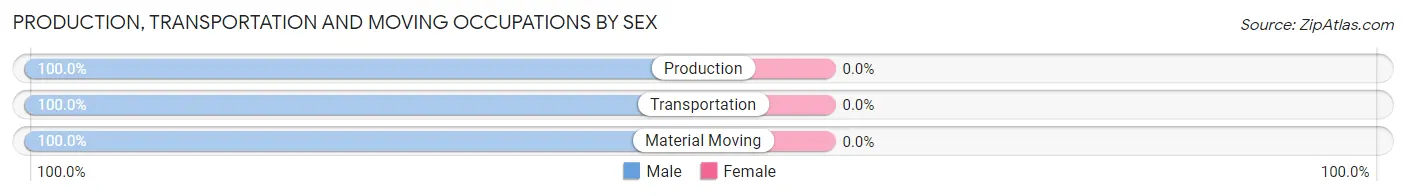
| Occupation | Male | Female |
| Production | 12 (100.0%) | 0 (0.0%) |
| Transportation | 2 (100.0%) | 0 (0.0%) |
| Material Moving | 6 (100.0%) | 0 (0.0%) |
| Total (Category) | 20 (100.0%) | 0 (0.0%) |
| Total (Overall) | 88 (69.3%) | 39 (30.7%) |
Employment Industries by Sex in Derby Acres
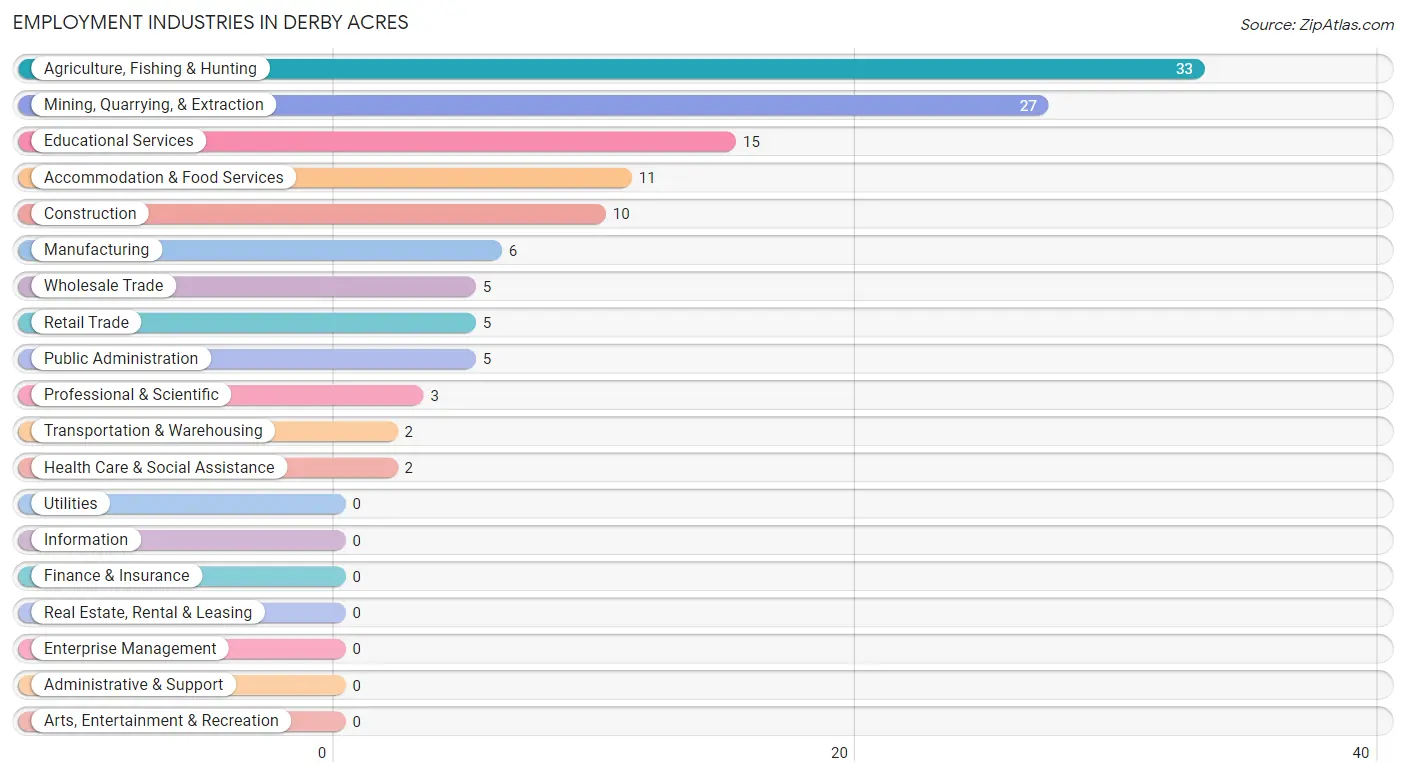
Employment Industries in Derby Acres
The major employment industries in Derby Acres include Agriculture, Fishing & Hunting (33 | 26.0%), Mining, Quarrying, & Extraction (27 | 21.3%), Educational Services (15 | 11.8%), Accommodation & Food Services (11 | 8.7%), and Construction (10 | 7.9%).
Employment Industries by Sex in Derby Acres
The Derby Acres industries that see more men than women are Mining, Quarrying, & Extraction (100.0%), Manufacturing (100.0%), and Wholesale Trade (100.0%), whereas the industries that tend to have a higher number of women are Professional & Scientific (100.0%), Educational Services (86.7%), and Accommodation & Food Services (45.5%).
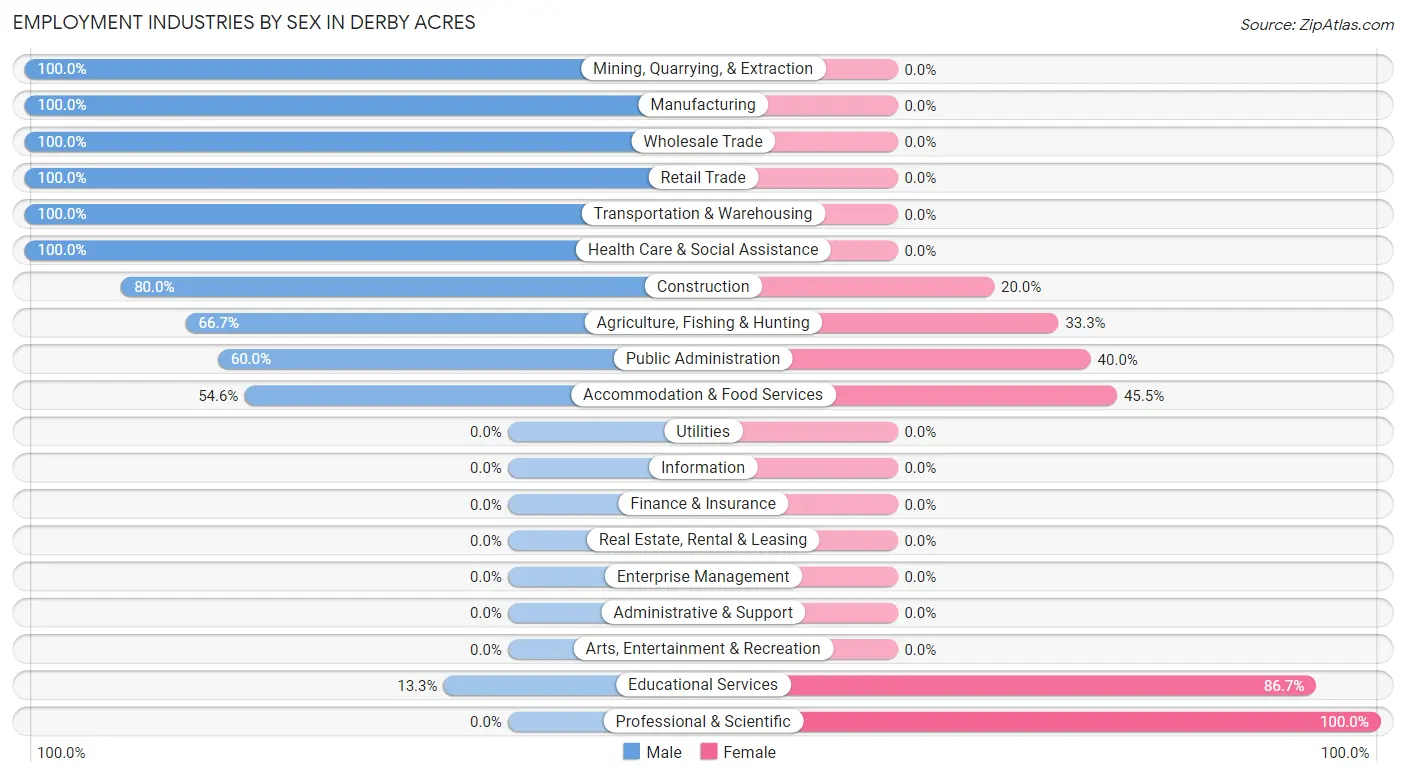
| Industry | Male | Female |
| Agriculture, Fishing & Hunting | 22 (66.7%) | 11 (33.3%) |
| Mining, Quarrying, & Extraction | 27 (100.0%) | 0 (0.0%) |
| Construction | 8 (80.0%) | 2 (20.0%) |
| Manufacturing | 6 (100.0%) | 0 (0.0%) |
| Wholesale Trade | 5 (100.0%) | 0 (0.0%) |
| Retail Trade | 5 (100.0%) | 0 (0.0%) |
| Transportation & Warehousing | 2 (100.0%) | 0 (0.0%) |
| Utilities | 0 (0.0%) | 0 (0.0%) |
| Information | 0 (0.0%) | 0 (0.0%) |
| Finance & Insurance | 0 (0.0%) | 0 (0.0%) |
| Real Estate, Rental & Leasing | 0 (0.0%) | 0 (0.0%) |
| Professional & Scientific | 0 (0.0%) | 3 (100.0%) |
| Enterprise Management | 0 (0.0%) | 0 (0.0%) |
| Administrative & Support | 0 (0.0%) | 0 (0.0%) |
| Educational Services | 2 (13.3%) | 13 (86.7%) |
| Health Care & Social Assistance | 2 (100.0%) | 0 (0.0%) |
| Arts, Entertainment & Recreation | 0 (0.0%) | 0 (0.0%) |
| Accommodation & Food Services | 6 (54.5%) | 5 (45.5%) |
| Public Administration | 3 (60.0%) | 2 (40.0%) |
| Total | 88 (69.3%) | 39 (30.7%) |
Education in Derby Acres
School Enrollment in Derby Acres
The most common levels of schooling among the 134 students in Derby Acres are middle school (43 | 32.1%), elementary school (37 | 27.6%), and high school (36 | 26.9%).
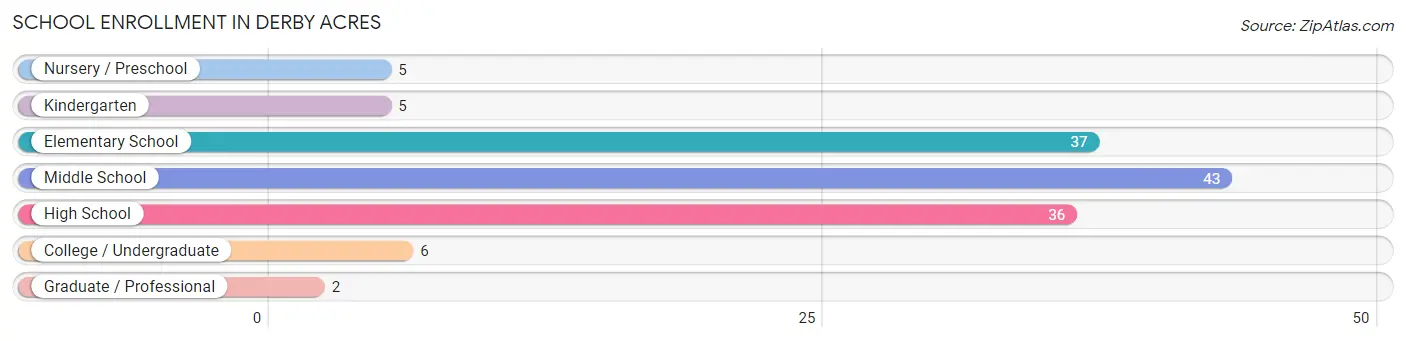
| School Level | # Students | % Students |
| Nursery / Preschool | 5 | 3.7% |
| Kindergarten | 5 | 3.7% |
| Elementary School | 37 | 27.6% |
| Middle School | 43 | 32.1% |
| High School | 36 | 26.9% |
| College / Undergraduate | 6 | 4.5% |
| Graduate / Professional | 2 | 1.5% |
| Total | 134 | 100.0% |
School Enrollment by Age by Funding Source in Derby Acres
Out of a total of 134 students who are enrolled in schools in Derby Acres, 5 (3.7%) attend a private institution, while the remaining 129 (96.3%) are enrolled in public schools. The age group of 35 years and over has the highest likelihood of being enrolled in private schools, with 2 (100.0% in the age bracket) enrolled. Conversely, the age group of 3 to 4 year olds has the lowest likelihood of being enrolled in a private school, with 10 (100.0% in the age bracket) attending a public institution.
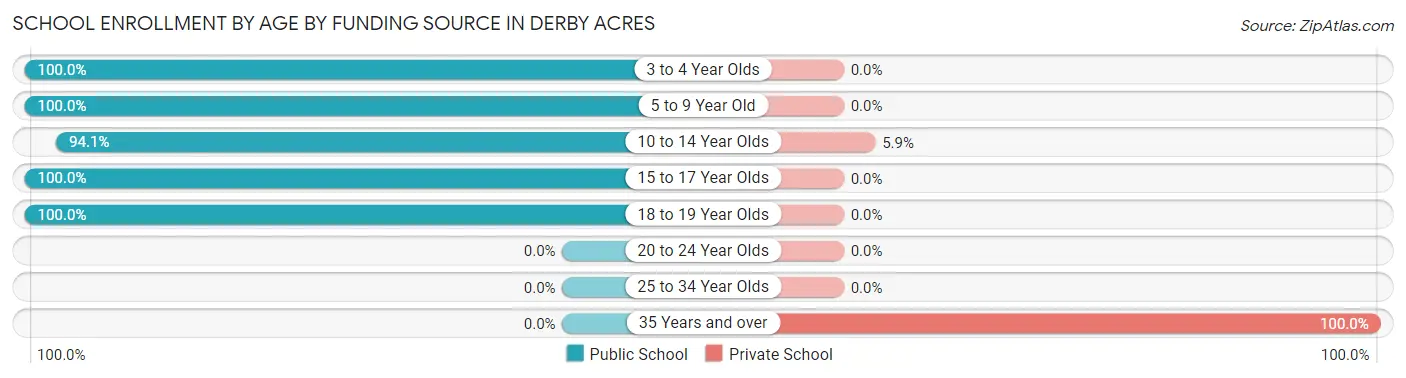
| Age Bracket | Public School | Private School |
| 3 to 4 Year Olds | 10 (100.0%) | 0 (0.0%) |
| 5 to 9 Year Old | 37 (100.0%) | 0 (0.0%) |
| 10 to 14 Year Olds | 48 (94.1%) | 3 (5.9%) |
| 15 to 17 Year Olds | 28 (100.0%) | 0 (0.0%) |
| 18 to 19 Year Olds | 6 (100.0%) | 0 (0.0%) |
| 20 to 24 Year Olds | 0 (0.0%) | 0 (0.0%) |
| 25 to 34 Year Olds | 0 (0.0%) | 0 (0.0%) |
| 35 Years and over | 0 (0.0%) | 2 (100.0%) |
| Total | 129 (96.3%) | 5 (3.7%) |
Educational Attainment by Field of Study in Derby Acres
Computers & mathematics (2 | 22.2%), physical & health sciences (2 | 22.2%), business (2 | 22.2%), education (2 | 22.2%), and arts & humanities (1 | 11.1%) are the most common fields of study among 9 individuals in Derby Acres who have obtained a bachelor's degree or higher.
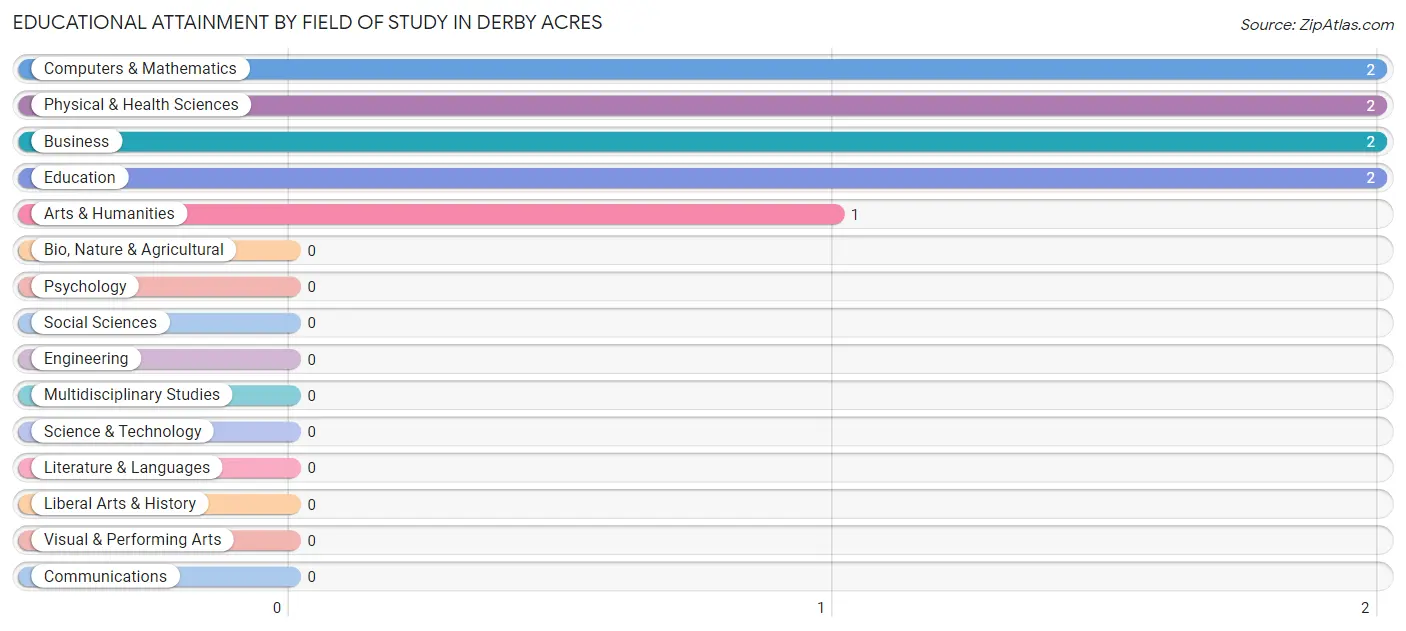
| Field of Study | # Graduates | % Graduates |
| Computers & Mathematics | 2 | 22.2% |
| Bio, Nature & Agricultural | 0 | 0.0% |
| Physical & Health Sciences | 2 | 22.2% |
| Psychology | 0 | 0.0% |
| Social Sciences | 0 | 0.0% |
| Engineering | 0 | 0.0% |
| Multidisciplinary Studies | 0 | 0.0% |
| Science & Technology | 0 | 0.0% |
| Business | 2 | 22.2% |
| Education | 2 | 22.2% |
| Literature & Languages | 0 | 0.0% |
| Liberal Arts & History | 0 | 0.0% |
| Visual & Performing Arts | 0 | 0.0% |
| Communications | 0 | 0.0% |
| Arts & Humanities | 1 | 11.1% |
| Total | 9 | 100.0% |
Transportation & Commute in Derby Acres
Vehicle Availability by Sex in Derby Acres
The most prevalent vehicle ownership categories in Derby Acres are males with 2 vehicles (45, accounting for 51.1%) and females with 2 vehicles (15, making up 115.4%).
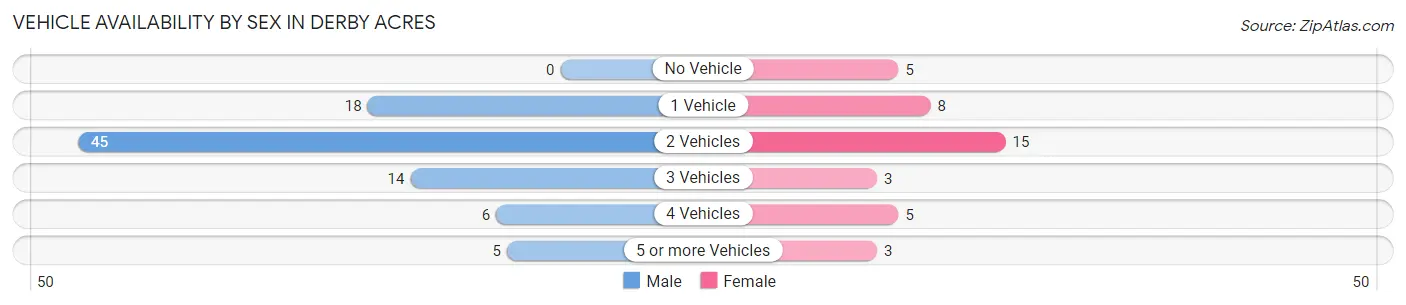
| Vehicles Available | Male | Female |
| No Vehicle | 0 (0.0%) | 5 (12.8%) |
| 1 Vehicle | 18 (20.4%) | 8 (20.5%) |
| 2 Vehicles | 45 (51.1%) | 15 (38.5%) |
| 3 Vehicles | 14 (15.9%) | 3 (7.7%) |
| 4 Vehicles | 6 (6.8%) | 5 (12.8%) |
| 5 or more Vehicles | 5 (5.7%) | 3 (7.7%) |
| Total | 88 (100.0%) | 39 (100.0%) |
Commute Time in Derby Acres
The most frequently occuring commute durations in Derby Acres are 30 to 34 minutes (24 commuters, 18.9%), 15 to 19 minutes (23 commuters, 18.1%), and 10 to 14 minutes (21 commuters, 16.5%).
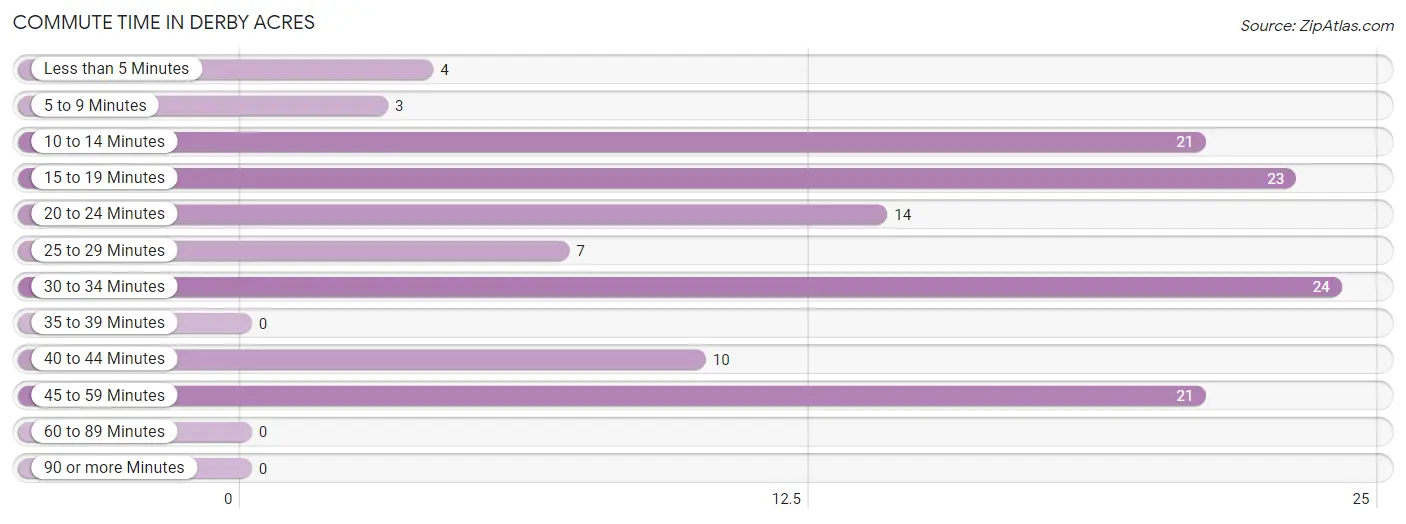
| Commute Time | # Commuters | % Commuters |
| Less than 5 Minutes | 4 | 3.2% |
| 5 to 9 Minutes | 3 | 2.4% |
| 10 to 14 Minutes | 21 | 16.5% |
| 15 to 19 Minutes | 23 | 18.1% |
| 20 to 24 Minutes | 14 | 11.0% |
| 25 to 29 Minutes | 7 | 5.5% |
| 30 to 34 Minutes | 24 | 18.9% |
| 35 to 39 Minutes | 0 | 0.0% |
| 40 to 44 Minutes | 10 | 7.9% |
| 45 to 59 Minutes | 21 | 16.5% |
| 60 to 89 Minutes | 0 | 0.0% |
| 90 or more Minutes | 0 | 0.0% |
Commute Time by Sex in Derby Acres
The most common commute times in Derby Acres are 10 to 14 minutes (18 commuters, 20.4%) for males and 15 to 19 minutes (9 commuters, 23.1%) for females.
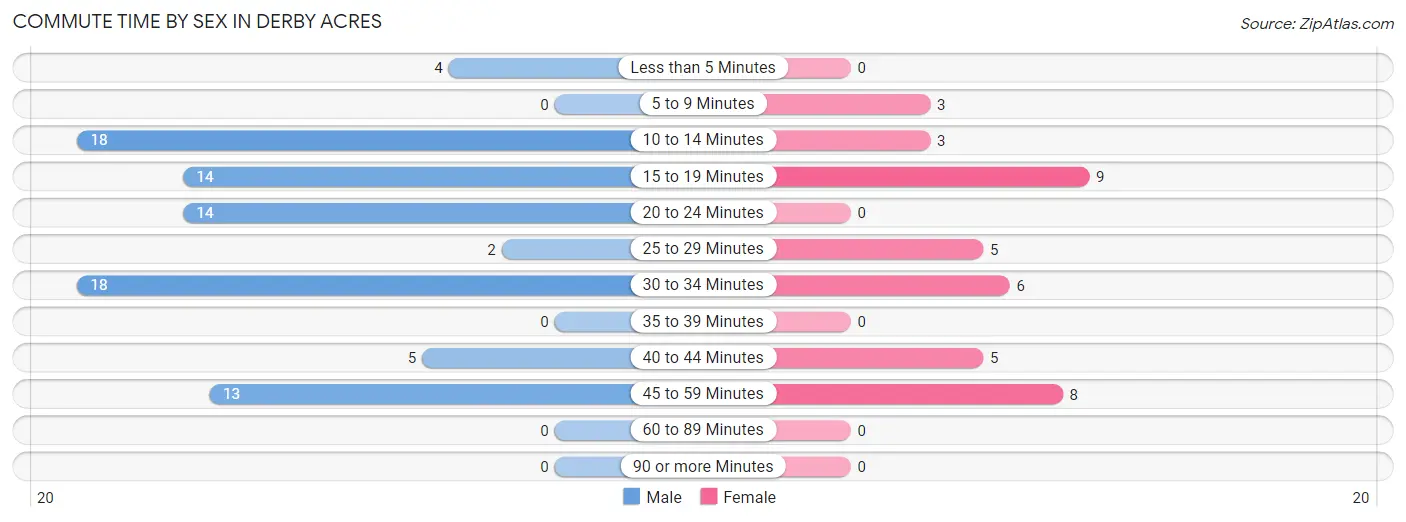
| Commute Time | Male | Female |
| Less than 5 Minutes | 4 (4.5%) | 0 (0.0%) |
| 5 to 9 Minutes | 0 (0.0%) | 3 (7.7%) |
| 10 to 14 Minutes | 18 (20.4%) | 3 (7.7%) |
| 15 to 19 Minutes | 14 (15.9%) | 9 (23.1%) |
| 20 to 24 Minutes | 14 (15.9%) | 0 (0.0%) |
| 25 to 29 Minutes | 2 (2.3%) | 5 (12.8%) |
| 30 to 34 Minutes | 18 (20.4%) | 6 (15.4%) |
| 35 to 39 Minutes | 0 (0.0%) | 0 (0.0%) |
| 40 to 44 Minutes | 5 (5.7%) | 5 (12.8%) |
| 45 to 59 Minutes | 13 (14.8%) | 8 (20.5%) |
| 60 to 89 Minutes | 0 (0.0%) | 0 (0.0%) |
| 90 or more Minutes | 0 (0.0%) | 0 (0.0%) |
Time of Departure to Work by Sex in Derby Acres
The most frequent times of departure to work in Derby Acres are 6:00 AM to 6:29 AM (34, 38.6%) for males and 6:00 AM to 6:29 AM (13, 33.3%) for females.
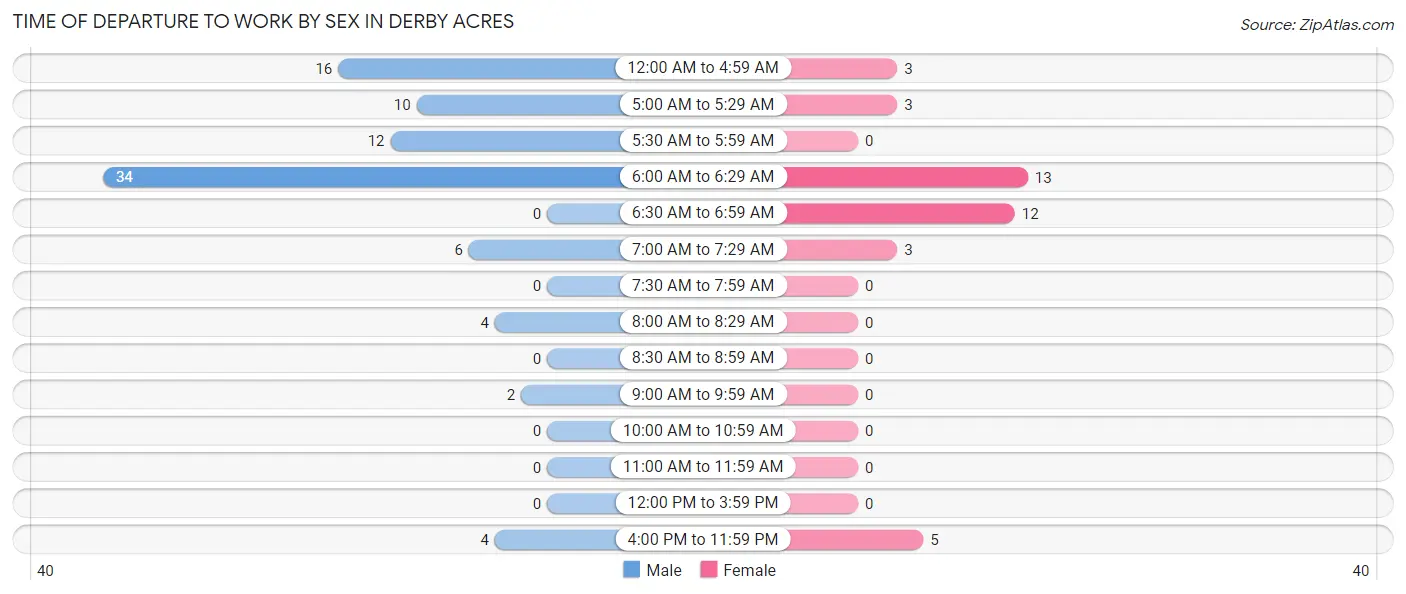
| Time of Departure | Male | Female |
| 12:00 AM to 4:59 AM | 16 (18.2%) | 3 (7.7%) |
| 5:00 AM to 5:29 AM | 10 (11.4%) | 3 (7.7%) |
| 5:30 AM to 5:59 AM | 12 (13.6%) | 0 (0.0%) |
| 6:00 AM to 6:29 AM | 34 (38.6%) | 13 (33.3%) |
| 6:30 AM to 6:59 AM | 0 (0.0%) | 12 (30.8%) |
| 7:00 AM to 7:29 AM | 6 (6.8%) | 3 (7.7%) |
| 7:30 AM to 7:59 AM | 0 (0.0%) | 0 (0.0%) |
| 8:00 AM to 8:29 AM | 4 (4.5%) | 0 (0.0%) |
| 8:30 AM to 8:59 AM | 0 (0.0%) | 0 (0.0%) |
| 9:00 AM to 9:59 AM | 2 (2.3%) | 0 (0.0%) |
| 10:00 AM to 10:59 AM | 0 (0.0%) | 0 (0.0%) |
| 11:00 AM to 11:59 AM | 0 (0.0%) | 0 (0.0%) |
| 12:00 PM to 3:59 PM | 0 (0.0%) | 0 (0.0%) |
| 4:00 PM to 11:59 PM | 4 (4.5%) | 5 (12.8%) |
| Total | 88 (100.0%) | 39 (100.0%) |
Housing Occupancy in Derby Acres
Occupancy by Ownership in Derby Acres
Of the total 131 dwellings in Derby Acres, owner-occupied units account for 103 (78.6%), while renter-occupied units make up 28 (21.4%).
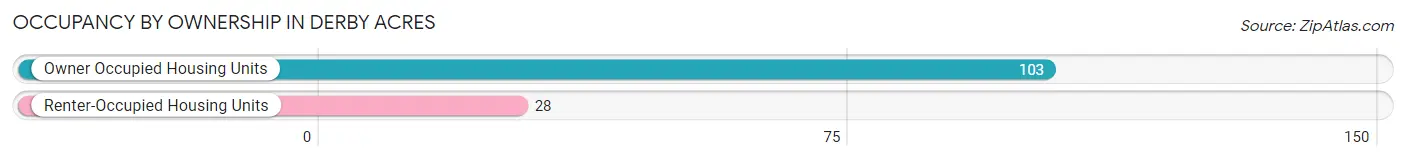
| Occupancy | # Housing Units | % Housing Units |
| Owner Occupied Housing Units | 103 | 78.6% |
| Renter-Occupied Housing Units | 28 | 21.4% |
| Total Occupied Housing Units | 131 | 100.0% |
Occupancy by Household Size in Derby Acres
| Household Size | # Housing Units | % Housing Units |
| 1-Person Household | 31 | 23.7% |
| 2-Person Household | 38 | 29.0% |
| 3-Person Household | 10 | 7.6% |
| 4+ Person Household | 52 | 39.7% |
| Total Housing Units | 131 | 100.0% |
Occupancy by Ownership by Household Size in Derby Acres
| Household Size | Owner-occupied | Renter-occupied |
| 1-Person Household | 29 (93.5%) | 2 (6.5%) |
| 2-Person Household | 38 (100.0%) | 0 (0.0%) |
| 3-Person Household | 2 (20.0%) | 8 (80.0%) |
| 4+ Person Household | 34 (65.4%) | 18 (34.6%) |
| Total Housing Units | 103 (78.6%) | 28 (21.4%) |
Occupancy by Educational Attainment in Derby Acres
| Household Size | Owner-occupied | Renter-occupied |
| Less than High School | 26 (78.8%) | 7 (21.2%) |
| High School Diploma | 19 (57.6%) | 14 (42.4%) |
| College/Associate Degree | 51 (87.9%) | 7 (12.1%) |
| Bachelor's Degree or higher | 7 (100.0%) | 0 (0.0%) |
Occupancy by Age of Householder in Derby Acres
| Age Bracket | # Households | % Households |
| Under 35 Years | 14 | 10.7% |
| 35 to 44 Years | 13 | 9.9% |
| 45 to 54 Years | 40 | 30.5% |
| 55 to 64 Years | 26 | 19.9% |
| 65 to 74 Years | 27 | 20.6% |
| 75 to 84 Years | 7 | 5.3% |
| 85 Years and Over | 4 | 3.0% |
| Total | 131 | 100.0% |
Housing Finances in Derby Acres
Median Income by Occupancy in Derby Acres
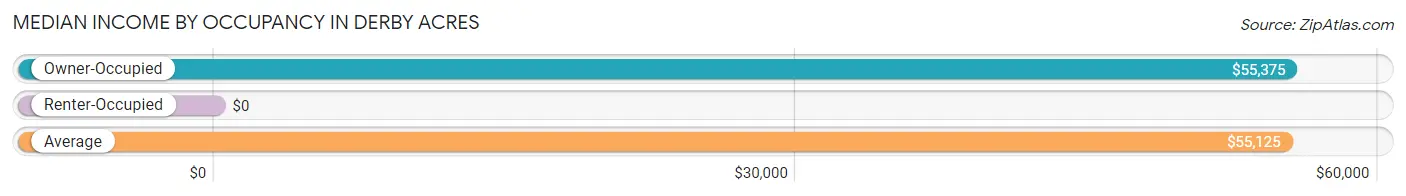
| Occupancy Type | # Households | Median Income |
| Owner-Occupied | 103 (78.6%) | $55,375 |
| Renter-Occupied | 28 (21.4%) | $0 |
| Average | 131 (100.0%) | $55,125 |
Occupancy by Householder Income Bracket in Derby Acres
| Income Bracket | Owner-occupied | Renter-occupied |
| Less than $5,000 | 10 (9.7%) | 2 (7.1%) |
| $5,000 to $9,999 | 7 (6.8%) | 0 (0.0%) |
| $10,000 to $14,999 | 2 (1.9%) | 0 (0.0%) |
| $15,000 to $19,999 | 9 (8.7%) | 0 (0.0%) |
| $20,000 to $24,999 | 2 (1.9%) | 0 (0.0%) |
| $25,000 to $34,999 | 2 (1.9%) | 2 (7.1%) |
| $35,000 to $49,999 | 14 (13.6%) | 11 (39.3%) |
| $50,000 to $74,999 | 17 (16.5%) | 0 (0.0%) |
| $75,000 to $99,999 | 16 (15.5%) | 5 (17.9%) |
| $100,000 to $149,999 | 14 (13.6%) | 8 (28.6%) |
| $150,000 or more | 10 (9.7%) | 0 (0.0%) |
| Total | 103 (100.0%) | 28 (100.0%) |
Monthly Housing Cost Tiers in Derby Acres
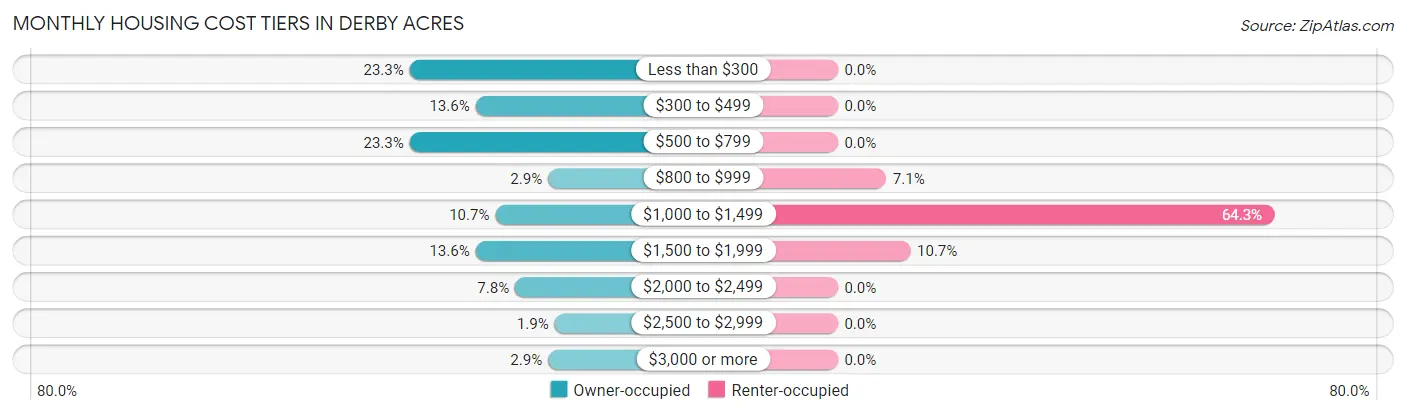
| Monthly Cost | Owner-occupied | Renter-occupied |
| Less than $300 | 24 (23.3%) | 0 (0.0%) |
| $300 to $499 | 14 (13.6%) | 0 (0.0%) |
| $500 to $799 | 24 (23.3%) | 0 (0.0%) |
| $800 to $999 | 3 (2.9%) | 2 (7.1%) |
| $1,000 to $1,499 | 11 (10.7%) | 18 (64.3%) |
| $1,500 to $1,999 | 14 (13.6%) | 3 (10.7%) |
| $2,000 to $2,499 | 8 (7.8%) | 0 (0.0%) |
| $2,500 to $2,999 | 2 (1.9%) | 0 (0.0%) |
| $3,000 or more | 3 (2.9%) | 0 (0.0%) |
| Total | 103 (100.0%) | 28 (100.0%) |
Physical Housing Characteristics in Derby Acres
Housing Structures in Derby Acres
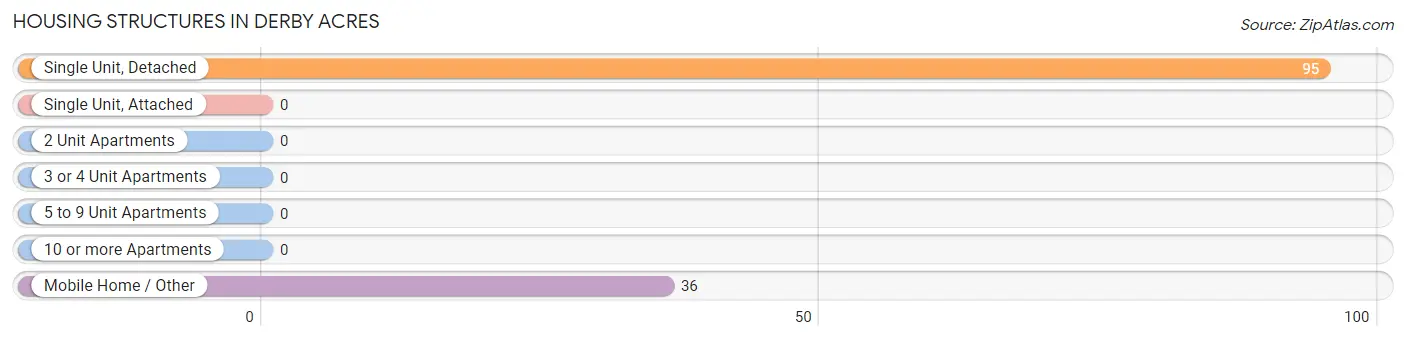
| Structure Type | # Housing Units | % Housing Units |
| Single Unit, Detached | 95 | 72.5% |
| Single Unit, Attached | 0 | 0.0% |
| 2 Unit Apartments | 0 | 0.0% |
| 3 or 4 Unit Apartments | 0 | 0.0% |
| 5 to 9 Unit Apartments | 0 | 0.0% |
| 10 or more Apartments | 0 | 0.0% |
| Mobile Home / Other | 36 | 27.5% |
| Total | 131 | 100.0% |
Housing Structures by Occupancy in Derby Acres
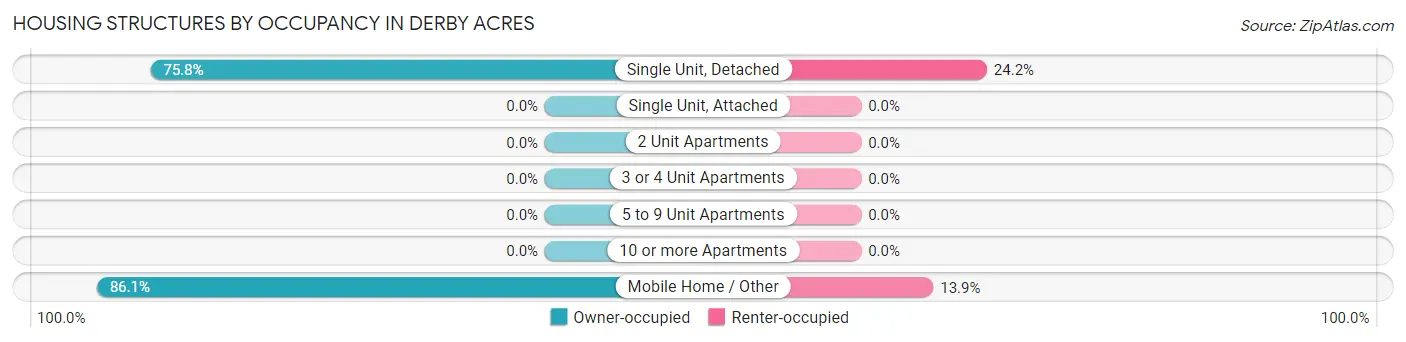
| Structure Type | Owner-occupied | Renter-occupied |
| Single Unit, Detached | 72 (75.8%) | 23 (24.2%) |
| Single Unit, Attached | 0 (0.0%) | 0 (0.0%) |
| 2 Unit Apartments | 0 (0.0%) | 0 (0.0%) |
| 3 or 4 Unit Apartments | 0 (0.0%) | 0 (0.0%) |
| 5 to 9 Unit Apartments | 0 (0.0%) | 0 (0.0%) |
| 10 or more Apartments | 0 (0.0%) | 0 (0.0%) |
| Mobile Home / Other | 31 (86.1%) | 5 (13.9%) |
| Total | 103 (78.6%) | 28 (21.4%) |
Housing Structures by Number of Rooms in Derby Acres
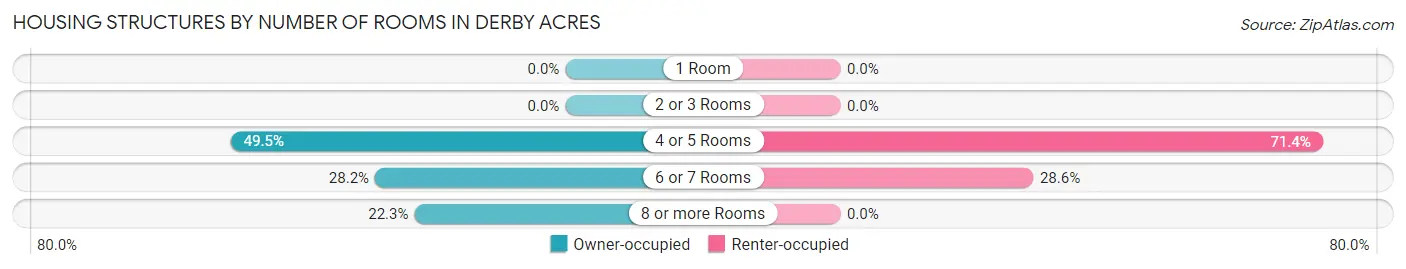
| Number of Rooms | Owner-occupied | Renter-occupied |
| 1 Room | 0 (0.0%) | 0 (0.0%) |
| 2 or 3 Rooms | 0 (0.0%) | 0 (0.0%) |
| 4 or 5 Rooms | 51 (49.5%) | 20 (71.4%) |
| 6 or 7 Rooms | 29 (28.2%) | 8 (28.6%) |
| 8 or more Rooms | 23 (22.3%) | 0 (0.0%) |
| Total | 103 (100.0%) | 28 (100.0%) |
Housing Structure by Heating Type in Derby Acres
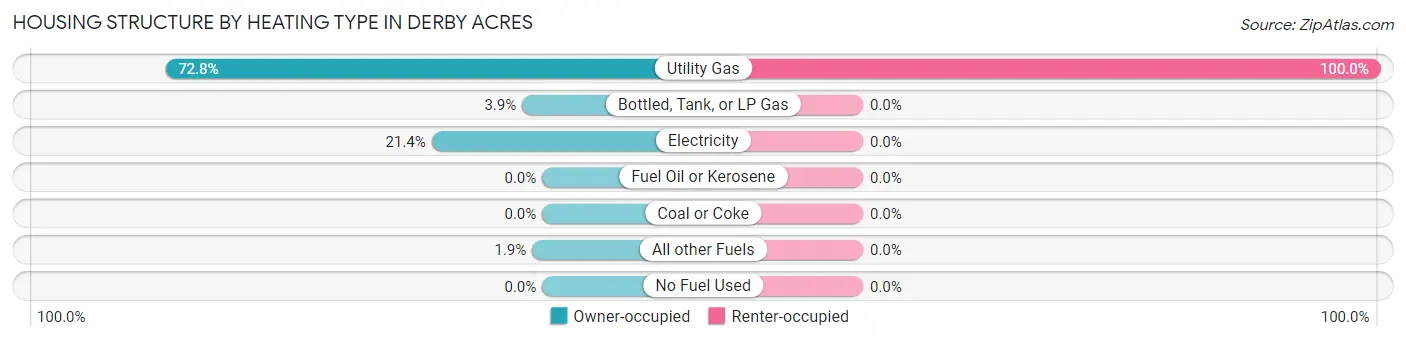
| Heating Type | Owner-occupied | Renter-occupied |
| Utility Gas | 75 (72.8%) | 28 (100.0%) |
| Bottled, Tank, or LP Gas | 4 (3.9%) | 0 (0.0%) |
| Electricity | 22 (21.4%) | 0 (0.0%) |
| Fuel Oil or Kerosene | 0 (0.0%) | 0 (0.0%) |
| Coal or Coke | 0 (0.0%) | 0 (0.0%) |
| All other Fuels | 2 (1.9%) | 0 (0.0%) |
| No Fuel Used | 0 (0.0%) | 0 (0.0%) |
| Total | 103 (100.0%) | 28 (100.0%) |
Household Vehicle Usage in Derby Acres
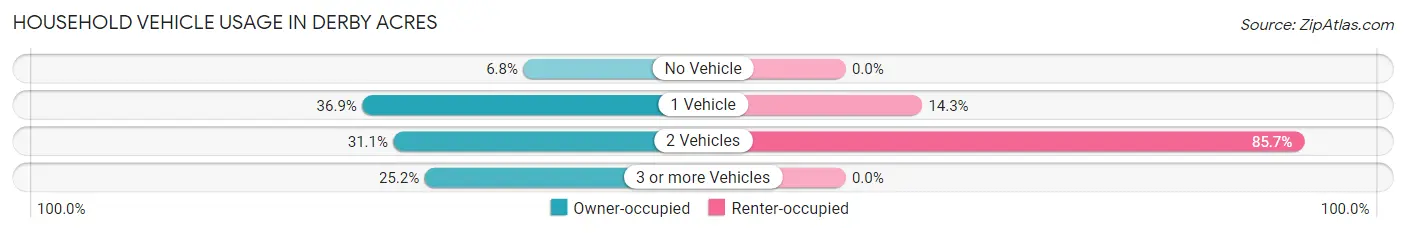
| Vehicles per Household | Owner-occupied | Renter-occupied |
| No Vehicle | 7 (6.8%) | 0 (0.0%) |
| 1 Vehicle | 38 (36.9%) | 4 (14.3%) |
| 2 Vehicles | 32 (31.1%) | 24 (85.7%) |
| 3 or more Vehicles | 26 (25.2%) | 0 (0.0%) |
| Total | 103 (100.0%) | 28 (100.0%) |
Real Estate & Mortgages in Derby Acres
Real Estate and Mortgage Overview in Derby Acres
| Characteristic | Without Mortgage | With Mortgage |
| Housing Units | 57 | 46 |
| Median Property Value | $107,800 | $228,900 |
| Median Household Income | $53,125 | $8 |
| Monthly Housing Costs | $345 | $3 |
| Real Estate Taxes | $717 | $0 |
Property Value by Mortgage Status in Derby Acres
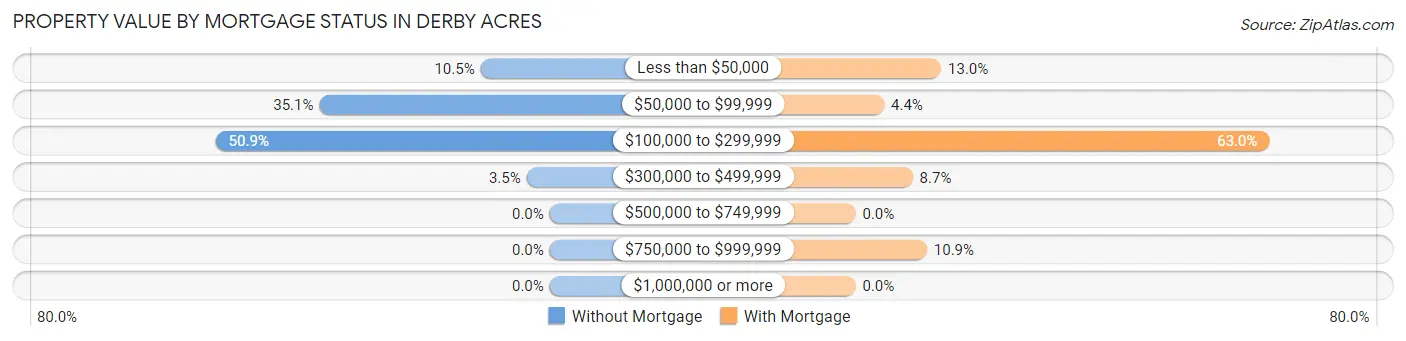
| Property Value | Without Mortgage | With Mortgage |
| Less than $50,000 | 6 (10.5%) | 6 (13.0%) |
| $50,000 to $99,999 | 20 (35.1%) | 2 (4.3%) |
| $100,000 to $299,999 | 29 (50.9%) | 29 (63.0%) |
| $300,000 to $499,999 | 2 (3.5%) | 4 (8.7%) |
| $500,000 to $749,999 | 0 (0.0%) | 0 (0.0%) |
| $750,000 to $999,999 | 0 (0.0%) | 5 (10.9%) |
| $1,000,000 or more | 0 (0.0%) | 0 (0.0%) |
| Total | 57 (100.0%) | 46 (100.0%) |
Household Income by Mortgage Status in Derby Acres
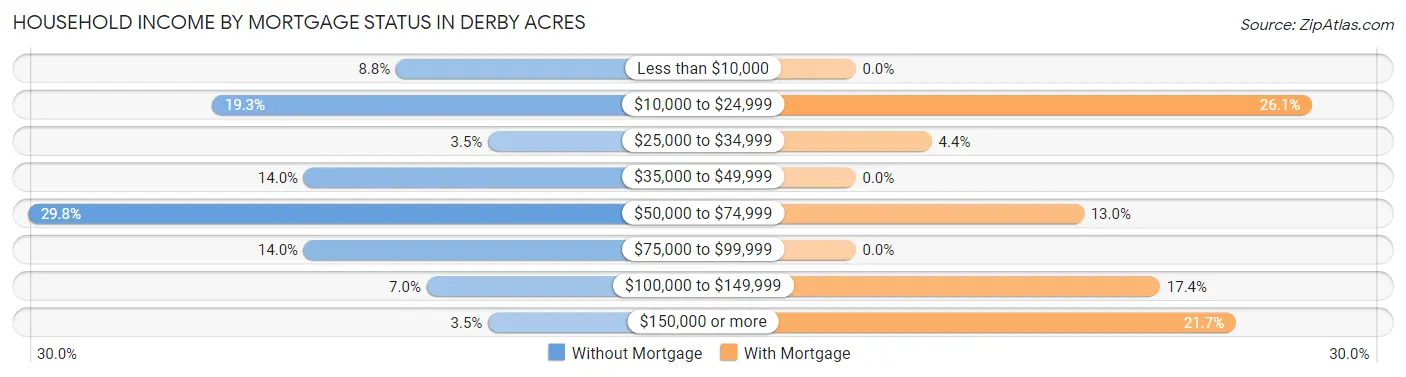
| Household Income | Without Mortgage | With Mortgage |
| Less than $10,000 | 5 (8.8%) | 0 (0.0%) |
| $10,000 to $24,999 | 11 (19.3%) | 12 (26.1%) |
| $25,000 to $34,999 | 2 (3.5%) | 2 (4.3%) |
| $35,000 to $49,999 | 8 (14.0%) | 0 (0.0%) |
| $50,000 to $74,999 | 17 (29.8%) | 6 (13.0%) |
| $75,000 to $99,999 | 8 (14.0%) | 0 (0.0%) |
| $100,000 to $149,999 | 4 (7.0%) | 8 (17.4%) |
| $150,000 or more | 2 (3.5%) | 10 (21.7%) |
| Total | 57 (100.0%) | 46 (100.0%) |
Property Value to Household Income Ratio in Derby Acres
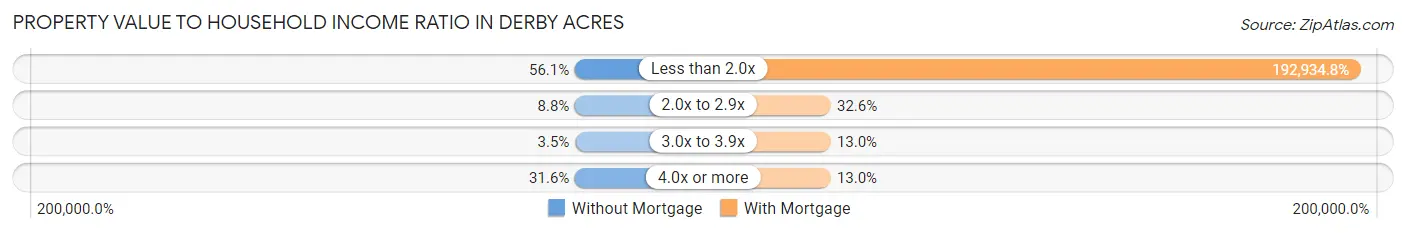
| Value-to-Income Ratio | Without Mortgage | With Mortgage |
| Less than 2.0x | 32 (56.1%) | 88,750 (192,934.8%) |
| 2.0x to 2.9x | 5 (8.8%) | 15 (32.6%) |
| 3.0x to 3.9x | 2 (3.5%) | 6 (13.0%) |
| 4.0x or more | 18 (31.6%) | 6 (13.0%) |
| Total | 57 (100.0%) | 46 (100.0%) |
Real Estate Taxes by Mortgage Status in Derby Acres
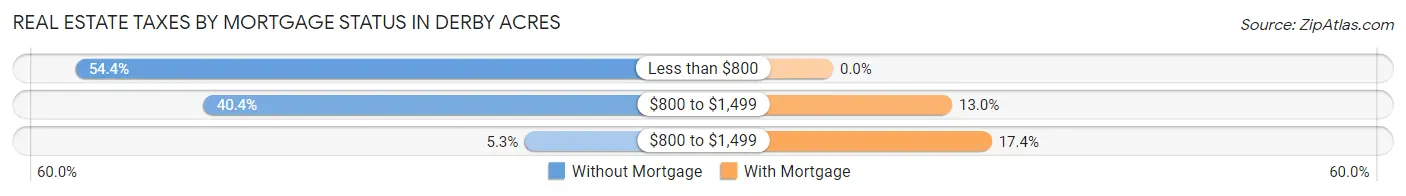
| Property Taxes | Without Mortgage | With Mortgage |
| Less than $800 | 31 (54.4%) | 0 (0.0%) |
| $800 to $1,499 | 23 (40.4%) | 6 (13.0%) |
| $800 to $1,499 | 3 (5.3%) | 8 (17.4%) |
| Total | 57 (100.0%) | 46 (100.0%) |
Health & Disability in Derby Acres
Health Insurance Coverage by Age in Derby Acres

| Age Bracket | With Coverage | Without Coverage |
| Under 6 Years | 30 (100.0%) | 0 (0.0%) |
| 6 to 18 Years | 111 (95.7%) | 5 (4.3%) |
| 19 to 25 Years | 12 (63.2%) | 7 (36.8%) |
| 26 to 34 Years | 37 (75.5%) | 12 (24.5%) |
| 35 to 44 Years | 27 (93.1%) | 2 (6.9%) |
| 45 to 54 Years | 63 (92.6%) | 5 (7.3%) |
| 55 to 64 Years | 35 (77.8%) | 10 (22.2%) |
| 65 to 74 Years | 40 (100.0%) | 0 (0.0%) |
| 75 Years and older | 13 (65.0%) | 7 (35.0%) |
| Total | 368 (88.5%) | 48 (11.5%) |
Health Insurance Coverage by Citizenship Status in Derby Acres
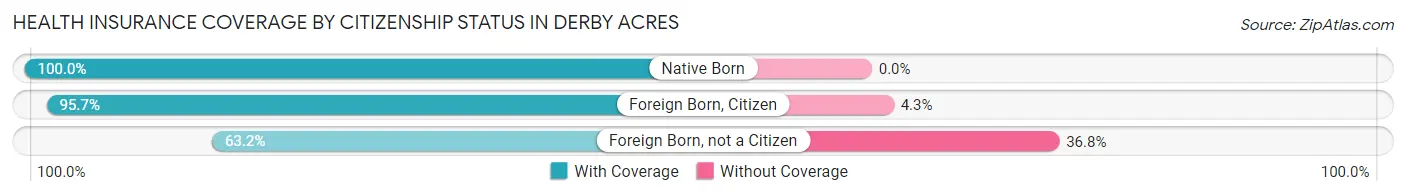
| Citizenship Status | With Coverage | Without Coverage |
| Native Born | 30 (100.0%) | 0 (0.0%) |
| Foreign Born, Citizen | 111 (95.7%) | 5 (4.3%) |
| Foreign Born, not a Citizen | 12 (63.2%) | 7 (36.8%) |
Health Insurance Coverage by Household Income in Derby Acres
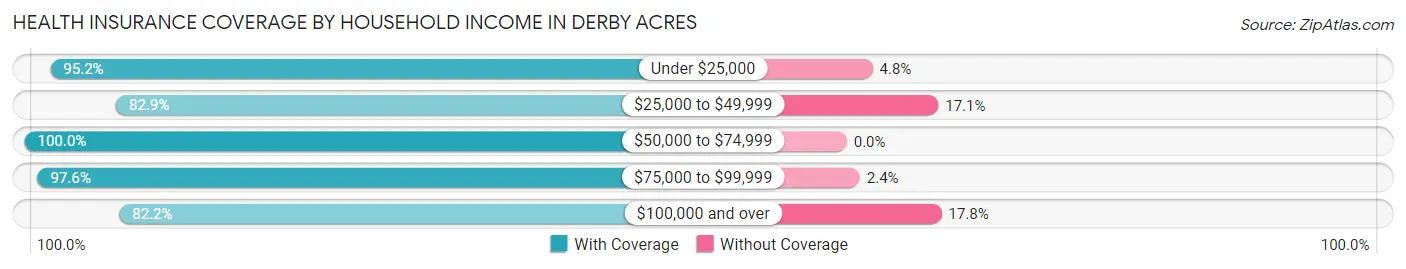
| Household Income | With Coverage | Without Coverage |
| Under $25,000 | 59 (95.2%) | 3 (4.8%) |
| $25,000 to $49,999 | 116 (82.9%) | 24 (17.1%) |
| $50,000 to $74,999 | 25 (100.0%) | 0 (0.0%) |
| $75,000 to $99,999 | 80 (97.6%) | 2 (2.4%) |
| $100,000 and over | 88 (82.2%) | 19 (17.8%) |
Public vs Private Health Insurance Coverage by Age in Derby Acres
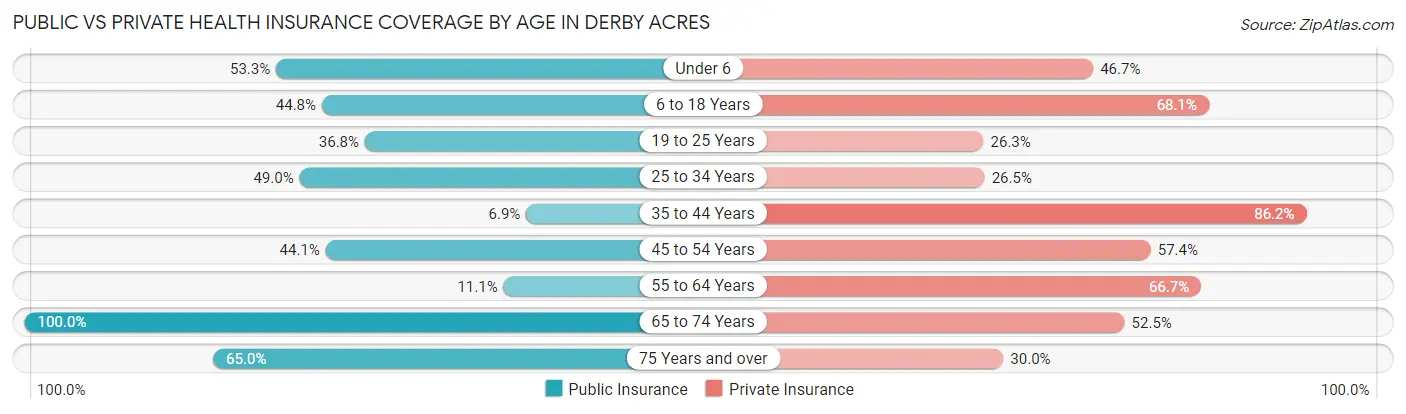
| Age Bracket | Public Insurance | Private Insurance |
| Under 6 | 16 (53.3%) | 14 (46.7%) |
| 6 to 18 Years | 52 (44.8%) | 79 (68.1%) |
| 19 to 25 Years | 7 (36.8%) | 5 (26.3%) |
| 25 to 34 Years | 24 (49.0%) | 13 (26.5%) |
| 35 to 44 Years | 2 (6.9%) | 25 (86.2%) |
| 45 to 54 Years | 30 (44.1%) | 39 (57.4%) |
| 55 to 64 Years | 5 (11.1%) | 30 (66.7%) |
| 65 to 74 Years | 40 (100.0%) | 21 (52.5%) |
| 75 Years and over | 13 (65.0%) | 6 (30.0%) |
| Total | 189 (45.4%) | 232 (55.8%) |
Disability Status by Sex by Age in Derby Acres
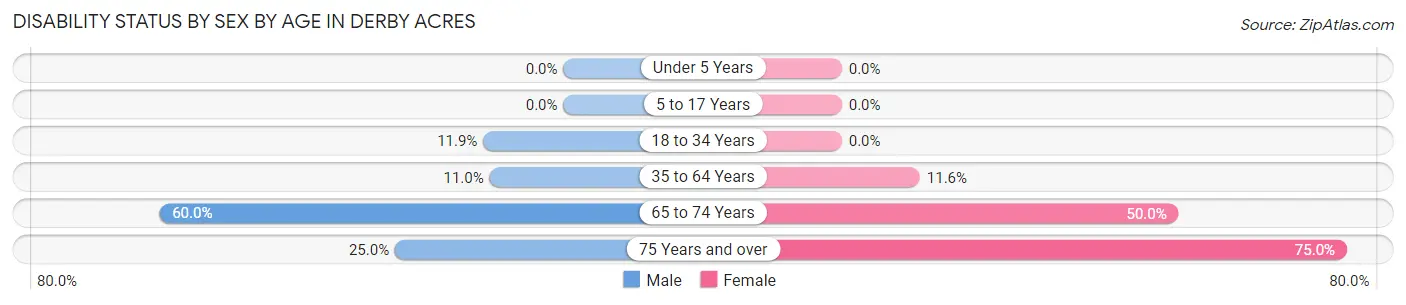
| Age Bracket | Male | Female |
| Under 5 Years | 0 (0.0%) | 0 (0.0%) |
| 5 to 17 Years | 0 (0.0%) | 0 (0.0%) |
| 18 to 34 Years | 5 (11.9%) | 0 (0.0%) |
| 35 to 64 Years | 8 (11.0%) | 8 (11.6%) |
| 65 to 74 Years | 12 (60.0%) | 10 (50.0%) |
| 75 Years and over | 3 (25.0%) | 6 (75.0%) |
Disability Class by Sex by Age in Derby Acres
Disability Class: Hearing Difficulty
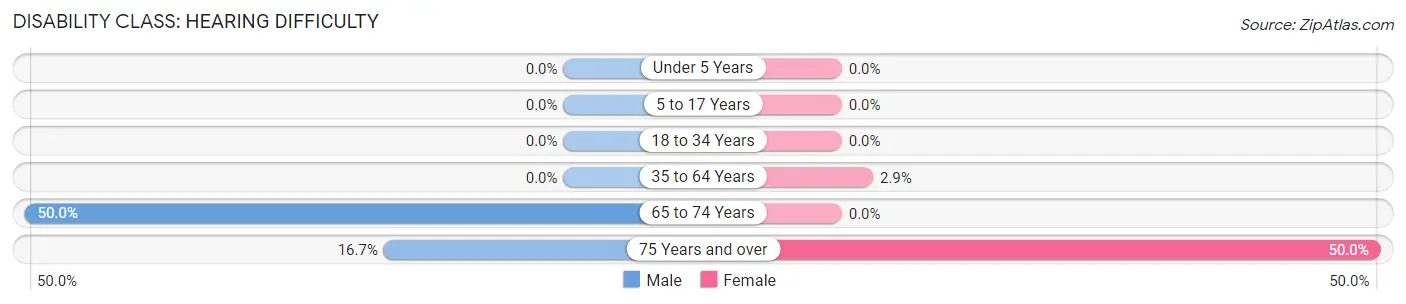
| Age Bracket | Male | Female |
| Under 5 Years | 0 (0.0%) | 0 (0.0%) |
| 5 to 17 Years | 0 (0.0%) | 0 (0.0%) |
| 18 to 34 Years | 0 (0.0%) | 0 (0.0%) |
| 35 to 64 Years | 0 (0.0%) | 2 (2.9%) |
| 65 to 74 Years | 10 (50.0%) | 0 (0.0%) |
| 75 Years and over | 2 (16.7%) | 4 (50.0%) |
Disability Class: Vision Difficulty
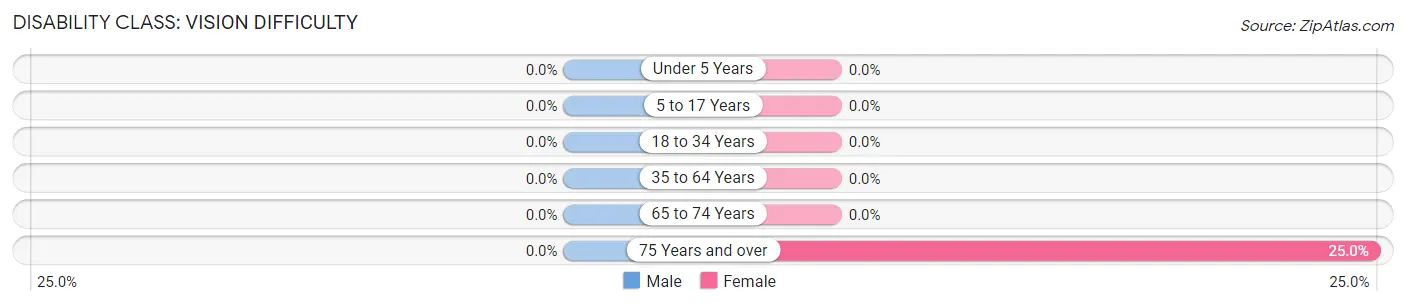
| Age Bracket | Male | Female |
| Under 5 Years | 0 (0.0%) | 0 (0.0%) |
| 5 to 17 Years | 0 (0.0%) | 0 (0.0%) |
| 18 to 34 Years | 0 (0.0%) | 0 (0.0%) |
| 35 to 64 Years | 0 (0.0%) | 0 (0.0%) |
| 65 to 74 Years | 0 (0.0%) | 0 (0.0%) |
| 75 Years and over | 0 (0.0%) | 2 (25.0%) |
Disability Class: Cognitive Difficulty
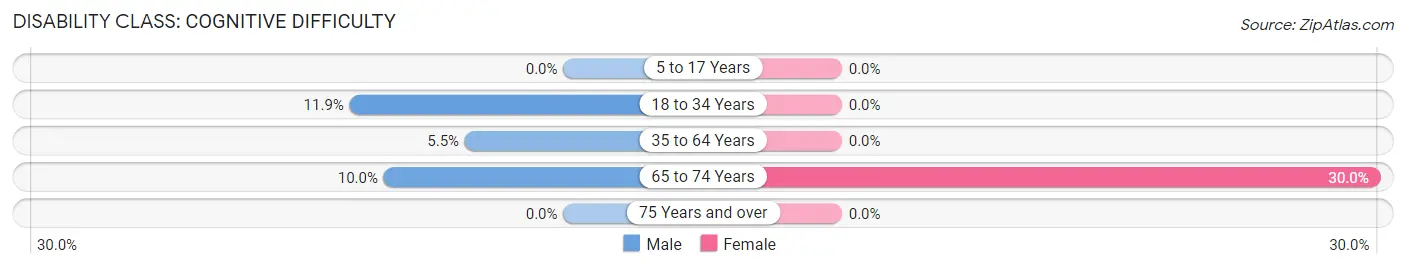
| Age Bracket | Male | Female |
| 5 to 17 Years | 0 (0.0%) | 0 (0.0%) |
| 18 to 34 Years | 5 (11.9%) | 0 (0.0%) |
| 35 to 64 Years | 4 (5.5%) | 0 (0.0%) |
| 65 to 74 Years | 2 (10.0%) | 6 (30.0%) |
| 75 Years and over | 0 (0.0%) | 0 (0.0%) |
Disability Class: Ambulatory Difficulty
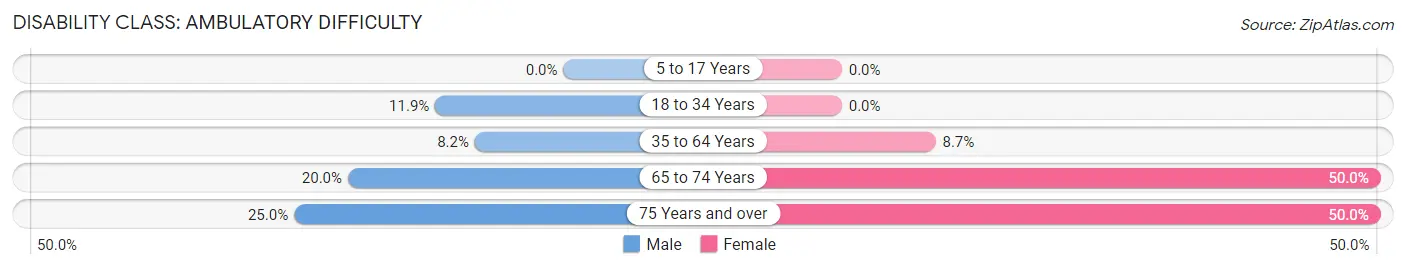
| Age Bracket | Male | Female |
| 5 to 17 Years | 0 (0.0%) | 0 (0.0%) |
| 18 to 34 Years | 5 (11.9%) | 0 (0.0%) |
| 35 to 64 Years | 6 (8.2%) | 6 (8.7%) |
| 65 to 74 Years | 4 (20.0%) | 10 (50.0%) |
| 75 Years and over | 3 (25.0%) | 4 (50.0%) |
Disability Class: Self-Care Difficulty
| Age Bracket | Male | Female |
| 5 to 17 Years | 0 (0.0%) | 0 (0.0%) |
| 18 to 34 Years | 0 (0.0%) | 0 (0.0%) |
| 35 to 64 Years | 0 (0.0%) | 0 (0.0%) |
| 65 to 74 Years | 2 (10.0%) | 6 (30.0%) |
| 75 Years and over | 0 (0.0%) | 0 (0.0%) |
Technology Access in Derby Acres
Computing Device Access in Derby Acres
| Device Type | # Households | % Households |
| Desktop or Laptop | 90 | 68.7% |
| Smartphone | 107 | 81.7% |
| Tablet | 54 | 41.2% |
| No Computing Device | 18 | 13.7% |
| Total | 131 | 100.0% |
Internet Access in Derby Acres
| Internet Type | # Households | % Households |
| Dial-Up Internet | 0 | 0.0% |
| Broadband Home | 30 | 22.9% |
| Cellular Data Only | 38 | 29.0% |
| Satellite Internet | 42 | 32.1% |
| No Internet | 30 | 22.9% |
| Total | 131 | 100.0% |
Derby Acres Summary
Derby Acres is a small unincorporated community located in Kern County, California. It is situated in the western part of the county, about 10 miles east of the city of Bakersfield. The population of Derby Acres was estimated to be around 1,000 people in 2020.
History
Derby Acres was founded in the early 1900s by a group of settlers from the Midwest. The settlers were looking for a place to settle and start a new life. They chose the area because of its fertile soil and abundant water supply. The settlers named the area Derby Acres after the nearby Derby Hills.
The first settlers in Derby Acres were mostly farmers and ranchers. They grew crops such as wheat, barley, and alfalfa, and raised cattle and sheep. The area was also known for its oil production, which began in the 1920s.
In the 1950s, the population of Derby Acres began to grow as more people moved to the area. The town was incorporated in 1959 and the population continued to grow throughout the 1960s and 1970s.
Geography
Derby Acres is located in the western part of Kern County, about 10 miles east of the city of Bakersfield. The town is situated in the San Joaquin Valley, which is a large agricultural region in California. The area is known for its fertile soil and abundant water supply.
The terrain of Derby Acres is mostly flat, with some rolling hills. The climate is semi-arid, with hot summers and mild winters. The average annual temperature is around 70 degrees Fahrenheit.
Economy
The economy of Derby Acres is largely based on agriculture. The area is known for its production of wheat, barley, alfalfa, and other crops. The town is also home to several oil and gas production companies.
In addition to agriculture, Derby Acres is home to several small businesses, including restaurants, convenience stores, and auto repair shops. The town also has a few small manufacturing companies.
Demographics
As of 2020, the population of Derby Acres was estimated to be around 1,000 people. The racial makeup of the town is predominantly white (90%), with small percentages of Hispanic (4%), African American (2%), and Asian (2%) residents.
The median household income in Derby Acres is around $50,000, which is slightly lower than the national average. The median home value is around $200,000, which is also lower than the national average.
Conclusion
Derby Acres is a small unincorporated community located in Kern County, California. It was founded in the early 1900s by a group of settlers from the Midwest and has since grown to a population of around 1,000 people. The economy of Derby Acres is largely based on agriculture, with some oil and gas production and small businesses. The racial makeup of the town is predominantly white, with small percentages of Hispanic, African American, and Asian residents. The median household income and home value in Derby Acres are both lower than the national average.
Common Questions
What is Per Capita Income in Derby Acres?
Per Capita income in Derby Acres is $21,275.
What is the Median Family Income in Derby Acres?
Median Family Income in Derby Acres is $62,500.
What is the Median Household income in Derby Acres?
Median Household Income in Derby Acres is $55,125.
What is Inequality or Gini Index in Derby Acres?
Inequality or Gini Index in Derby Acres is 0.43.
What is the Total Population of Derby Acres?
Total Population of Derby Acres is 416.
What is the Total Male Population of Derby Acres?
Total Male Population of Derby Acres is 204.
What is the Total Female Population of Derby Acres?
Total Female Population of Derby Acres is 212.
What is the Ratio of Males per 100 Females in Derby Acres?
There are 96.23 Males per 100 Females in Derby Acres.
What is the Ratio of Females per 100 Males in Derby Acres?
There are 103.92 Females per 100 Males in Derby Acres.
What is the Median Population Age in Derby Acres?
Median Population Age in Derby Acres is 32.8 Years.
What is the Average Family Size in Derby Acres
Average Family Size in Derby Acres is 3.9 People.
What is the Average Household Size in Derby Acres
Average Household Size in Derby Acres is 3.2 People.
How Large is the Labor Force in Derby Acres?
There are 152 People in the Labor Forcein in Derby Acres.
What is the Percentage of People in the Labor Force in Derby Acres?
51.4% of People are in the Labor Force in Derby Acres.
What is the Unemployment Rate in Derby Acres?
Unemployment Rate in Derby Acres is 16.4%.