Cities with the Highest Unemployment Rate Amomg Youth Under the Age of 25 in Michigan
RELATED REPORTS & OPTIONS
Highest Unemployment | Youth < 25
Michigan
Compare Cities
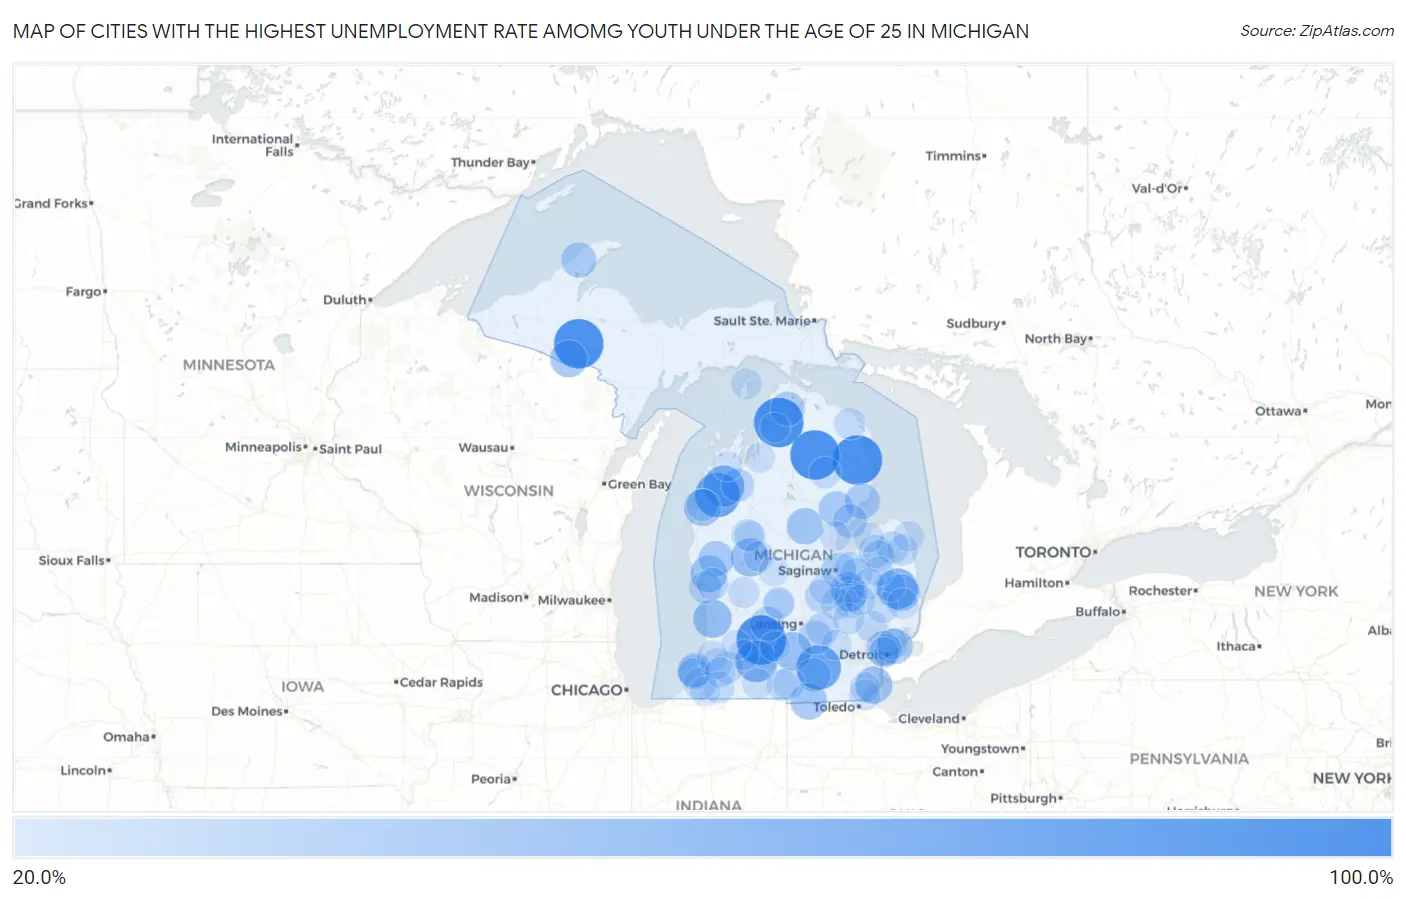
Map of Cities with the Highest Unemployment Rate Amomg Youth Under the Age of 25 in Michigan
0.0%
100.0%
Cities with the Highest Unemployment Rate Amomg Youth Under the Age of 25 in Michigan
| City | Youth Unemployment | vs State | vs National | |
| 1. | Hubbard Lake | 100.0% | 11.6%(+88.4)#1 | 10.9%(+89.1)#70 |
| 2. | Dowling | 100.0% | 11.6%(+88.4)#2 | 10.9%(+89.1)#139 |
| 3. | Walloon Lake | 100.0% | 11.6%(+88.4)#3 | 10.9%(+89.1)#149 |
| 4. | Lewiston | 99.9% | 11.6%(+88.3)#4 | 10.9%(+89.0)#336 |
| 5. | Amasa | 99.8% | 11.6%(+88.2)#5 | 10.9%(+88.9)#373 |
| 6. | Kaleva | 80.0% | 11.6%(+68.4)#6 | 10.9%(+69.1)#458 |
| 7. | Napoleon | 79.5% | 11.6%(+67.9)#7 | 10.9%(+68.6)#465 |
| 8. | Climax | 67.9% | 11.6%(+56.3)#8 | 10.9%(+57.0)#617 |
| 9. | Copemish | 66.6% | 11.6%(+55.0)#9 | 10.9%(+55.7)#643 |
| 10. | Melvin | 64.3% | 11.6%(+52.7)#10 | 10.9%(+53.4)#683 |
| 11. | Mass | 57.1% | 11.6%(+45.5)#11 | 10.9%(+46.2)#860 |
| 12. | Lakeport | 57.0% | 11.6%(+45.4)#12 | 10.9%(+46.1)#865 |
| 13. | Beechwood | 55.0% | 11.6%(+43.4)#13 | 10.9%(+44.1)#927 |
| 14. | Stanwood | 53.8% | 11.6%(+42.2)#14 | 10.9%(+42.9)#960 |
| 15. | Springport | 53.7% | 11.6%(+42.1)#15 | 10.9%(+42.8)#965 |
| 16. | Stony Point | 50.0% | 11.6%(+38.4)#16 | 10.9%(+39.1)#1,084 |
| 17. | Caspian | 50.0% | 11.6%(+38.4)#17 | 10.9%(+39.1)#1,093 |
| 18. | Filer City | 50.0% | 11.6%(+38.4)#18 | 10.9%(+39.1)#1,134 |
| 19. | Yale | 48.9% | 11.6%(+37.3)#19 | 10.9%(+38.0)#1,211 |
| 20. | Twin Lake | 48.4% | 11.6%(+36.8)#20 | 10.9%(+37.5)#1,226 |
| 21. | Waldron | 48.2% | 11.6%(+36.6)#21 | 10.9%(+37.3)#1,236 |
| 22. | Gladwin | 46.9% | 11.6%(+35.3)#22 | 10.9%(+36.0)#1,271 |
| 23. | Grosse Pointe Woods | 43.5% | 11.6%(+31.9)#23 | 10.9%(+32.6)#1,447 |
| 24. | Hesperia | 43.4% | 11.6%(+31.8)#24 | 10.9%(+32.5)#1,461 |
| 25. | Highland Park | 42.2% | 11.6%(+30.6)#25 | 10.9%(+31.3)#1,545 |
| 26. | Mount Morris | 41.9% | 11.6%(+30.3)#26 | 10.9%(+31.0)#1,566 |
| 27. | East Tawas | 41.9% | 11.6%(+30.3)#27 | 10.9%(+31.0)#1,569 |
| 28. | Prescott | 41.9% | 11.6%(+30.3)#28 | 10.9%(+31.0)#1,572 |
| 29. | Calumet | 41.7% | 11.6%(+30.1)#29 | 10.9%(+30.8)#1,585 |
| 30. | Buena Vista | 41.1% | 11.6%(+29.5)#30 | 10.9%(+30.2)#1,628 |
| 31. | Alanson | 39.4% | 11.6%(+27.8)#31 | 10.9%(+28.5)#1,755 |
| 32. | Benton Heights | 38.8% | 11.6%(+27.2)#32 | 10.9%(+27.9)#1,792 |
| 33. | Woodland | 38.4% | 11.6%(+26.8)#33 | 10.9%(+27.5)#1,816 |
| 34. | Au Gres | 38.2% | 11.6%(+26.6)#34 | 10.9%(+27.3)#1,835 |
| 35. | Clio | 38.0% | 11.6%(+26.4)#35 | 10.9%(+27.1)#1,849 |
| 36. | Dansville | 37.1% | 11.6%(+25.5)#36 | 10.9%(+26.2)#1,932 |
| 37. | Cement City | 36.3% | 11.6%(+24.7)#37 | 10.9%(+25.4)#1,982 |
| 38. | Buckley | 33.9% | 11.6%(+22.3)#38 | 10.9%(+23.0)#2,210 |
| 39. | Gagetown | 33.3% | 11.6%(+21.7)#39 | 10.9%(+22.4)#2,294 |
| 40. | Henderson | 33.3% | 11.6%(+21.7)#40 | 10.9%(+22.4)#2,303 |
| 41. | Rock | 33.3% | 11.6%(+21.7)#41 | 10.9%(+22.4)#2,322 |
| 42. | Fulton | 33.3% | 11.6%(+21.7)#42 | 10.9%(+22.4)#2,331 |
| 43. | Webberville | 32.5% | 11.6%(+20.9)#43 | 10.9%(+21.6)#2,399 |
| 44. | Benton Harbor | 32.2% | 11.6%(+20.6)#44 | 10.9%(+21.3)#2,423 |
| 45. | Muskegon Heights | 31.0% | 11.6%(+19.4)#45 | 10.9%(+20.1)#2,563 |
| 46. | Ubly | 30.9% | 11.6%(+19.3)#46 | 10.9%(+20.0)#2,581 |
| 47. | Berrien Springs | 30.6% | 11.6%(+19.0)#47 | 10.9%(+19.7)#2,613 |
| 48. | Wolf Lake | 29.9% | 11.6%(+18.3)#48 | 10.9%(+19.0)#2,690 |
| 49. | Eastlake | 29.9% | 11.6%(+18.3)#49 | 10.9%(+19.0)#2,709 |
| 50. | Cass City | 29.7% | 11.6%(+18.1)#50 | 10.9%(+18.8)#2,728 |
| 51. | Reed City | 29.2% | 11.6%(+17.6)#51 | 10.9%(+18.3)#2,791 |
| 52. | Lawton | 29.2% | 11.6%(+17.6)#52 | 10.9%(+18.3)#2,792 |
| 53. | Vassar | 28.7% | 11.6%(+17.1)#53 | 10.9%(+17.8)#2,847 |
| 54. | Lake Angelus | 28.5% | 11.6%(+16.9)#54 | 10.9%(+17.6)#2,888 |
| 55. | Allen | 28.5% | 11.6%(+16.9)#55 | 10.9%(+17.6)#2,893 |
| 56. | Flint | 28.4% | 11.6%(+16.8)#56 | 10.9%(+17.5)#2,904 |
| 57. | Cassopolis | 28.4% | 11.6%(+16.8)#57 | 10.9%(+17.5)#2,911 |
| 58. | Mio | 28.4% | 11.6%(+16.8)#58 | 10.9%(+17.5)#2,912 |
| 59. | Quincy | 28.3% | 11.6%(+16.7)#59 | 10.9%(+17.4)#2,927 |
| 60. | Lennon | 28.2% | 11.6%(+16.6)#60 | 10.9%(+17.3)#2,944 |
| 61. | Hamtramck | 28.0% | 11.6%(+16.4)#61 | 10.9%(+17.1)#2,956 |
| 62. | Beecher | 28.0% | 11.6%(+16.4)#62 | 10.9%(+17.1)#2,958 |
| 63. | Fair Plain | 27.7% | 11.6%(+16.1)#63 | 10.9%(+16.8)#2,997 |
| 64. | Posen | 27.7% | 11.6%(+16.1)#64 | 10.9%(+16.8)#3,018 |
| 65. | Minden City | 27.2% | 11.6%(+15.6)#65 | 10.9%(+16.3)#3,089 |
| 66. | Dryden | 27.0% | 11.6%(+15.4)#66 | 10.9%(+16.1)#3,121 |
| 67. | Muir | 27.0% | 11.6%(+15.4)#67 | 10.9%(+16.1)#3,126 |
| 68. | Fenton | 26.6% | 11.6%(+15.0)#68 | 10.9%(+15.7)#3,166 |
| 69. | Reese | 26.5% | 11.6%(+14.9)#69 | 10.9%(+15.6)#3,208 |
| 70. | Rockford | 26.4% | 11.6%(+14.8)#70 | 10.9%(+15.5)#3,217 |
| 71. | Eastpointe | 26.3% | 11.6%(+14.7)#71 | 10.9%(+15.4)#3,228 |
| 72. | Hersey | 26.3% | 11.6%(+14.7)#72 | 10.9%(+15.4)#3,250 |
| 73. | Lawrence | 26.1% | 11.6%(+14.5)#73 | 10.9%(+15.2)#3,289 |
| 74. | Brown City | 26.0% | 11.6%(+14.4)#74 | 10.9%(+15.1)#3,307 |
| 75. | Fostoria | 26.0% | 11.6%(+14.4)#75 | 10.9%(+15.1)#3,308 |
| 76. | Chesaning | 25.7% | 11.6%(+14.1)#76 | 10.9%(+14.8)#3,360 |
| 77. | Colon | 25.3% | 11.6%(+13.7)#77 | 10.9%(+14.4)#3,424 |
| 78. | Detroit | 25.2% | 11.6%(+13.6)#78 | 10.9%(+14.3)#3,427 |
| 79. | Bangor | 25.1% | 11.6%(+13.5)#79 | 10.9%(+14.2)#3,444 |
| 80. | Emmett | 25.0% | 11.6%(+13.4)#80 | 10.9%(+14.1)#3,497 |
| 81. | St James | 25.0% | 11.6%(+13.4)#81 | 10.9%(+14.1)#3,500 |
| 82. | Canadian Lakes | 24.9% | 11.6%(+13.3)#82 | 10.9%(+14.0)#3,520 |
| 83. | Luna Pier | 24.9% | 11.6%(+13.3)#83 | 10.9%(+14.0)#3,525 |
| 84. | Davison | 24.8% | 11.6%(+13.2)#84 | 10.9%(+13.9)#3,553 |
| 85. | Parchment | 24.4% | 11.6%(+12.8)#85 | 10.9%(+13.5)#3,627 |
| 86. | Pinconning | 24.3% | 11.6%(+12.7)#86 | 10.9%(+13.4)#3,647 |
| 87. | Lyons | 24.3% | 11.6%(+12.7)#87 | 10.9%(+13.4)#3,650 |
| 88. | Pinckney | 23.9% | 11.6%(+12.3)#88 | 10.9%(+13.0)#3,716 |
| 89. | Decatur | 23.8% | 11.6%(+12.2)#89 | 10.9%(+12.9)#3,740 |
| 90. | Harbor Beach | 23.8% | 11.6%(+12.2)#90 | 10.9%(+12.9)#3,741 |
| 91. | South Monroe | 23.6% | 11.6%(+12.0)#91 | 10.9%(+12.7)#3,785 |
| 92. | Boyne City | 23.2% | 11.6%(+11.6)#92 | 10.9%(+12.3)#3,877 |
| 93. | Kingston | 23.2% | 11.6%(+11.6)#93 | 10.9%(+12.3)#3,889 |
| 94. | Edmore | 23.0% | 11.6%(+11.4)#94 | 10.9%(+12.1)#3,928 |
| 95. | Bay Port | 23.0% | 11.6%(+11.4)#95 | 10.9%(+12.1)#3,937 |
| 96. | Lake Ann | 23.0% | 11.6%(+11.4)#96 | 10.9%(+12.1)#3,941 |
| 97. | Otsego | 22.9% | 11.6%(+11.3)#97 | 10.9%(+12.0)#3,962 |
| 98. | Rapid City | 22.8% | 11.6%(+11.2)#98 | 10.9%(+11.9)#3,988 |
| 99. | Niles | 22.6% | 11.6%(+11.0)#99 | 10.9%(+11.7)#4,017 |
| 100. | Bellevue | 22.6% | 11.6%(+11.0)#100 | 10.9%(+11.7)#4,028 |
Common Questions
What are the Top 10 Cities with the Highest Unemployment Rate Amomg Youth Under the Age of 25 in Michigan?
Top 10 Cities with the Highest Unemployment Rate Amomg Youth Under the Age of 25 in Michigan are:
#1
100.0%
#2
100.0%
#3
100.0%
#4
99.9%
#5
99.8%
#6
80.0%
#7
79.5%
#8
67.9%
#9
66.6%
#10
64.3%
What city has the Highest Unemployment Rate Amomg Youth Under the Age of 25 in Michigan?
Hubbard Lake has the Highest Unemployment Rate Amomg Youth Under the Age of 25 in Michigan with 100.0%.
What is the Unemployment Rate Amomg Youth Under the Age of 25 in the State of Michigan?
Unemployment Rate Amomg Youth Under the Age of 25 in Michigan is 11.6%.
What is the Unemployment Rate Amomg Youth Under the Age of 25 in the United States?
Unemployment Rate Amomg Youth Under the Age of 25 in the United States is 10.9%.