Cities with the Highest Unemployment Rate Amomg Youth Under the Age of 25 in New Jersey
RELATED REPORTS & OPTIONS
Highest Unemployment | Youth < 25
New Jersey
Compare Cities
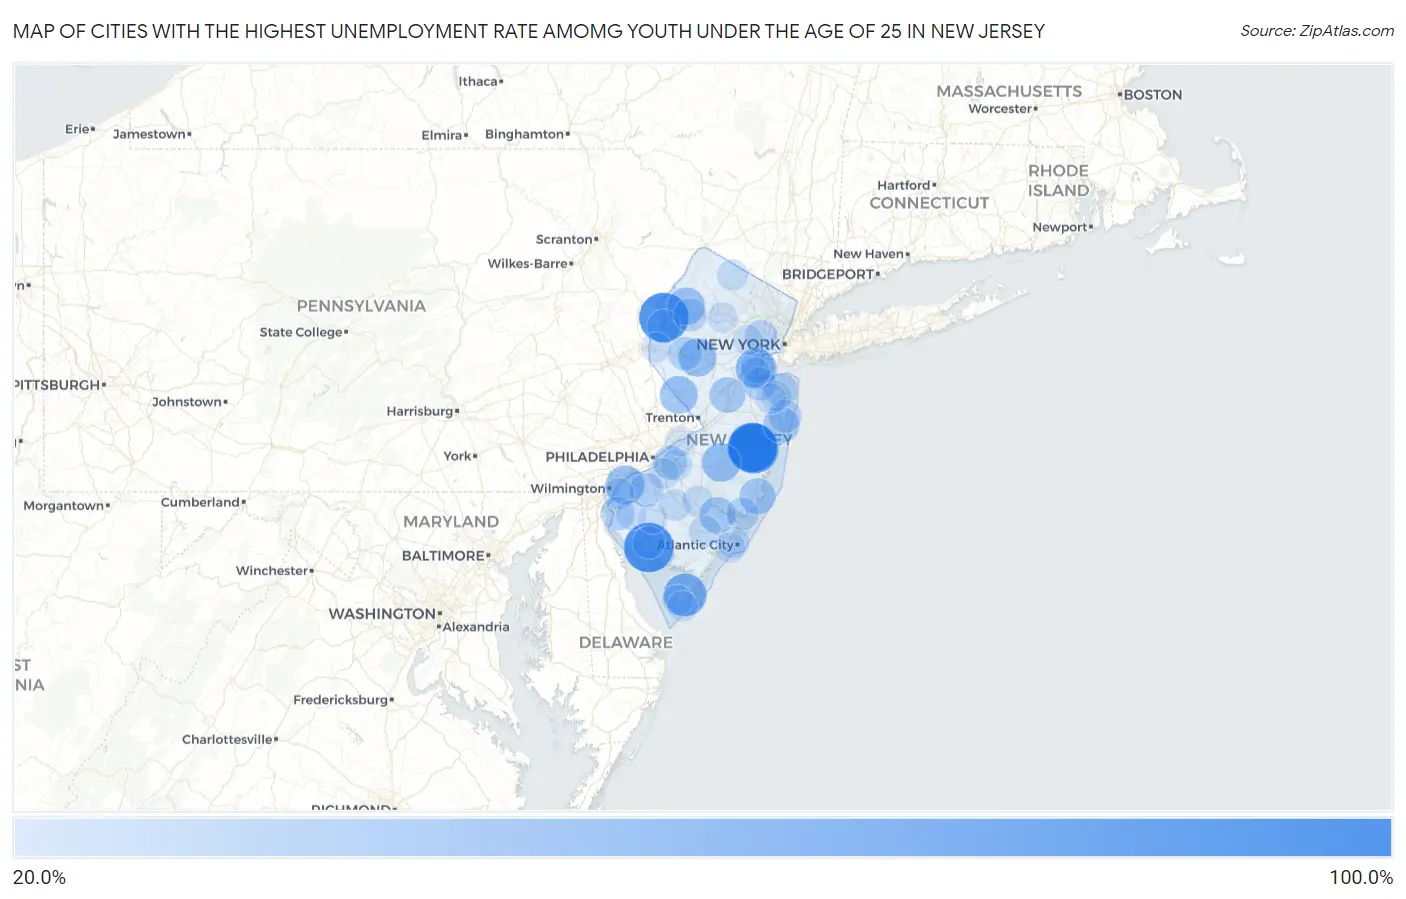
Map of Cities with the Highest Unemployment Rate Amomg Youth Under the Age of 25 in New Jersey
0.0%
100.0%
Cities with the Highest Unemployment Rate Amomg Youth Under the Age of 25 in New Jersey
| City | Youth Unemployment | vs State | vs National | |
| 1. | Leisure Village West | 100.0% | 12.9%(+87.1)#1 | 10.9%(+89.1)#31 |
| 2. | Leisure Knoll | 100.0% | 12.9%(+87.1)#2 | 10.9%(+89.1)#34 |
| 3. | Hewitt | 100.0% | 12.9%(+87.1)#3 | 10.9%(+89.1)#36 |
| 4. | Mauricetown | 100.0% | 12.9%(+87.1)#4 | 10.9%(+89.1)#98 |
| 5. | Cedarville | 100.0% | 12.9%(+87.1)#5 | 10.9%(+89.1)#101 |
| 6. | Delaware | 100.0% | 12.9%(+87.1)#6 | 10.9%(+89.1)#241 |
| 7. | Othello | 100.0% | 12.9%(+87.1)#7 | 10.9%(+89.1)#255 |
| 8. | Vincentown | 99.9% | 12.9%(+87.0)#8 | 10.9%(+89.0)#349 |
| 9. | Union | 81.1% | 12.9%(+68.2)#9 | 10.9%(+70.2)#454 |
| 10. | Alpine Borough | 79.4% | 12.9%(+66.5)#10 | 10.9%(+68.5)#466 |
| 11. | Rio Grande | 72.6% | 12.9%(+59.7)#11 | 10.9%(+61.7)#548 |
| 12. | Absecon Highlands | 68.0% | 12.9%(+55.1)#12 | 10.9%(+57.1)#615 |
| 13. | Mount Royal | 64.8% | 12.9%(+51.9)#13 | 10.9%(+53.9)#672 |
| 14. | Sewaren | 64.1% | 12.9%(+51.2)#14 | 10.9%(+53.2)#685 |
| 15. | Pedricktown | 56.5% | 12.9%(+43.6)#15 | 10.9%(+45.6)#874 |
| 16. | Presidential Lakes Estates | 55.6% | 12.9%(+42.7)#16 | 10.9%(+44.7)#891 |
| 17. | Longport Borough | 54.5% | 12.9%(+41.6)#17 | 10.9%(+43.6)#940 |
| 18. | White House Station | 53.3% | 12.9%(+40.4)#18 | 10.9%(+42.4)#978 |
| 19. | Lambertville | 52.3% | 12.9%(+39.4)#19 | 10.9%(+41.4)#1,011 |
| 20. | Johnsonburg | 50.8% | 12.9%(+37.9)#20 | 10.9%(+39.9)#1,062 |
| 21. | Centre Grove | 50.0% | 12.9%(+37.1)#21 | 10.9%(+39.1)#1,086 |
| 22. | Bargaintown | 48.6% | 12.9%(+35.7)#22 | 10.9%(+37.7)#1,218 |
| 23. | Glen Ridge Borough | 48.2% | 12.9%(+35.3)#23 | 10.9%(+37.3)#1,232 |
| 24. | Woodcliff Lake Borough | 47.1% | 12.9%(+34.2)#24 | 10.9%(+36.2)#1,261 |
| 25. | West Belmar | 45.6% | 12.9%(+32.7)#25 | 10.9%(+34.7)#1,330 |
| 26. | South Seaville | 44.9% | 12.9%(+32.0)#26 | 10.9%(+34.0)#1,371 |
| 27. | Manahawkin | 44.8% | 12.9%(+31.9)#27 | 10.9%(+33.9)#1,374 |
| 28. | Egg Harbor City | 44.5% | 12.9%(+31.6)#28 | 10.9%(+33.6)#1,383 |
| 29. | Dayton | 43.2% | 12.9%(+30.3)#29 | 10.9%(+32.3)#1,474 |
| 30. | Liberty Corner | 42.8% | 12.9%(+29.9)#30 | 10.9%(+31.9)#1,496 |
| 31. | Great Notch | 39.5% | 12.9%(+26.6)#31 | 10.9%(+28.6)#1,747 |
| 32. | Englewood Cliffs Borough | 38.3% | 12.9%(+25.4)#32 | 10.9%(+27.4)#1,824 |
| 33. | Mullica Hill | 37.5% | 12.9%(+24.6)#33 | 10.9%(+26.6)#1,880 |
| 34. | Monmouth Beach Borough | 36.5% | 12.9%(+23.6)#34 | 10.9%(+25.6)#1,970 |
| 35. | Salem | 36.1% | 12.9%(+23.2)#35 | 10.9%(+25.2)#2,003 |
| 36. | Annandale | 35.9% | 12.9%(+23.0)#36 | 10.9%(+25.0)#2,021 |
| 37. | Ellisburg | 35.5% | 12.9%(+22.6)#37 | 10.9%(+24.6)#2,053 |
| 38. | Belvidere | 35.1% | 12.9%(+22.2)#38 | 10.9%(+24.2)#2,100 |
| 39. | Port Reading | 35.0% | 12.9%(+22.1)#39 | 10.9%(+24.1)#2,108 |
| 40. | Gouldtown | 35.0% | 12.9%(+22.1)#40 | 10.9%(+24.1)#2,112 |
| 41. | Navesink | 34.4% | 12.9%(+21.5)#41 | 10.9%(+23.5)#2,161 |
| 42. | Glen Rock Borough | 34.1% | 12.9%(+21.2)#42 | 10.9%(+23.2)#2,190 |
| 43. | Cliffwood Beach | 33.8% | 12.9%(+20.9)#43 | 10.9%(+22.9)#2,216 |
| 44. | Chatham Borough | 33.5% | 12.9%(+20.6)#44 | 10.9%(+22.6)#2,231 |
| 45. | Loch Arbour | 33.3% | 12.9%(+20.4)#45 | 10.9%(+22.4)#2,311 |
| 46. | Panther Valley | 32.9% | 12.9%(+20.0)#46 | 10.9%(+22.0)#2,361 |
| 47. | Mount Ephraim Borough | 32.8% | 12.9%(+19.9)#47 | 10.9%(+21.9)#2,369 |
| 48. | Westmont | 32.6% | 12.9%(+19.7)#48 | 10.9%(+21.7)#2,379 |
| 49. | East Orange | 32.1% | 12.9%(+19.2)#49 | 10.9%(+21.2)#2,431 |
| 50. | Mystic Island | 31.2% | 12.9%(+18.3)#50 | 10.9%(+20.3)#2,536 |
| 51. | Fairton | 31.0% | 12.9%(+18.1)#51 | 10.9%(+20.1)#2,570 |
| 52. | Stirling | 30.9% | 12.9%(+18.0)#52 | 10.9%(+20.0)#2,578 |
| 53. | Ledgewood | 30.0% | 12.9%(+17.1)#53 | 10.9%(+19.1)#2,669 |
| 54. | Essex Fells Borough | 29.5% | 12.9%(+16.6)#54 | 10.9%(+18.6)#2,753 |
| 55. | Clayton Borough | 29.4% | 12.9%(+16.5)#55 | 10.9%(+18.5)#2,760 |
| 56. | Franklin Lakes Borough | 28.6% | 12.9%(+15.7)#56 | 10.9%(+17.7)#2,851 |
| 57. | Little Ferry Borough | 28.4% | 12.9%(+15.5)#57 | 10.9%(+17.5)#2,906 |
| 58. | Mays Landing | 28.4% | 12.9%(+15.5)#58 | 10.9%(+17.5)#2,908 |
| 59. | Midland Park Borough | 28.0% | 12.9%(+15.1)#59 | 10.9%(+17.1)#2,959 |
| 60. | Northvale Borough | 27.9% | 12.9%(+15.0)#60 | 10.9%(+17.0)#2,970 |
| 61. | Garwood Borough | 27.8% | 12.9%(+14.9)#61 | 10.9%(+16.9)#2,985 |
| 62. | Victory Lakes | 27.4% | 12.9%(+14.5)#62 | 10.9%(+16.5)#3,048 |
| 63. | Carneys Point | 26.8% | 12.9%(+13.9)#63 | 10.9%(+15.9)#3,142 |
| 64. | Mountainside Borough | 26.6% | 12.9%(+13.7)#64 | 10.9%(+15.7)#3,168 |
| 65. | Atlantic City | 26.5% | 12.9%(+13.6)#65 | 10.9%(+15.6)#3,197 |
| 66. | Greentree | 26.3% | 12.9%(+13.4)#66 | 10.9%(+15.4)#3,230 |
| 67. | Highland Lakes | 26.1% | 12.9%(+13.2)#67 | 10.9%(+15.2)#3,283 |
| 68. | Oceanport Borough | 25.9% | 12.9%(+13.0)#68 | 10.9%(+15.0)#3,317 |
| 69. | Glendora | 25.6% | 12.9%(+12.7)#69 | 10.9%(+14.7)#3,375 |
| 70. | Maywood Borough | 25.3% | 12.9%(+12.4)#70 | 10.9%(+14.4)#3,414 |
| 71. | Keyport Borough | 25.1% | 12.9%(+12.2)#71 | 10.9%(+14.2)#3,443 |
| 72. | Palmyra Borough | 25.0% | 12.9%(+12.1)#72 | 10.9%(+14.1)#3,451 |
| 73. | Menlo Park Terrace | 24.7% | 12.9%(+11.8)#73 | 10.9%(+13.8)#3,569 |
| 74. | Somerdale Borough | 24.2% | 12.9%(+11.3)#74 | 10.9%(+13.3)#3,660 |
| 75. | Magnolia Borough | 24.2% | 12.9%(+11.3)#75 | 10.9%(+13.3)#3,661 |
| 76. | Fairview | 24.1% | 12.9%(+11.2)#76 | 10.9%(+13.2)#3,680 |
| 77. | Hammonton | 24.0% | 12.9%(+11.1)#77 | 10.9%(+13.1)#3,689 |
| 78. | Grenloch | 24.0% | 12.9%(+11.1)#78 | 10.9%(+13.1)#3,703 |
| 79. | Folsom Borough | 23.9% | 12.9%(+11.0)#79 | 10.9%(+13.0)#3,718 |
| 80. | New Providence Borough | 23.7% | 12.9%(+10.8)#80 | 10.9%(+12.8)#3,761 |
| 81. | Pennington Borough | 23.7% | 12.9%(+10.8)#81 | 10.9%(+12.8)#3,768 |
| 82. | North Cape May | 23.6% | 12.9%(+10.7)#82 | 10.9%(+12.7)#3,788 |
| 83. | Lincroft | 23.5% | 12.9%(+10.6)#83 | 10.9%(+12.6)#3,804 |
| 84. | Fanwood Borough | 23.4% | 12.9%(+10.5)#84 | 10.9%(+12.5)#3,830 |
| 85. | Malaga | 23.4% | 12.9%(+10.5)#85 | 10.9%(+12.5)#3,837 |
| 86. | Three Bridges | 23.3% | 12.9%(+10.4)#86 | 10.9%(+12.4)#3,863 |
| 87. | Perth Amboy | 23.2% | 12.9%(+10.3)#87 | 10.9%(+12.3)#3,866 |
| 88. | Ventnor City | 23.2% | 12.9%(+10.3)#88 | 10.9%(+12.3)#3,872 |
| 89. | Cape May | 23.0% | 12.9%(+10.1)#89 | 10.9%(+12.1)#3,920 |
| 90. | Greenwich | 22.9% | 12.9%(+10.00)#90 | 10.9%(+12.0)#3,965 |
| 91. | Dover | 22.8% | 12.9%(+9.90)#91 | 10.9%(+11.9)#3,975 |
| 92. | Short Hills | 22.5% | 12.9%(+9.60)#92 | 10.9%(+11.6)#4,037 |
| 93. | Upper Saddle River Borough | 22.5% | 12.9%(+9.60)#93 | 10.9%(+11.6)#4,038 |
| 94. | Beach Haven Borough | 22.5% | 12.9%(+9.60)#94 | 10.9%(+11.6)#4,051 |
| 95. | Beverly | 22.4% | 12.9%(+9.50)#95 | 10.9%(+11.5)#4,068 |
| 96. | Ringoes | 22.2% | 12.9%(+9.30)#96 | 10.9%(+11.3)#4,141 |
| 97. | Penns Grove Borough | 22.0% | 12.9%(+9.10)#97 | 10.9%(+11.1)#4,193 |
| 98. | Ampere North | 21.9% | 12.9%(+9.00)#98 | 10.9%(+11.0)#4,211 |
| 99. | Alloway | 21.7% | 12.9%(+8.80)#99 | 10.9%(+10.8)#4,254 |
| 100. | Olivet | 21.6% | 12.9%(+8.70)#100 | 10.9%(+10.7)#4,283 |
Common Questions
What are the Top 10 Cities with the Highest Unemployment Rate Amomg Youth Under the Age of 25 in New Jersey?
Top 10 Cities with the Highest Unemployment Rate Amomg Youth Under the Age of 25 in New Jersey are:
#1
100.0%
#2
100.0%
#3
100.0%
#4
100.0%
#5
72.6%
#6
64.1%
#7
56.5%
#8
55.6%
#9
53.3%
#10
52.3%
What city has the Highest Unemployment Rate Amomg Youth Under the Age of 25 in New Jersey?
Leisure Village West has the Highest Unemployment Rate Amomg Youth Under the Age of 25 in New Jersey with 100.0%.
What is the Unemployment Rate Amomg Youth Under the Age of 25 in the State of New Jersey?
Unemployment Rate Amomg Youth Under the Age of 25 in New Jersey is 12.9%.
What is the Unemployment Rate Amomg Youth Under the Age of 25 in the United States?
Unemployment Rate Amomg Youth Under the Age of 25 in the United States is 10.9%.