Cities with the Highest Unemployment Rate Amomg Youth Under the Age of 25 in Louisiana
RELATED REPORTS & OPTIONS
Highest Unemployment | Youth < 25
Louisiana
Compare Cities
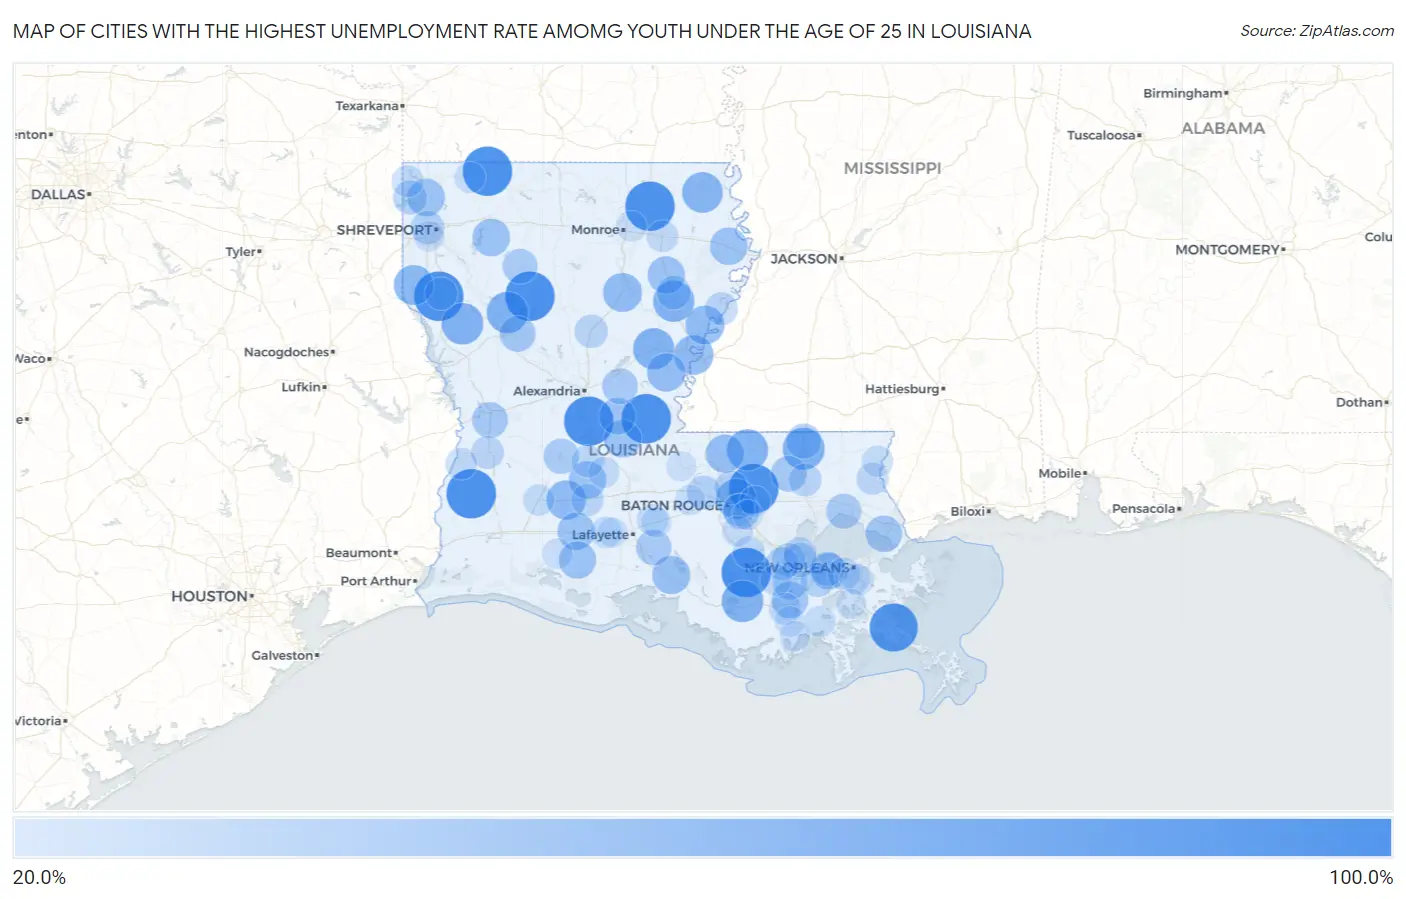
Map of Cities with the Highest Unemployment Rate Amomg Youth Under the Age of 25 in Louisiana
0.0%
100.0%
Cities with the Highest Unemployment Rate Amomg Youth Under the Age of 25 in Louisiana
| City | Youth Unemployment | vs State | vs National | |
| 1. | Watson | 100.0% | 13.8%(+86.2)#1 | 10.9%(+89.1)#6 |
| 2. | Oretta | 100.0% | 13.8%(+86.2)#2 | 10.9%(+89.1)#78 |
| 3. | South Mansfield | 100.0% | 13.8%(+86.2)#3 | 10.9%(+89.1)#91 |
| 4. | Napoleonville | 100.0% | 13.8%(+86.2)#4 | 10.9%(+89.1)#124 |
| 5. | Bordelonville | 100.0% | 13.8%(+86.2)#5 | 10.9%(+89.1)#146 |
| 6. | Collinston | 100.0% | 13.8%(+86.2)#6 | 10.9%(+89.1)#179 |
| 7. | Shongaloo | 100.0% | 13.8%(+86.2)#7 | 10.9%(+89.1)#252 |
| 8. | Lecompte | 99.9% | 13.8%(+86.1)#8 | 10.9%(+89.0)#340 |
| 9. | Goldonna | 99.9% | 13.8%(+86.1)#9 | 10.9%(+89.0)#350 |
| 10. | Port Sulphur | 94.2% | 13.8%(+80.4)#10 | 10.9%(+83.3)#387 |
| 11. | Tangipahoa | 68.6% | 13.8%(+54.8)#11 | 10.9%(+57.7)#608 |
| 12. | Bayou L Ourse | 67.3% | 13.8%(+53.5)#12 | 10.9%(+56.4)#623 |
| 13. | Pleasant Hill | 67.1% | 13.8%(+53.3)#13 | 10.9%(+56.2)#625 |
| 14. | Campti | 66.5% | 13.8%(+52.7)#14 | 10.9%(+55.6)#657 |
| 15. | Clinton | 66.0% | 13.8%(+52.2)#15 | 10.9%(+55.1)#661 |
| 16. | Jonesville | 65.5% | 13.8%(+51.7)#16 | 10.9%(+54.6)#667 |
| 17. | Wisner | 65.5% | 13.8%(+51.7)#17 | 10.9%(+54.6)#668 |
| 18. | Forest | 63.3% | 13.8%(+49.5)#18 | 10.9%(+52.4)#707 |
| 19. | Merrydale | 60.8% | 13.8%(+47.0)#19 | 10.9%(+49.9)#750 |
| 20. | Longstreet | 60.0% | 13.8%(+46.2)#20 | 10.9%(+49.1)#777 |
| 21. | Minorca | 58.3% | 13.8%(+44.5)#21 | 10.9%(+47.4)#815 |
| 22. | Basile | 57.5% | 13.8%(+43.7)#22 | 10.9%(+46.6)#836 |
| 23. | Waterproof | 56.5% | 13.8%(+42.7)#23 | 10.9%(+45.6)#873 |
| 24. | Grayson | 56.0% | 13.8%(+42.2)#24 | 10.9%(+45.1)#885 |
| 25. | Jackson | 54.0% | 13.8%(+40.2)#25 | 10.9%(+43.1)#952 |
| 26. | Monterey | 53.8% | 13.8%(+40.0)#26 | 10.9%(+42.9)#959 |
| 27. | Jeanerette | 53.0% | 13.8%(+39.2)#27 | 10.9%(+42.1)#990 |
| 28. | Mamou | 50.5% | 13.8%(+36.7)#28 | 10.9%(+39.6)#1,071 |
| 29. | Richmond | 50.2% | 13.8%(+36.4)#29 | 10.9%(+39.3)#1,077 |
| 30. | Egan | 50.0% | 13.8%(+36.2)#30 | 10.9%(+39.1)#1,090 |
| 31. | Belcher | 50.0% | 13.8%(+36.2)#31 | 10.9%(+39.1)#1,106 |
| 32. | Evergreen | 50.0% | 13.8%(+36.2)#32 | 10.9%(+39.1)#1,109 |
| 33. | Heflin | 50.0% | 13.8%(+36.2)#33 | 10.9%(+39.1)#1,113 |
| 34. | Winnsboro | 49.5% | 13.8%(+35.7)#34 | 10.9%(+38.6)#1,191 |
| 35. | Gueydan | 49.3% | 13.8%(+35.5)#35 | 10.9%(+38.4)#1,200 |
| 36. | Fifth Ward | 47.4% | 13.8%(+33.6)#36 | 10.9%(+36.5)#1,258 |
| 37. | New Orleans Station | 47.1% | 13.8%(+33.3)#37 | 10.9%(+36.2)#1,262 |
| 38. | Raceland | 46.9% | 13.8%(+33.1)#38 | 10.9%(+36.0)#1,270 |
| 39. | Eden Isle | 46.1% | 13.8%(+32.3)#39 | 10.9%(+35.2)#1,297 |
| 40. | Ama | 45.6% | 13.8%(+31.8)#40 | 10.9%(+34.7)#1,332 |
| 41. | Vienna Bend | 43.9% | 13.8%(+30.1)#41 | 10.9%(+33.0)#1,418 |
| 42. | Inniswold | 43.5% | 13.8%(+29.7)#42 | 10.9%(+32.6)#1,449 |
| 43. | New Llano | 43.4% | 13.8%(+29.6)#43 | 10.9%(+32.5)#1,457 |
| 44. | Montpelier | 43.3% | 13.8%(+29.5)#44 | 10.9%(+32.4)#1,472 |
| 45. | Deville | 42.5% | 13.8%(+28.7)#45 | 10.9%(+31.6)#1,540 |
| 46. | St Martinville | 42.0% | 13.8%(+28.2)#46 | 10.9%(+31.1)#1,560 |
| 47. | Oakdale | 41.0% | 13.8%(+27.2)#47 | 10.9%(+30.1)#1,640 |
| 48. | Madisonville | 40.3% | 13.8%(+26.5)#48 | 10.9%(+29.4)#1,675 |
| 49. | Kentwood | 40.1% | 13.8%(+26.3)#49 | 10.9%(+29.2)#1,685 |
| 50. | Lucky | 40.0% | 13.8%(+26.2)#50 | 10.9%(+29.1)#1,703 |
| 51. | Kraemer | 39.0% | 13.8%(+25.2)#51 | 10.9%(+28.1)#1,781 |
| 52. | St Rose | 37.3% | 13.8%(+23.5)#52 | 10.9%(+26.4)#1,913 |
| 53. | Edgard | 37.2% | 13.8%(+23.4)#53 | 10.9%(+26.3)#1,925 |
| 54. | Gilbert | 36.3% | 13.8%(+22.5)#54 | 10.9%(+25.4)#1,990 |
| 55. | Oil City | 35.8% | 13.8%(+22.0)#55 | 10.9%(+24.9)#2,032 |
| 56. | Erwinville | 35.7% | 13.8%(+21.9)#56 | 10.9%(+24.8)#2,040 |
| 57. | Wallace | 34.9% | 13.8%(+21.1)#57 | 10.9%(+24.0)#2,120 |
| 58. | Boutte | 34.8% | 13.8%(+21.0)#58 | 10.9%(+23.9)#2,127 |
| 59. | Lakeview | 34.2% | 13.8%(+20.4)#59 | 10.9%(+23.3)#2,179 |
| 60. | Baker | 33.4% | 13.8%(+19.6)#60 | 10.9%(+22.5)#2,236 |
| 61. | North Vacherie | 33.3% | 13.8%(+19.5)#61 | 10.9%(+22.4)#2,249 |
| 62. | Georgetown | 33.3% | 13.8%(+19.5)#62 | 10.9%(+22.4)#2,312 |
| 63. | Deridder | 32.0% | 13.8%(+18.2)#63 | 10.9%(+21.1)#2,444 |
| 64. | Reserve | 32.0% | 13.8%(+18.2)#64 | 10.9%(+21.1)#2,445 |
| 65. | St Joseph | 32.0% | 13.8%(+18.2)#65 | 10.9%(+21.1)#2,451 |
| 66. | Independence | 31.8% | 13.8%(+18.0)#66 | 10.9%(+20.9)#2,467 |
| 67. | Mansfield | 30.1% | 13.8%(+16.3)#67 | 10.9%(+19.2)#2,663 |
| 68. | Bridge City | 29.8% | 13.8%(+16.0)#68 | 10.9%(+18.9)#2,713 |
| 69. | Westminster | 29.5% | 13.8%(+15.7)#69 | 10.9%(+18.6)#2,749 |
| 70. | Eunice | 29.4% | 13.8%(+15.6)#70 | 10.9%(+18.5)#2,759 |
| 71. | Pine Prairie | 28.8% | 13.8%(+15.0)#71 | 10.9%(+17.9)#2,836 |
| 72. | Donaldsonville | 28.6% | 13.8%(+14.8)#72 | 10.9%(+17.7)#2,852 |
| 73. | Sun | 28.5% | 13.8%(+14.7)#73 | 10.9%(+17.6)#2,876 |
| 74. | Bayou Blue | 28.0% | 13.8%(+14.2)#74 | 10.9%(+17.1)#2,957 |
| 75. | Vivian | 27.7% | 13.8%(+13.9)#75 | 10.9%(+16.8)#3,001 |
| 76. | Rayville | 27.2% | 13.8%(+13.4)#76 | 10.9%(+16.3)#3,068 |
| 77. | Merryville | 27.1% | 13.8%(+13.3)#77 | 10.9%(+16.2)#3,106 |
| 78. | Cecilia | 26.4% | 13.8%(+12.6)#78 | 10.9%(+15.5)#3,221 |
| 79. | Chackbay | 26.2% | 13.8%(+12.4)#79 | 10.9%(+15.3)#3,267 |
| 80. | Rayne | 26.0% | 13.8%(+12.2)#80 | 10.9%(+15.1)#3,298 |
| 81. | Kinder | 25.6% | 13.8%(+11.8)#81 | 10.9%(+14.7)#3,379 |
| 82. | Bogalusa | 25.2% | 13.8%(+11.4)#82 | 10.9%(+14.3)#3,430 |
| 83. | Larose | 24.6% | 13.8%(+10.8)#83 | 10.9%(+13.7)#3,581 |
| 84. | Ville Platte | 24.5% | 13.8%(+10.7)#84 | 10.9%(+13.6)#3,600 |
| 85. | Sarepta | 24.4% | 13.8%(+10.6)#85 | 10.9%(+13.5)#3,632 |
| 86. | Denham Springs | 23.4% | 13.8%(+9.60)#86 | 10.9%(+12.5)#3,829 |
| 87. | St Gabriel | 23.1% | 13.8%(+9.30)#87 | 10.9%(+12.2)#3,896 |
| 88. | Timberlane | 22.7% | 13.8%(+8.90)#88 | 10.9%(+11.8)#3,998 |
| 89. | Lakeshore | 22.7% | 13.8%(+8.90)#89 | 10.9%(+11.8)#4,004 |
| 90. | Lake Arthur | 22.5% | 13.8%(+8.70)#90 | 10.9%(+11.6)#4,046 |
| 91. | Presquille | 22.5% | 13.8%(+8.70)#91 | 10.9%(+11.6)#4,047 |
| 92. | Chauvin | 22.3% | 13.8%(+8.50)#92 | 10.9%(+11.4)#4,099 |
| 93. | Shreveport | 22.2% | 13.8%(+8.40)#93 | 10.9%(+11.3)#4,108 |
| 94. | Maringouin | 21.8% | 13.8%(+8.00)#94 | 10.9%(+10.9)#4,237 |
| 95. | Harvey | 21.4% | 13.8%(+7.60)#95 | 10.9%(+10.5)#4,320 |
| 96. | Old Jefferson | 21.1% | 13.8%(+7.30)#96 | 10.9%(+10.2)#4,405 |
| 97. | Henderson | 21.0% | 13.8%(+7.20)#97 | 10.9%(+10.1)#4,439 |
| 98. | Duson | 21.0% | 13.8%(+7.20)#98 | 10.9%(+10.1)#4,440 |
| 99. | Morganza | 21.0% | 13.8%(+7.20)#99 | 10.9%(+10.1)#4,449 |
| 100. | Lafitte | 20.8% | 13.8%(+7.00)#100 | 10.9%(+9.90)#4,513 |
Common Questions
What are the Top 10 Cities with the Highest Unemployment Rate Amomg Youth Under the Age of 25 in Louisiana?
Top 10 Cities with the Highest Unemployment Rate Amomg Youth Under the Age of 25 in Louisiana are:
#1
100.0%
#2
100.0%
#3
100.0%
#4
100.0%
#5
100.0%
#6
100.0%
#7
100.0%
#8
99.9%
#9
99.9%
#10
94.2%
What city has the Highest Unemployment Rate Amomg Youth Under the Age of 25 in Louisiana?
Watson has the Highest Unemployment Rate Amomg Youth Under the Age of 25 in Louisiana with 100.0%.
What is the Unemployment Rate Amomg Youth Under the Age of 25 in the State of Louisiana?
Unemployment Rate Amomg Youth Under the Age of 25 in Louisiana is 13.8%.
What is the Unemployment Rate Amomg Youth Under the Age of 25 in the United States?
Unemployment Rate Amomg Youth Under the Age of 25 in the United States is 10.9%.