Oasis, CA Map & Demographics
Oasis Map
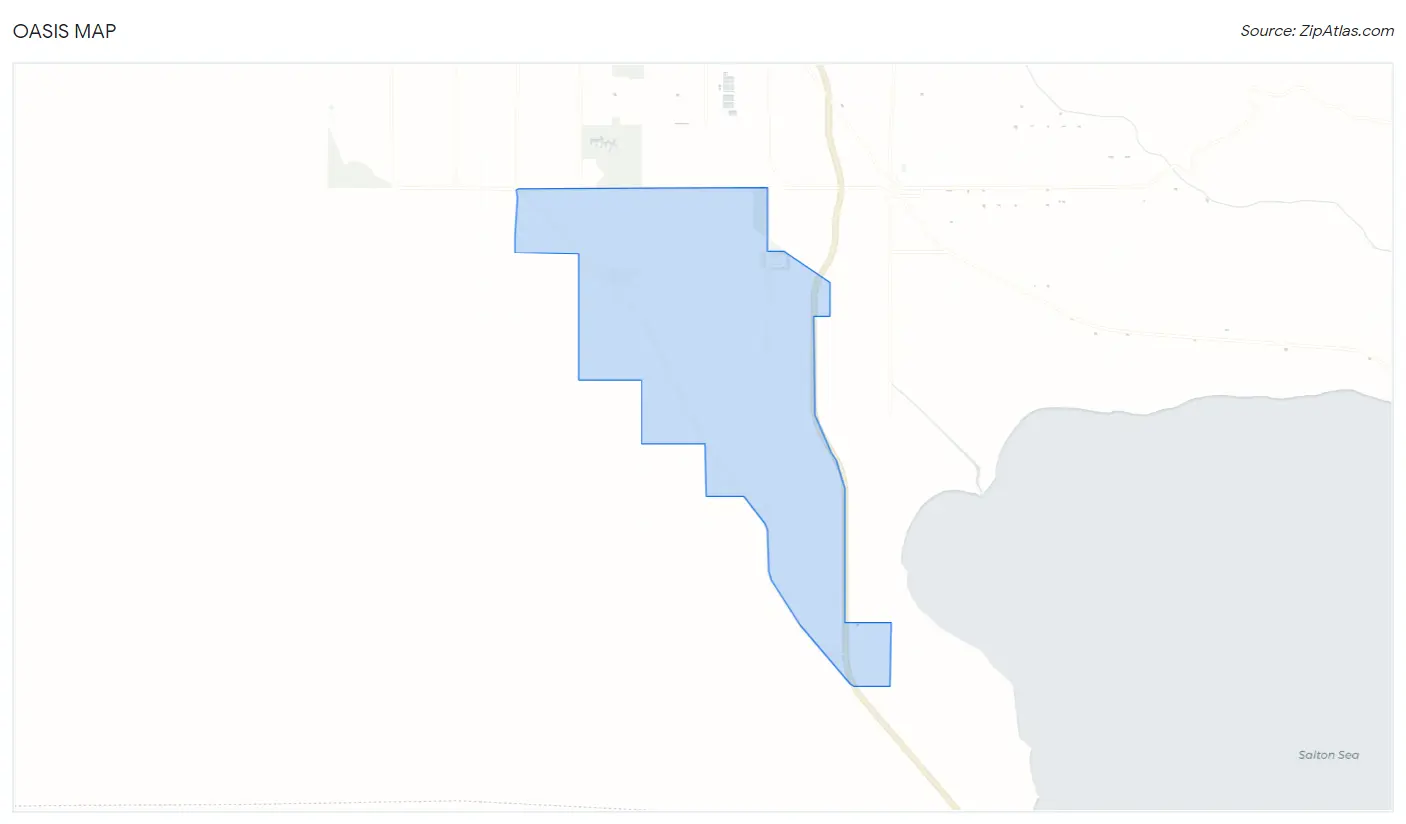
Oasis Overview
$12,149
PER CAPITA INCOME
$32,865
AVG FAMILY INCOME
$25,335
AVG HOUSEHOLD INCOME
33.8%
WAGE / INCOME GAP [ % ]
66.2¢/ $1
WAGE / INCOME GAP [ $ ]
0.40
INEQUALITY / GINI INDEX
3,775
TOTAL POPULATION
2,036
MALE POPULATION
1,739
FEMALE POPULATION
117.08
MALES / 100 FEMALES
85.41
FEMALES / 100 MALES
31.9
MEDIAN AGE
3.9
AVG FAMILY SIZE
3.1
AVG HOUSEHOLD SIZE
2,189
LABOR FORCE [ PEOPLE ]
75.0%
PERCENT IN LABOR FORCE
19.0%
UNEMPLOYMENT RATE
Income in Oasis
Income Overview in Oasis
Per Capita Income in Oasis is $12,149, while median incomes of families and households are $32,865 and $25,335 respectively.
| Characteristic | Number | Measure |
| Per Capita Income | 3,775 | $12,149 |
| Median Family Income | 785 | $32,865 |
| Mean Family Income | 785 | $39,400 |
| Median Household Income | 1,215 | $25,335 |
| Mean Household Income | 1,215 | $34,513 |
| Income Deficit | 785 | $0 |
| Wage / Income Gap (%) | 3,775 | 33.82% |
| Wage / Income Gap ($) | 3,775 | 66.18¢ per $1 |
| Gini / Inequality Index | 3,775 | 0.40 |
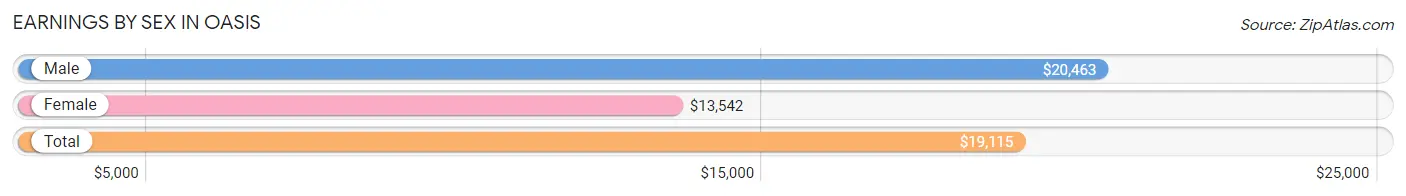
Earnings by Sex in Oasis
Average Earnings in Oasis are $19,115, $20,463 for men and $13,542 for women, a difference of 33.8%.
| Sex | Number | Average Earnings |
| Male | 1,298 (66.9%) | $20,463 |
| Female | 642 (33.1%) | $13,542 |
| Total | 1,940 (100.0%) | $19,115 |
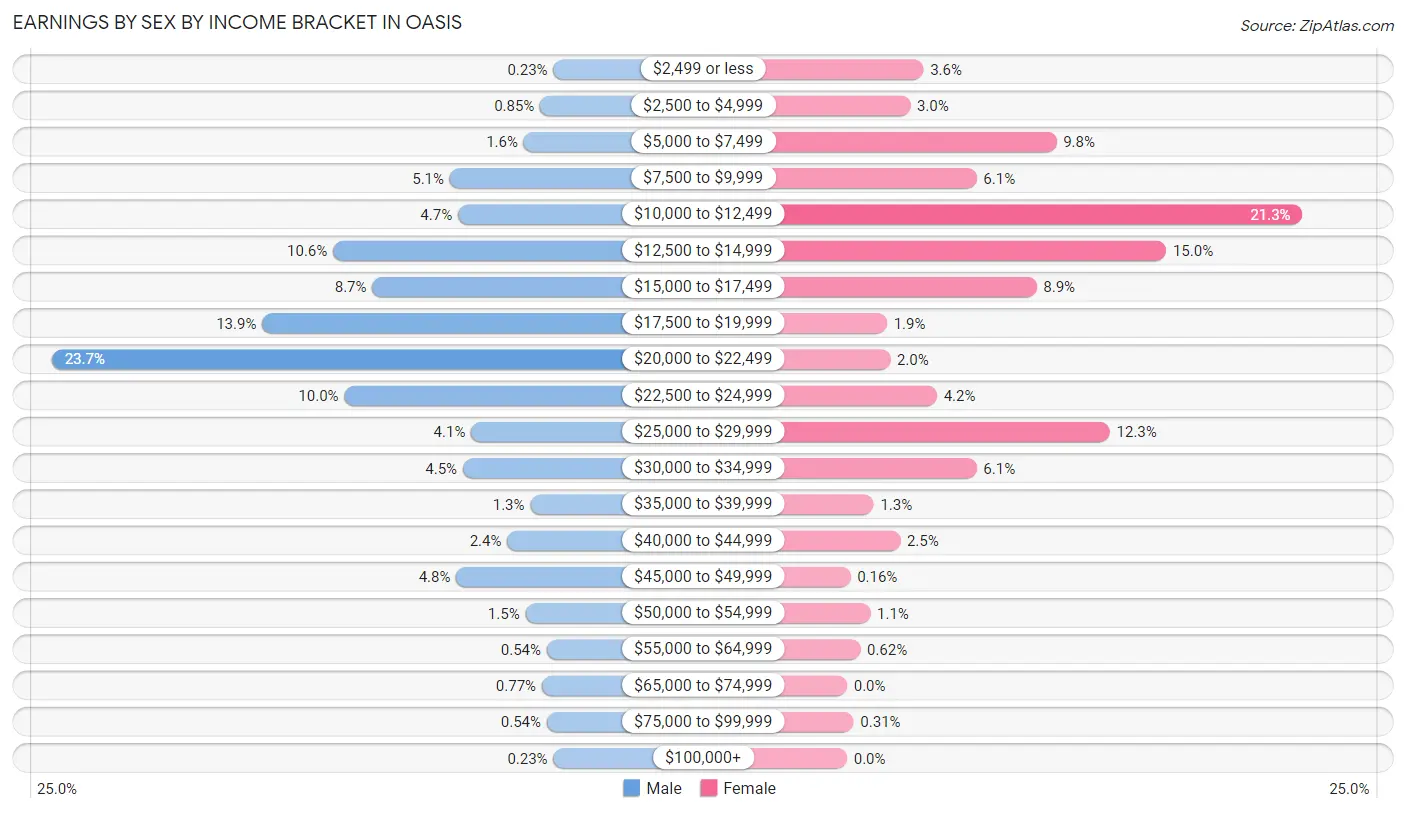
Earnings by Sex by Income Bracket in Oasis
The most common earnings brackets in Oasis are $20,000 to $22,499 for men (308 | 23.7%) and $10,000 to $12,499 for women (137 | 21.3%).
| Income | Male | Female |
| $2,499 or less | 3 (0.2%) | 23 (3.6%) |
| $2,500 to $4,999 | 11 (0.9%) | 19 (3.0%) |
| $5,000 to $7,499 | 21 (1.6%) | 63 (9.8%) |
| $7,500 to $9,999 | 66 (5.1%) | 39 (6.1%) |
| $10,000 to $12,499 | 61 (4.7%) | 137 (21.3%) |
| $12,500 to $14,999 | 137 (10.5%) | 96 (14.9%) |
| $15,000 to $17,499 | 113 (8.7%) | 57 (8.9%) |
| $17,500 to $19,999 | 180 (13.9%) | 12 (1.9%) |
| $20,000 to $22,499 | 308 (23.7%) | 13 (2.0%) |
| $22,500 to $24,999 | 130 (10.0%) | 27 (4.2%) |
| $25,000 to $29,999 | 53 (4.1%) | 79 (12.3%) |
| $30,000 to $34,999 | 58 (4.5%) | 39 (6.1%) |
| $35,000 to $39,999 | 17 (1.3%) | 8 (1.3%) |
| $40,000 to $44,999 | 31 (2.4%) | 16 (2.5%) |
| $45,000 to $49,999 | 62 (4.8%) | 1 (0.2%) |
| $50,000 to $54,999 | 20 (1.5%) | 7 (1.1%) |
| $55,000 to $64,999 | 7 (0.5%) | 4 (0.6%) |
| $65,000 to $74,999 | 10 (0.8%) | 0 (0.0%) |
| $75,000 to $99,999 | 7 (0.5%) | 2 (0.3%) |
| $100,000+ | 3 (0.2%) | 0 (0.0%) |
| Total | 1,298 (100.0%) | 642 (100.0%) |
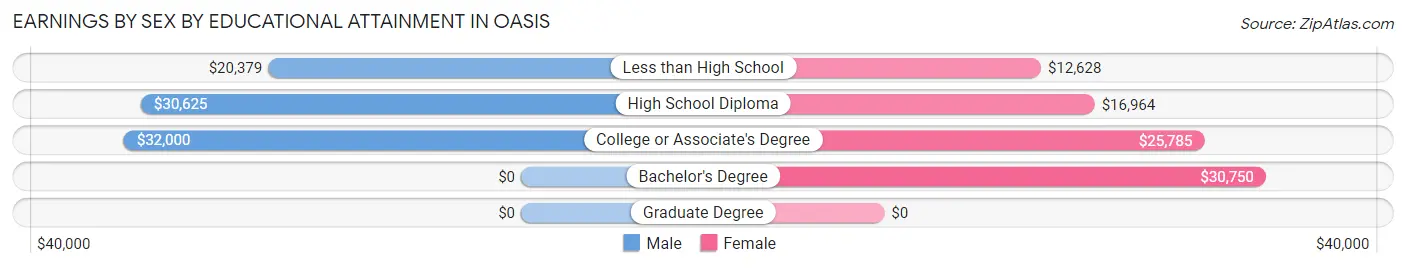
Earnings by Sex by Educational Attainment in Oasis
Average earnings in Oasis are $20,644 for men and $13,516 for women, a difference of 34.5%. Men with an educational attainment of college or associate's degree enjoy the highest average annual earnings of $32,000, while those with less than high school education earn the least with $20,379. Women with an educational attainment of bachelor's degree earn the most with the average annual earnings of $30,750, while those with less than high school education have the smallest earnings of $12,628.
| Educational Attainment | Male Income | Female Income |
| Less than High School | $20,379 | $12,628 |
| High School Diploma | $30,625 | $16,964 |
| College or Associate's Degree | $32,000 | $25,785 |
| Bachelor's Degree | - | - |
| Graduate Degree | - | - |
| Total | $20,644 | $13,516 |
Family Income in Oasis
Family Income Brackets in Oasis
According to the Oasis family income data, there are 220 families falling into the $15,000 to $24,999 income range, which is the most common income bracket and makes up 28.0% of all families. Conversely, the $200,000+ income bracket is the least frequent group with only 3 families (0.4%) belonging to this category.
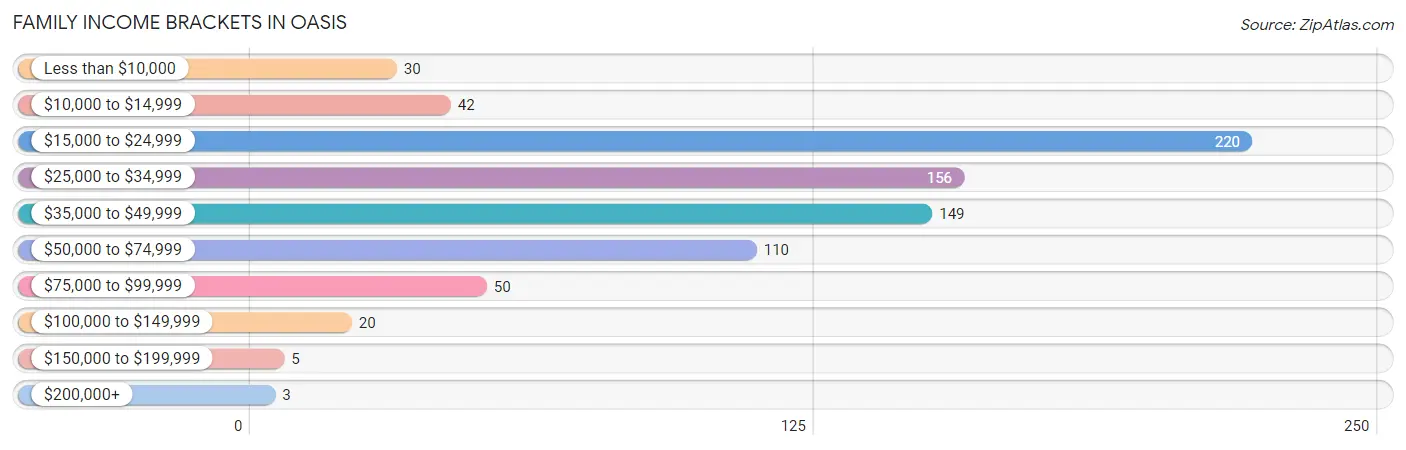
| Income Bracket | # Families | % Families |
| Less than $10,000 | 30 | 3.8% |
| $10,000 to $14,999 | 42 | 5.4% |
| $15,000 to $24,999 | 220 | 28.0% |
| $25,000 to $34,999 | 156 | 19.9% |
| $35,000 to $49,999 | 149 | 19.0% |
| $50,000 to $74,999 | 110 | 14.0% |
| $75,000 to $99,999 | 50 | 6.4% |
| $100,000 to $149,999 | 20 | 2.5% |
| $150,000 to $199,999 | 5 | 0.6% |
| $200,000+ | 3 | 0.4% |
Family Income by Famaliy Size in Oasis
7+ person families (31 | 4.0%) account for the highest median family income in Oasis with $66,250 per family, while 2-person families (244 | 31.1%) have the highest median income of $15,341 per family member.
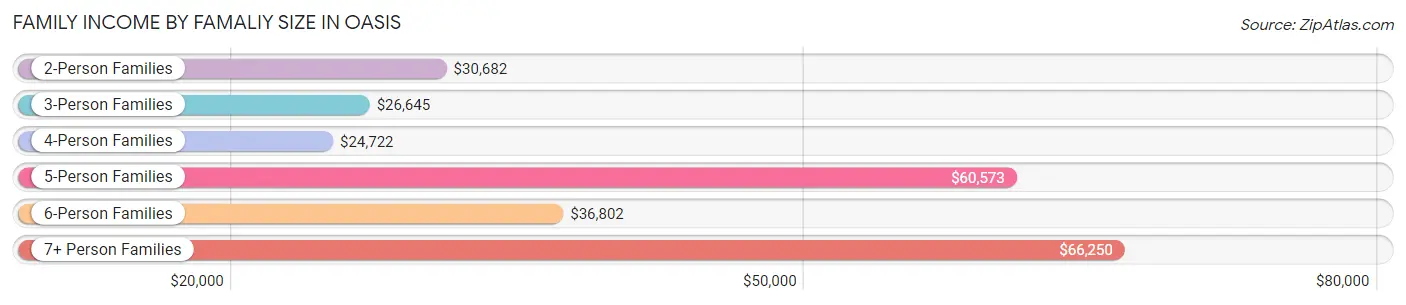
| Income Bracket | # Families | Median Income |
| 2-Person Families | 244 (31.1%) | $30,682 |
| 3-Person Families | 175 (22.3%) | $26,645 |
| 4-Person Families | 122 (15.5%) | $24,722 |
| 5-Person Families | 125 (15.9%) | $60,573 |
| 6-Person Families | 88 (11.2%) | $36,802 |
| 7+ Person Families | 31 (4.0%) | $66,250 |
| Total | 785 (100.0%) | $32,865 |
Family Income by Number of Earners in Oasis
The median family income in Oasis is $32,865, with families comprising 3+ earners (117) having the highest median family income of $66,250, while families with no earners (30) have the lowest median family income of $20,000, accounting for 14.9% and 3.8% of families, respectively.
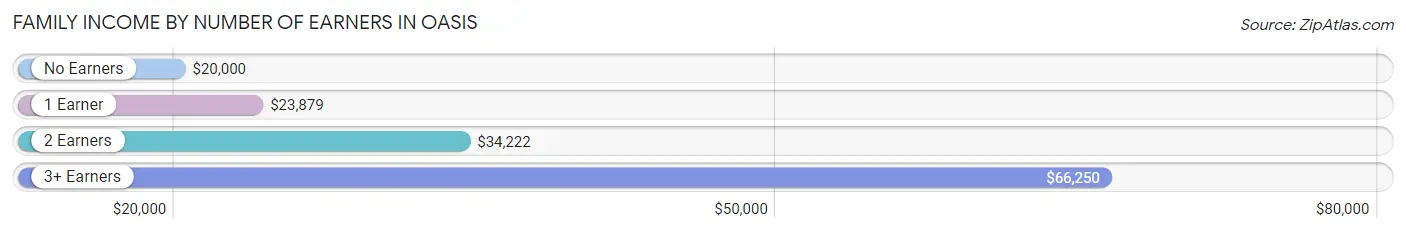
| Number of Earners | # Families | Median Income |
| No Earners | 30 (3.8%) | $20,000 |
| 1 Earner | 347 (44.2%) | $23,879 |
| 2 Earners | 291 (37.1%) | $34,222 |
| 3+ Earners | 117 (14.9%) | $66,250 |
| Total | 785 (100.0%) | $32,865 |
Household Income in Oasis
Household Income Brackets in Oasis
With 347 households falling in the category, the $15,000 to $24,999 income range is the most frequent in Oasis, accounting for 28.6% of all households. In contrast, only 2 households (0.2%) fall into the $200,000+ income bracket, making it the least populous group.
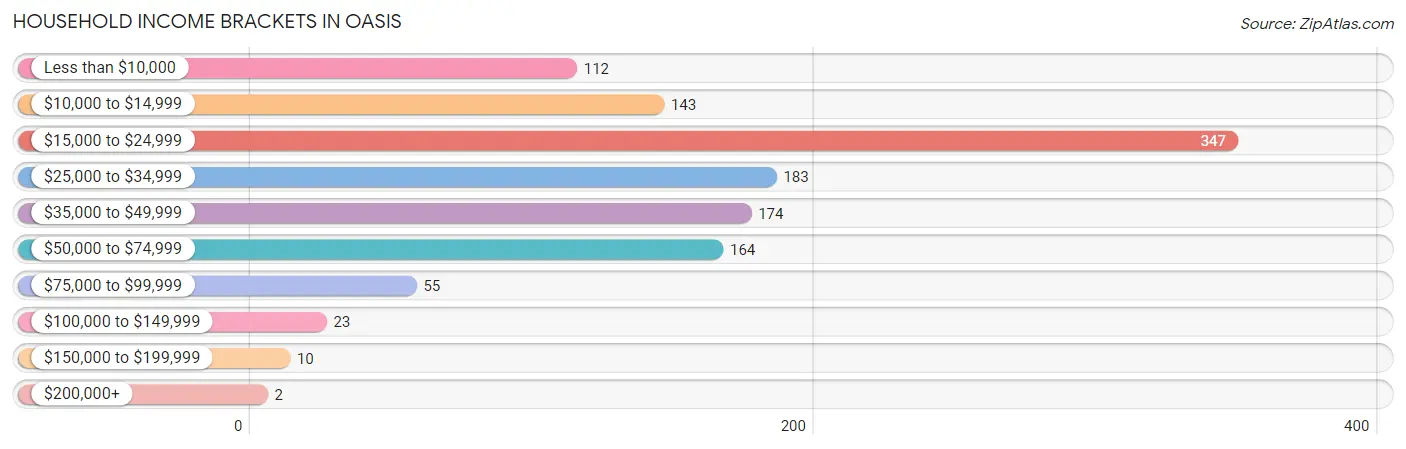
| Income Bracket | # Households | % Households |
| Less than $10,000 | 112 | 9.2% |
| $10,000 to $14,999 | 143 | 11.8% |
| $15,000 to $24,999 | 347 | 28.6% |
| $25,000 to $34,999 | 183 | 15.1% |
| $35,000 to $49,999 | 174 | 14.3% |
| $50,000 to $74,999 | 164 | 13.5% |
| $75,000 to $99,999 | 55 | 4.5% |
| $100,000 to $149,999 | 23 | 1.9% |
| $150,000 to $199,999 | 10 | 0.8% |
| $200,000+ | 2 | 0.2% |
Household Income by Householder Age in Oasis
The median household income in Oasis is $25,335, with the highest median household income of $30,337 found in the 45 to 64 years age bracket for the primary householder. A total of 609 households (50.1%) fall into this category. Meanwhile, the 15 to 24 years age bracket for the primary householder has the lowest median household income of $15,750, with 41 households (3.4%) in this group.
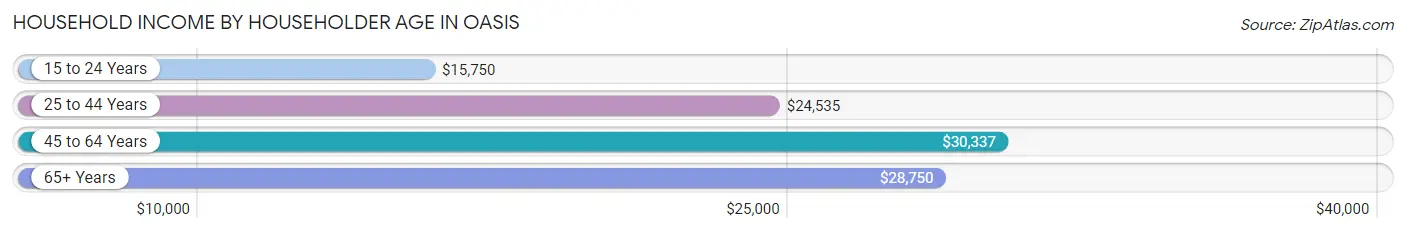
| Income Bracket | # Households | Median Income |
| 15 to 24 Years | 41 (3.4%) | $15,750 |
| 25 to 44 Years | 446 (36.7%) | $24,535 |
| 45 to 64 Years | 609 (50.1%) | $30,337 |
| 65+ Years | 119 (9.8%) | $28,750 |
| Total | 1,215 (100.0%) | $25,335 |
Poverty in Oasis
Income Below Poverty by Sex and Age in Oasis
With 33.9% poverty level for males and 53.6% for females among the residents of Oasis, 15 year old males and 6 to 11 year old females are the most vulnerable to poverty, with 34 males (77.3%) and 143 females (70.1%) in their respective age groups living below the poverty level.
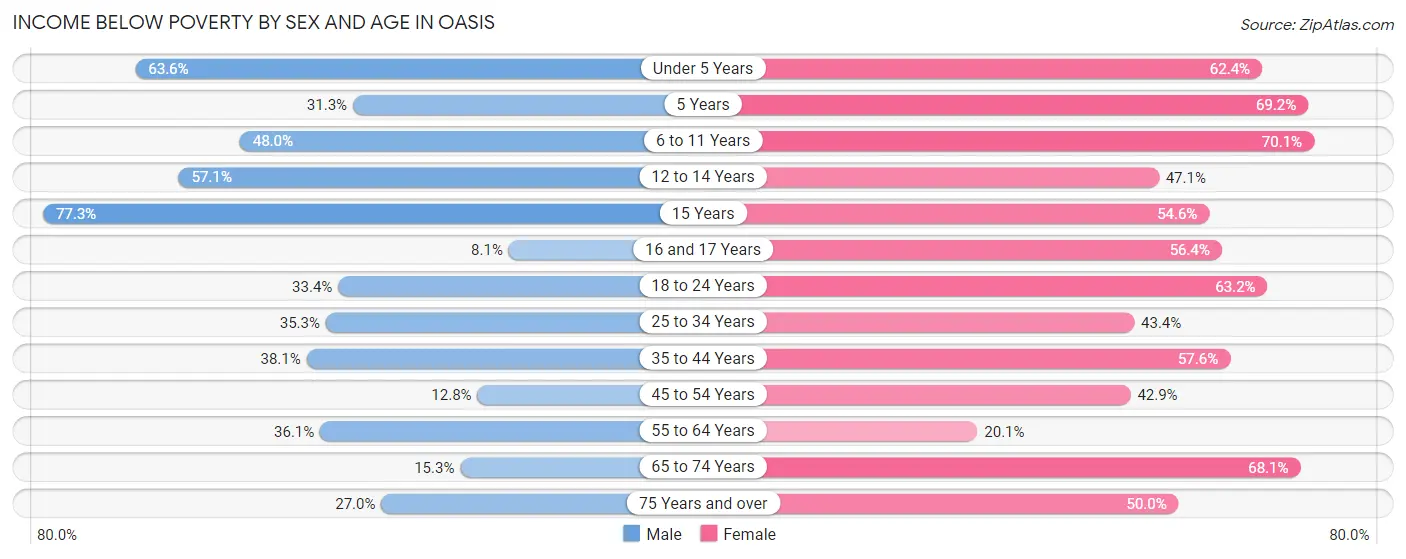
| Age Bracket | Male | Female |
| Under 5 Years | 68 (63.5%) | 63 (62.4%) |
| 5 Years | 5 (31.2%) | 18 (69.2%) |
| 6 to 11 Years | 98 (48.0%) | 143 (70.1%) |
| 12 to 14 Years | 40 (57.1%) | 24 (47.1%) |
| 15 Years | 34 (77.3%) | 18 (54.5%) |
| 16 and 17 Years | 3 (8.1%) | 22 (56.4%) |
| 18 to 24 Years | 101 (33.4%) | 249 (63.2%) |
| 25 to 34 Years | 79 (35.3%) | 79 (43.4%) |
| 35 to 44 Years | 106 (38.1%) | 132 (57.6%) |
| 45 to 54 Years | 50 (12.8%) | 120 (42.9%) |
| 55 to 64 Years | 82 (36.1%) | 30 (20.1%) |
| 65 to 74 Years | 15 (15.3%) | 32 (68.1%) |
| 75 Years and over | 10 (27.0%) | 2 (50.0%) |
| Total | 691 (33.9%) | 932 (53.6%) |
Income Above Poverty by Sex and Age in Oasis
According to the poverty statistics in Oasis, males aged 16 and 17 years and females aged 55 to 64 years are the age groups that are most secure financially, with 91.9% of males and 79.9% of females in these age groups living above the poverty line.
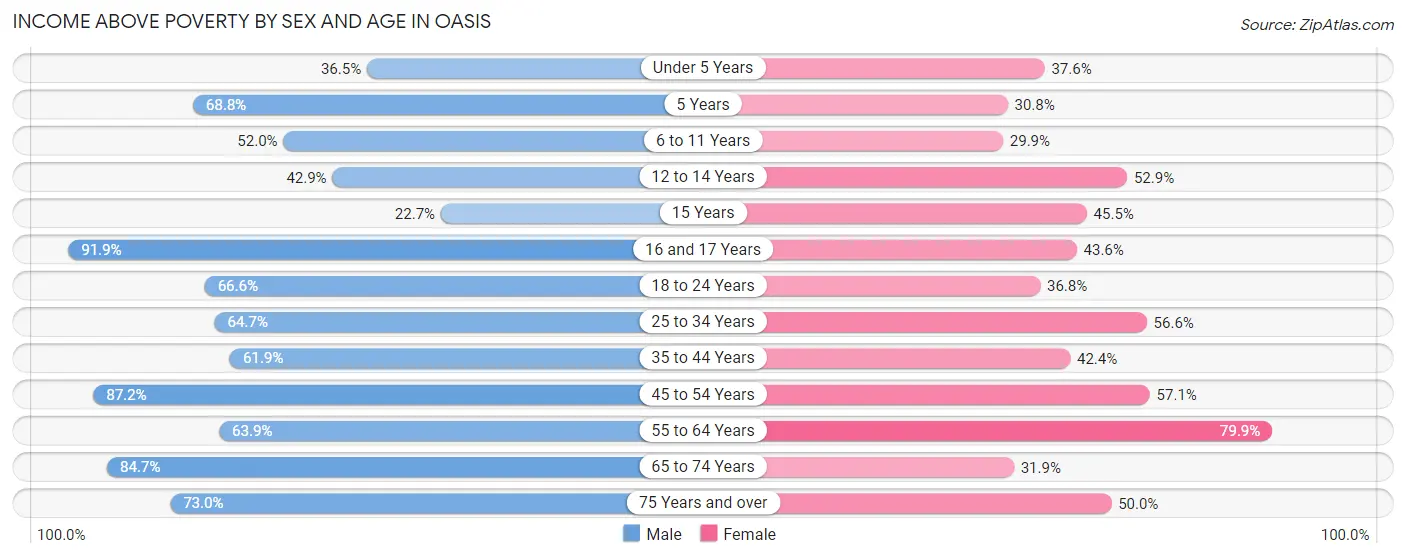
| Age Bracket | Male | Female |
| Under 5 Years | 39 (36.4%) | 38 (37.6%) |
| 5 Years | 11 (68.8%) | 8 (30.8%) |
| 6 to 11 Years | 106 (52.0%) | 61 (29.9%) |
| 12 to 14 Years | 30 (42.9%) | 27 (52.9%) |
| 15 Years | 10 (22.7%) | 15 (45.5%) |
| 16 and 17 Years | 34 (91.9%) | 17 (43.6%) |
| 18 to 24 Years | 201 (66.6%) | 145 (36.8%) |
| 25 to 34 Years | 145 (64.7%) | 103 (56.6%) |
| 35 to 44 Years | 172 (61.9%) | 97 (42.4%) |
| 45 to 54 Years | 342 (87.2%) | 160 (57.1%) |
| 55 to 64 Years | 145 (63.9%) | 119 (79.9%) |
| 65 to 74 Years | 83 (84.7%) | 15 (31.9%) |
| 75 Years and over | 27 (73.0%) | 2 (50.0%) |
| Total | 1,345 (66.1%) | 807 (46.4%) |
Income Below Poverty Among Married-Couple Families in Oasis
The poverty statistics for married-couple families in Oasis show that 32.4% or 177 of the total 547 families live below the poverty line. Families with 5 or more children have the highest poverty rate of 60.0%, comprising of 3 families. On the other hand, families with no children have the lowest poverty rate of 15.4%, which includes 40 families.
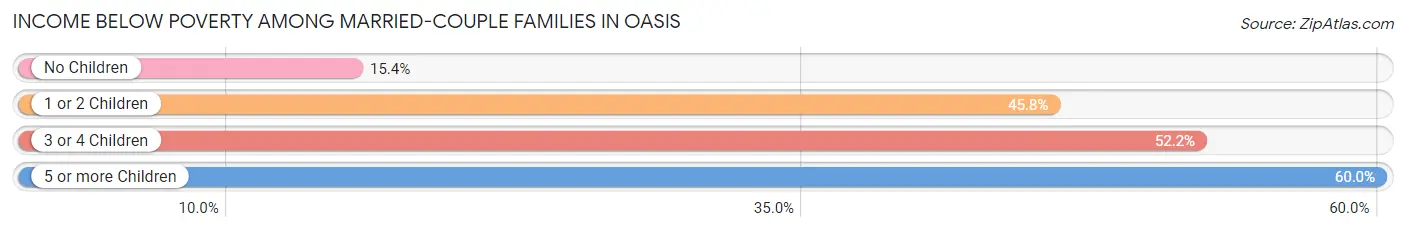
| Children | Above Poverty | Below Poverty |
| No Children | 219 (84.6%) | 40 (15.4%) |
| 1 or 2 Children | 116 (54.2%) | 98 (45.8%) |
| 3 or 4 Children | 33 (47.8%) | 36 (52.2%) |
| 5 or more Children | 2 (40.0%) | 3 (60.0%) |
| Total | 370 (67.6%) | 177 (32.4%) |
Income Below Poverty Among Single-Parent Households in Oasis
According to the poverty data in Oasis, 12.5% or 6 single-father households and 64.7% or 123 single-mother households are living below the poverty line. Among single-father households, those with no children have the highest poverty rate, with 6 households (13.6%) experiencing poverty. Likewise, among single-mother households, those with 3 or 4 children have the highest poverty rate, with 37 households (84.1%) falling below the poverty line.
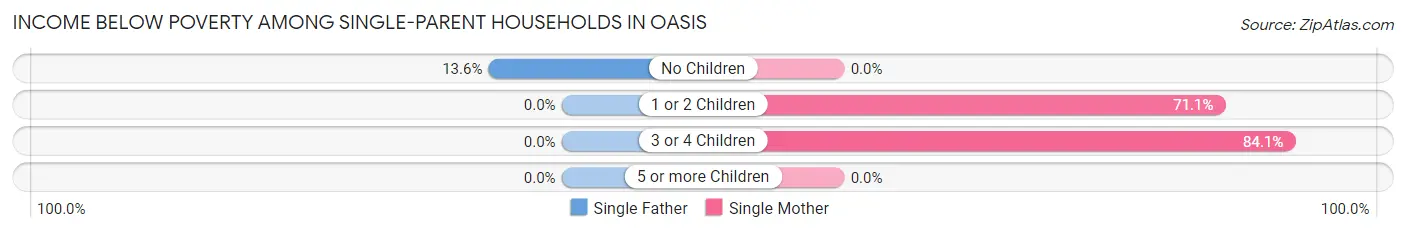
| Children | Single Father | Single Mother |
| No Children | 6 (13.6%) | 0 (0.0%) |
| 1 or 2 Children | 0 (0.0%) | 86 (71.1%) |
| 3 or 4 Children | 0 (0.0%) | 37 (84.1%) |
| 5 or more Children | 0 (0.0%) | 0 (0.0%) |
| Total | 6 (12.5%) | 123 (64.7%) |
Income Below Poverty Among Married-Couple vs Single-Parent Households in Oasis
The poverty data for Oasis shows that 177 of the married-couple family households (32.4%) and 129 of the single-parent households (54.2%) are living below the poverty level. Within the married-couple family households, those with 5 or more children have the highest poverty rate, with 3 households (60.0%) falling below the poverty line. Among the single-parent households, those with 3 or 4 children have the highest poverty rate, with 37 household (84.1%) living below poverty.
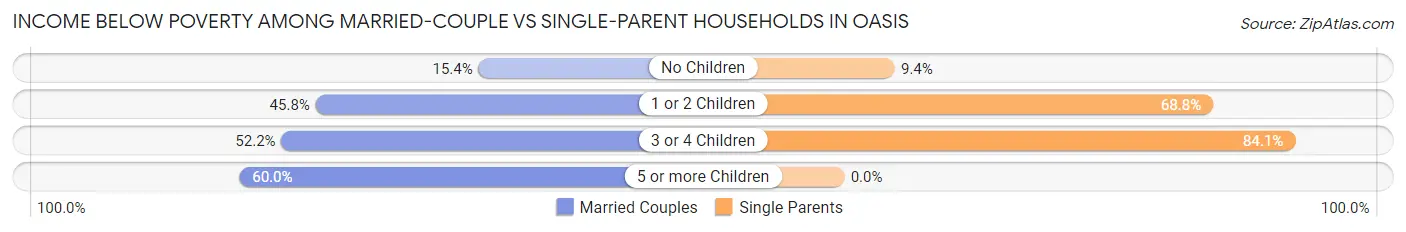
| Children | Married-Couple Families | Single-Parent Households |
| No Children | 40 (15.4%) | 6 (9.4%) |
| 1 or 2 Children | 98 (45.8%) | 86 (68.8%) |
| 3 or 4 Children | 36 (52.2%) | 37 (84.1%) |
| 5 or more Children | 3 (60.0%) | 0 (0.0%) |
| Total | 177 (32.4%) | 129 (54.2%) |
Race in Oasis
The most populous races in Oasis are Hispanic or Latino (3,679 | 97.5%), Two or more Races (1,745 | 46.2%), and Some other Race (1,626 | 43.1%).
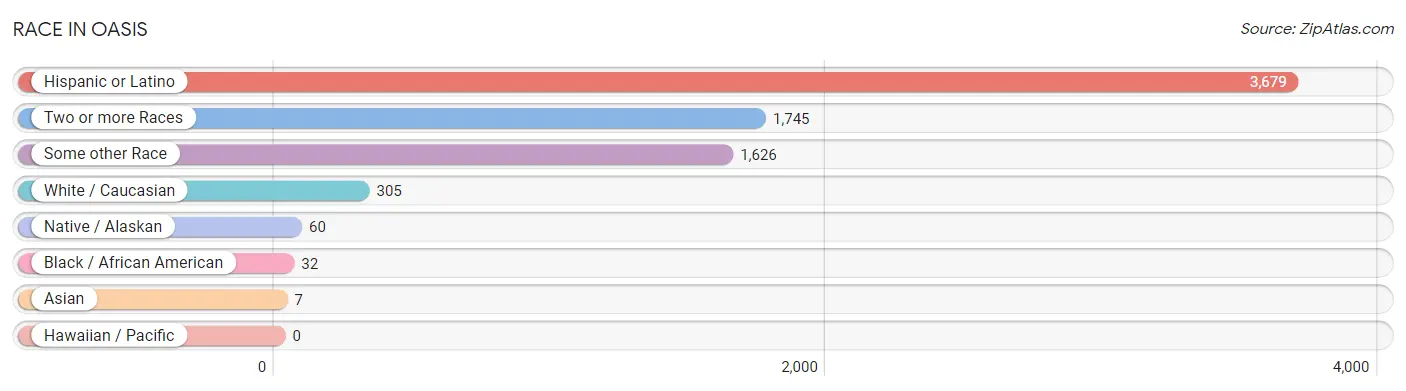
| Race | # Population | % Population |
| Asian | 7 | 0.2% |
| Black / African American | 32 | 0.9% |
| Hawaiian / Pacific | 0 | 0.0% |
| Hispanic or Latino | 3,679 | 97.5% |
| Native / Alaskan | 60 | 1.6% |
| White / Caucasian | 305 | 8.1% |
| Two or more Races | 1,745 | 46.2% |
| Some other Race | 1,626 | 43.1% |
| Total | 3,775 | 100.0% |
Ancestry in Oasis
The most populous ancestries reported in Oasis are Mexican (3,598 | 95.3%), Central American (71 | 1.9%), Honduran (59 | 1.6%), Indian (Asian) (32 | 0.9%), and Mexican American Indian (27 | 0.7%), together accounting for 100.3% of all Oasis residents.
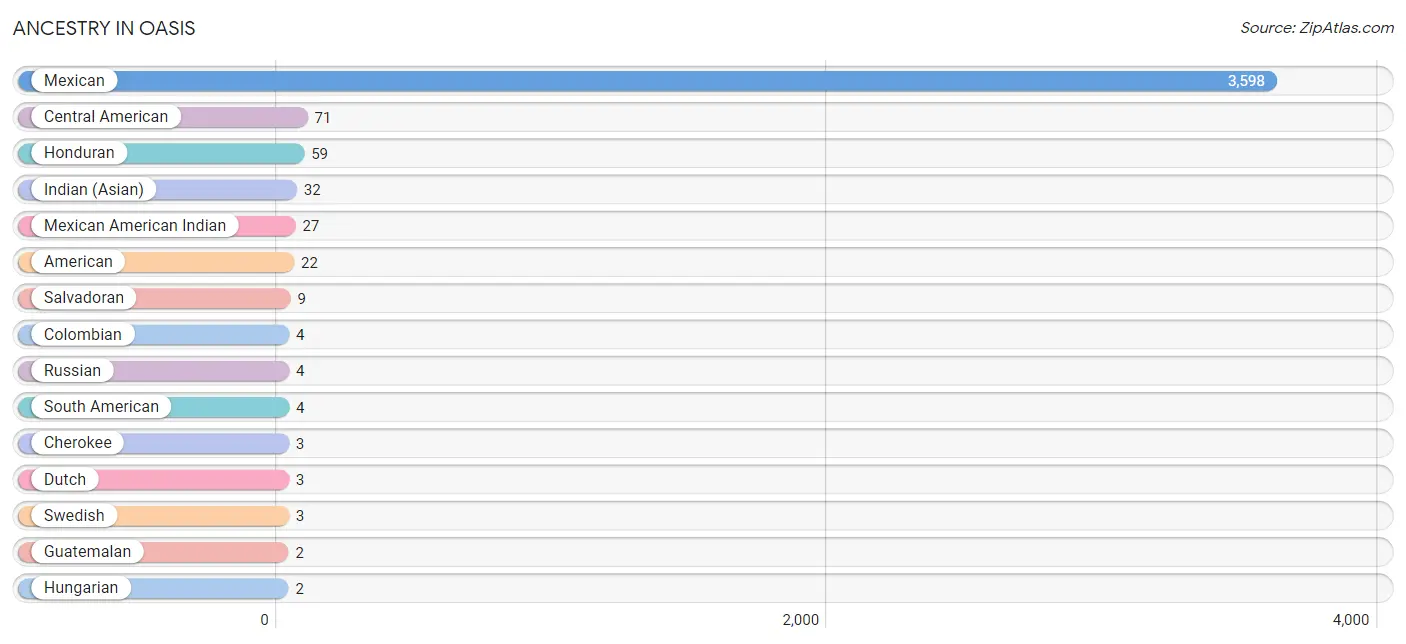
| Ancestry | # Population | % Population |
| American | 22 | 0.6% |
| Bhutanese | 1 | 0.0% |
| Central American | 71 | 1.9% |
| Cherokee | 3 | 0.1% |
| Colombian | 4 | 0.1% |
| Dutch | 3 | 0.1% |
| Guatemalan | 2 | 0.1% |
| Honduran | 59 | 1.6% |
| Hungarian | 2 | 0.1% |
| Indian (Asian) | 32 | 0.9% |
| Irish | 2 | 0.1% |
| Korean | 2 | 0.1% |
| Mexican | 3,598 | 95.3% |
| Mexican American Indian | 27 | 0.7% |
| Nicaraguan | 1 | 0.0% |
| Puerto Rican | 1 | 0.0% |
| Russian | 4 | 0.1% |
| Salvadoran | 9 | 0.2% |
| South American | 4 | 0.1% |
| Swedish | 3 | 0.1% | View All 20 Rows |
Immigrants in Oasis
The most numerous immigrant groups reported in Oasis came from Central America (2,131 | 56.5%), Latin America (2,131 | 56.5%), Mexico (2,095 | 55.5%), Honduras (28 | 0.7%), and Asia (6 | 0.2%), together accounting for 169.3% of all Oasis residents.
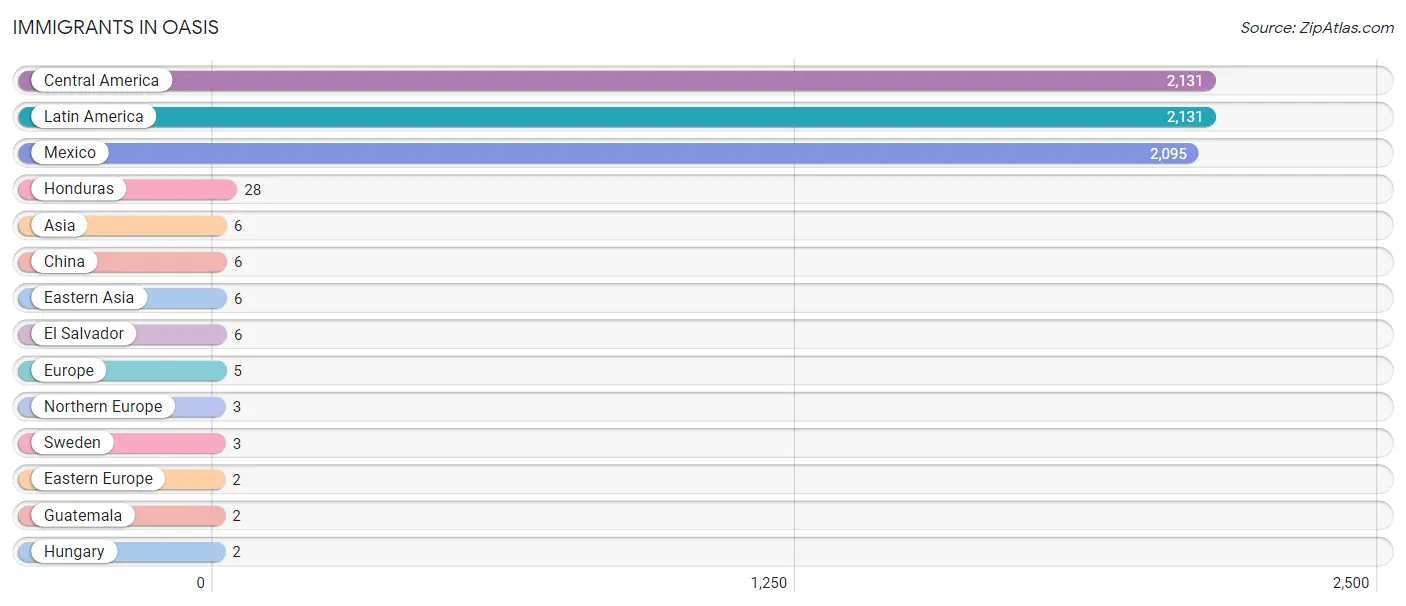
| Immigration Origin | # Population | % Population |
| Asia | 6 | 0.2% |
| Central America | 2,131 | 56.5% |
| China | 6 | 0.2% |
| Eastern Asia | 6 | 0.2% |
| Eastern Europe | 2 | 0.1% |
| El Salvador | 6 | 0.2% |
| Europe | 5 | 0.1% |
| Guatemala | 2 | 0.1% |
| Honduras | 28 | 0.7% |
| Hungary | 2 | 0.1% |
| Latin America | 2,131 | 56.5% |
| Mexico | 2,095 | 55.5% |
| Northern Europe | 3 | 0.1% |
| Sweden | 3 | 0.1% | View All 14 Rows |
Sex and Age in Oasis
Sex and Age in Oasis
The most populous age groups in Oasis are 20 to 24 Years (267 | 13.1%) for men and 15 to 19 Years (237 | 13.6%) for women.
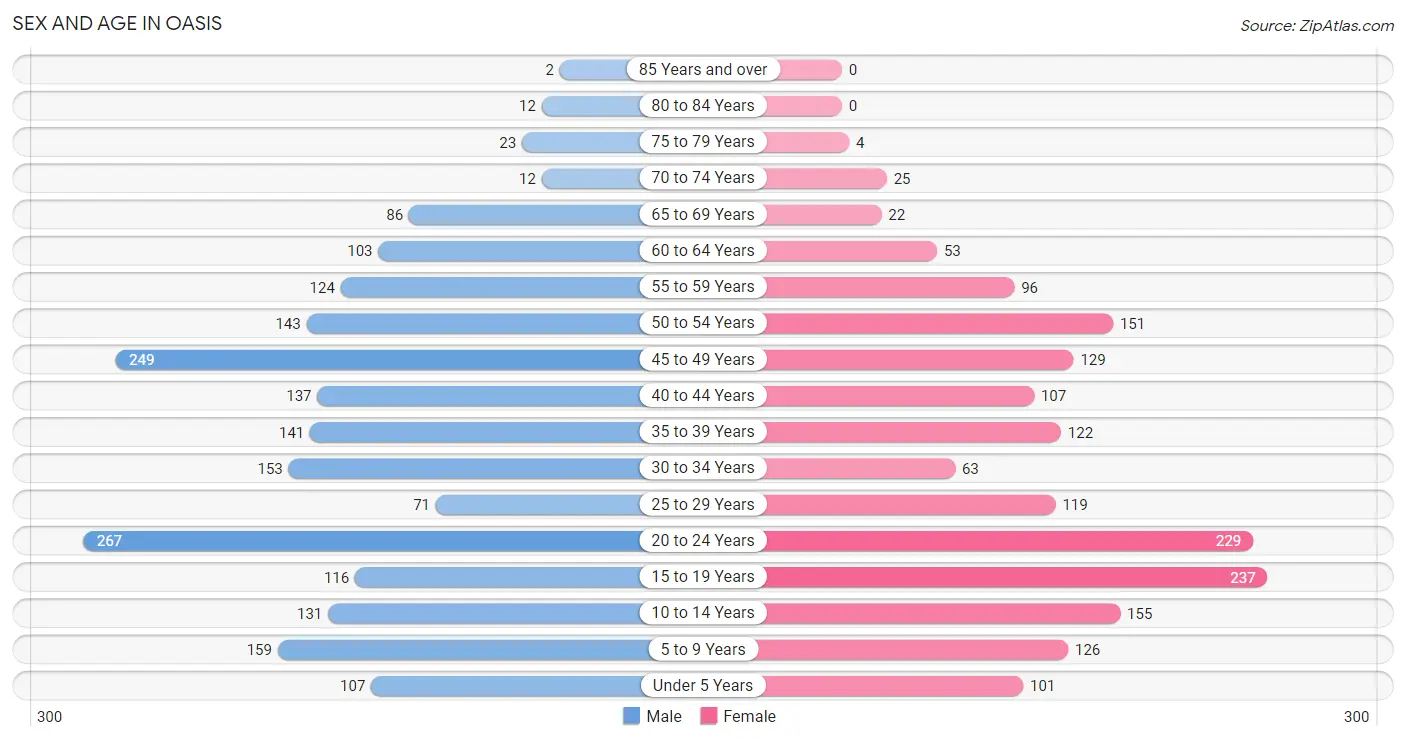
| Age Bracket | Male | Female |
| Under 5 Years | 107 (5.3%) | 101 (5.8%) |
| 5 to 9 Years | 159 (7.8%) | 126 (7.2%) |
| 10 to 14 Years | 131 (6.4%) | 155 (8.9%) |
| 15 to 19 Years | 116 (5.7%) | 237 (13.6%) |
| 20 to 24 Years | 267 (13.1%) | 229 (13.2%) |
| 25 to 29 Years | 71 (3.5%) | 119 (6.8%) |
| 30 to 34 Years | 153 (7.5%) | 63 (3.6%) |
| 35 to 39 Years | 141 (6.9%) | 122 (7.0%) |
| 40 to 44 Years | 137 (6.7%) | 107 (6.1%) |
| 45 to 49 Years | 249 (12.2%) | 129 (7.4%) |
| 50 to 54 Years | 143 (7.0%) | 151 (8.7%) |
| 55 to 59 Years | 124 (6.1%) | 96 (5.5%) |
| 60 to 64 Years | 103 (5.1%) | 53 (3.0%) |
| 65 to 69 Years | 86 (4.2%) | 22 (1.3%) |
| 70 to 74 Years | 12 (0.6%) | 25 (1.4%) |
| 75 to 79 Years | 23 (1.1%) | 4 (0.2%) |
| 80 to 84 Years | 12 (0.6%) | 0 (0.0%) |
| 85 Years and over | 2 (0.1%) | 0 (0.0%) |
| Total | 2,036 (100.0%) | 1,739 (100.0%) |
Families and Households in Oasis
Median Family Size in Oasis
The median family size in Oasis is 3.94 persons per family, with single female/mother families (190 | 24.2%) accounting for the largest median family size of 5.06 persons per family. On the other hand, single male/father families (48 | 6.1%) represent the smallest median family size with 2.21 persons per family.
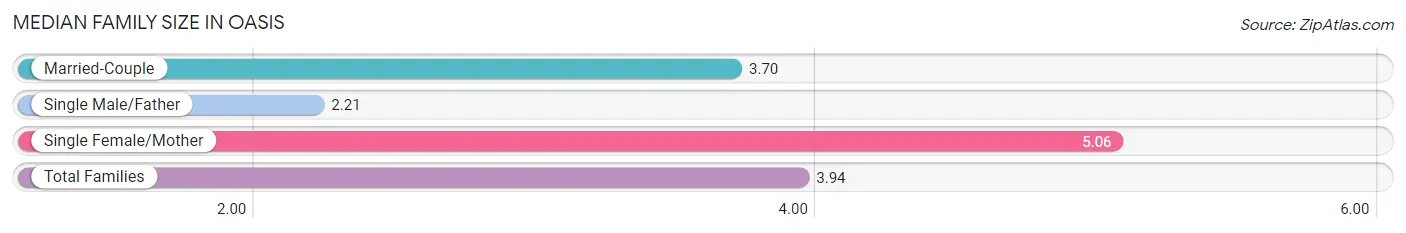
| Family Type | # Families | Family Size |
| Married-Couple | 547 (69.7%) | 3.70 |
| Single Male/Father | 48 (6.1%) | 2.21 |
| Single Female/Mother | 190 (24.2%) | 5.06 |
| Total Families | 785 (100.0%) | 3.94 |
Median Household Size in Oasis
The median household size in Oasis is 3.08 persons per household, with single female/mother households (190 | 15.6%) accounting for the largest median household size of 5.17 persons per household. non-family households (430 | 35.4%) represent the smallest median household size with 1.42 persons per household.
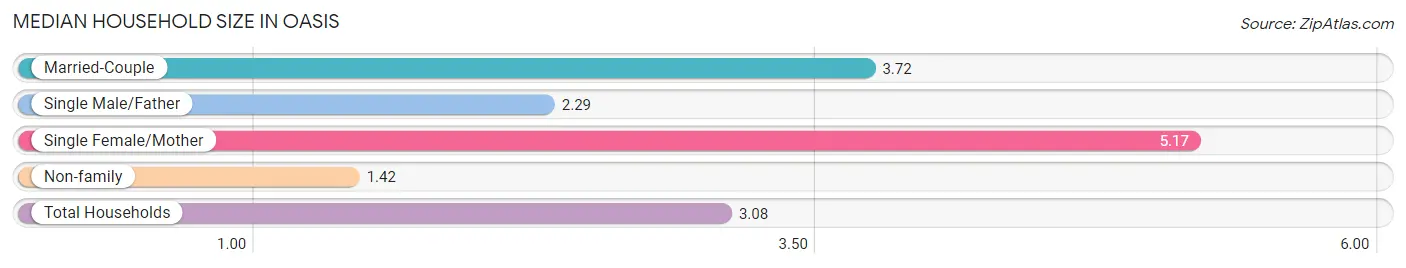
| Household Type | # Households | Household Size |
| Married-Couple | 547 (45.0%) | 3.72 |
| Single Male/Father | 48 (4.0%) | 2.29 |
| Single Female/Mother | 190 (15.6%) | 5.17 |
| Non-family | 430 (35.4%) | 1.42 |
| Total Households | 1,215 (100.0%) | 3.08 |
Household Size by Marriage Status in Oasis
Out of a total of 1,215 households in Oasis, 785 (64.6%) are family households, while 430 (35.4%) are nonfamily households. The most numerous type of family households are 2-person households, comprising 235, and the most common type of nonfamily households are 1-person households, comprising 345.
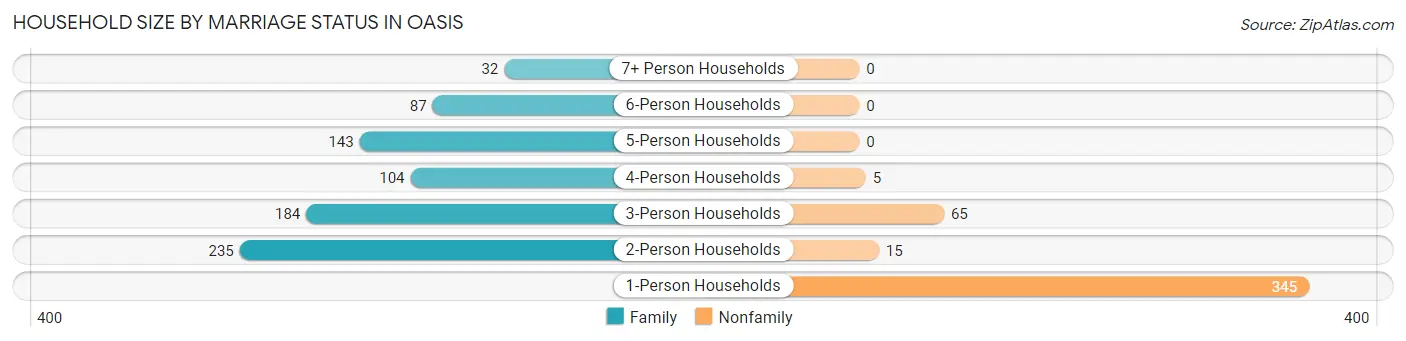
| Household Size | Family Households | Nonfamily Households |
| 1-Person Households | - | 345 (28.4%) |
| 2-Person Households | 235 (19.3%) | 15 (1.2%) |
| 3-Person Households | 184 (15.1%) | 65 (5.3%) |
| 4-Person Households | 104 (8.6%) | 5 (0.4%) |
| 5-Person Households | 143 (11.8%) | 0 (0.0%) |
| 6-Person Households | 87 (7.2%) | 0 (0.0%) |
| 7+ Person Households | 32 (2.6%) | 0 (0.0%) |
| Total | 785 (64.6%) | 430 (35.4%) |
Female Fertility in Oasis
Fertility by Age in Oasis
Average fertility rate in Oasis is 56.0 births per 1,000 women. Women in the age bracket of 20 to 34 years have the highest fertility rate with 141.0 births per 1,000 women. Women in the age bracket of 20 to 34 years acount for 100.0% of all women with births.
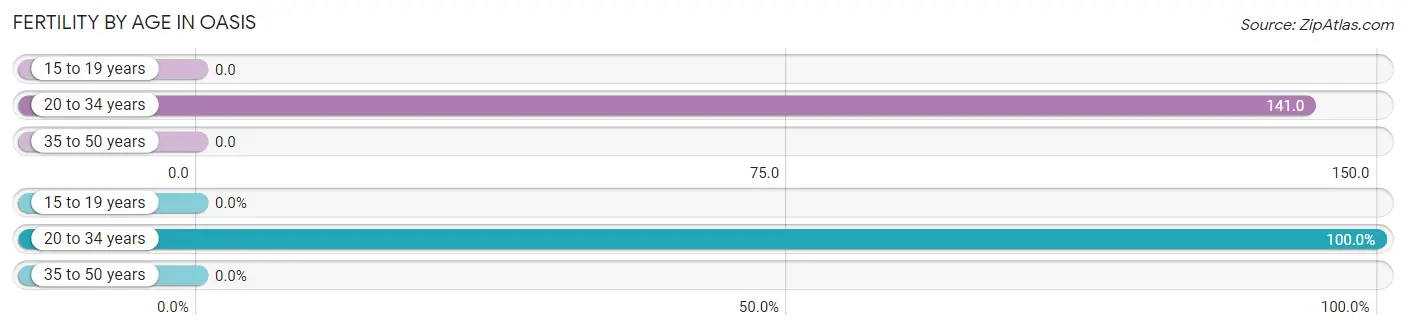
| Age Bracket | Women with Births | Births / 1,000 Women |
| 15 to 19 years | 0 (0.0%) | 0.0 |
| 20 to 34 years | 58 (100.0%) | 141.0 |
| 35 to 50 years | 0 (0.0%) | 0.0 |
| Total | 58 (100.0%) | 56.0 |
Fertility by Age by Marriage Status in Oasis
84.5% of women with births (58) in Oasis are married. The highest percentage of unmarried women with births falls into 20 to 34 years age bracket with 15.5% of them unmarried at the time of birth, while the lowest percentage of unmarried women with births belong to 20 to 34 years age bracket with 15.5% of them unmarried.
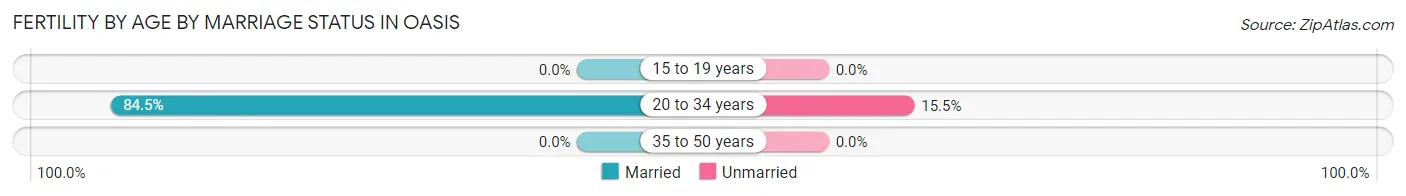
| Age Bracket | Married | Unmarried |
| 15 to 19 years | 0 (0.0%) | 0 (0.0%) |
| 20 to 34 years | 49 (84.5%) | 9 (15.5%) |
| 35 to 50 years | 0 (0.0%) | 0 (0.0%) |
| Total | 49 (84.5%) | 9 (15.5%) |
Fertility by Education in Oasis
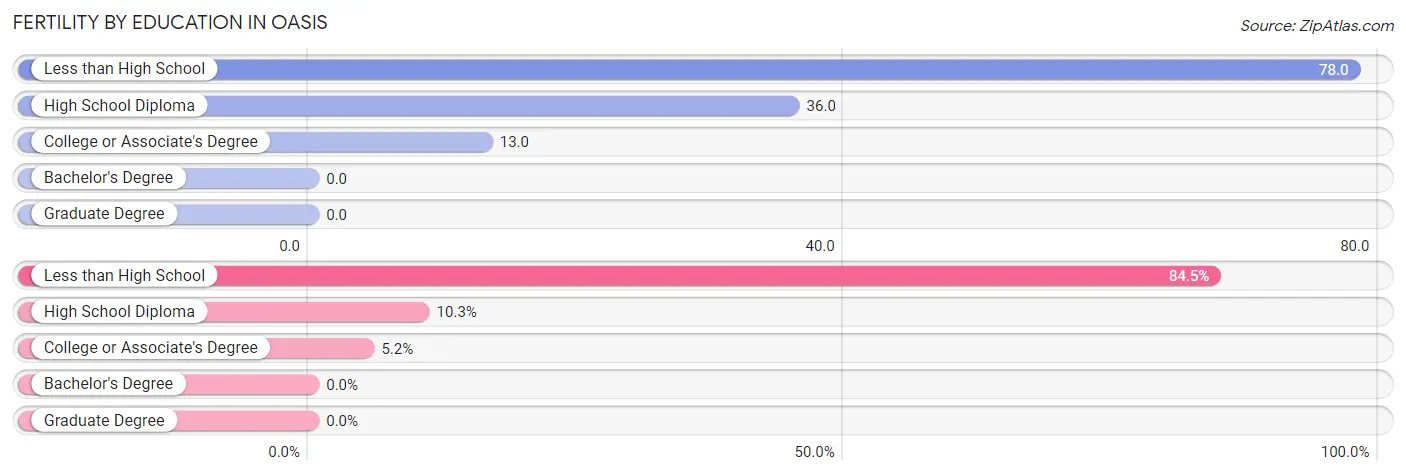
| Educational Attainment | Women with Births | Births / 1,000 Women |
| Less than High School | 49 (84.5%) | 78.0 |
| High School Diploma | 6 (10.3%) | 36.0 |
| College or Associate's Degree | 3 (5.2%) | 13.0 |
| Bachelor's Degree | 0 (0.0%) | 0.0 |
| Graduate Degree | 0 (0.0%) | 0.0 |
| Total | 58 (100.0%) | 56.0 |
Fertility by Education by Marriage Status in Oasis
15.5% of women with births in Oasis are unmarried. Women with the educational attainment of college or associate's degree are most likely to be married with 100.0% of them married at childbirth, while women with the educational attainment of high school diploma are least likely to be married with 33.3% of them unmarried at childbirth.
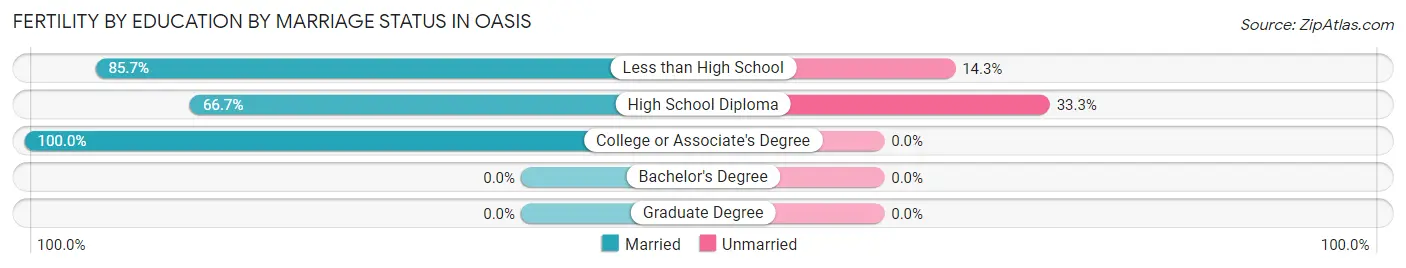
| Educational Attainment | Married | Unmarried |
| Less than High School | 42 (85.7%) | 7 (14.3%) |
| High School Diploma | 4 (66.7%) | 2 (33.3%) |
| College or Associate's Degree | 3 (100.0%) | 0 (0.0%) |
| Bachelor's Degree | 0 (0.0%) | 0 (0.0%) |
| Graduate Degree | 0 (0.0%) | 0 (0.0%) |
| Total | 49 (84.5%) | 9 (15.5%) |
Employment Characteristics in Oasis
Employment by Class of Employer in Oasis
Among the 1,771 employed individuals in Oasis, private company employees (1,574 | 88.9%), self-employed (not incorporated) (70 | 4.0%), and not-for-profit organizations (49 | 2.8%) make up the most common classes of employment.
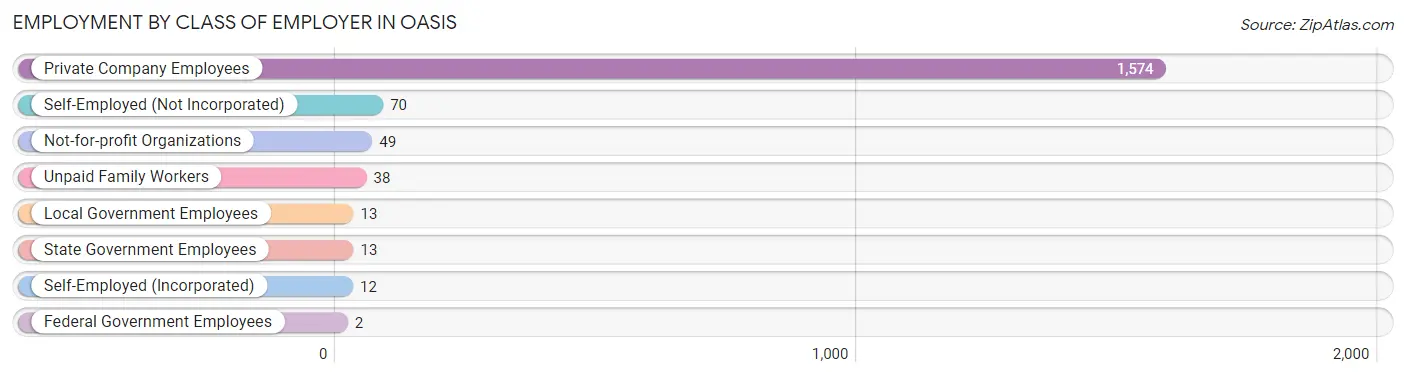
| Employer Class | # Employees | % Employees |
| Private Company Employees | 1,574 | 88.9% |
| Self-Employed (Incorporated) | 12 | 0.7% |
| Self-Employed (Not Incorporated) | 70 | 4.0% |
| Not-for-profit Organizations | 49 | 2.8% |
| Local Government Employees | 13 | 0.7% |
| State Government Employees | 13 | 0.7% |
| Federal Government Employees | 2 | 0.1% |
| Unpaid Family Workers | 38 | 2.1% |
| Total | 1,771 | 100.0% |
Employment Status by Age in Oasis
According to the labor force statistics for Oasis, out of the total population over 16 years of age (2,919), 75.0% or 2,189 individuals are in the labor force, with 19.0% or 416 of them unemployed. The age group with the highest labor force participation rate is 55 to 59 years, with 93.2% or 205 individuals in the labor force. Within the labor force, the 20 to 24 years age range has the highest percentage of unemployed individuals, with 48.4% or 185 of them being unemployed.
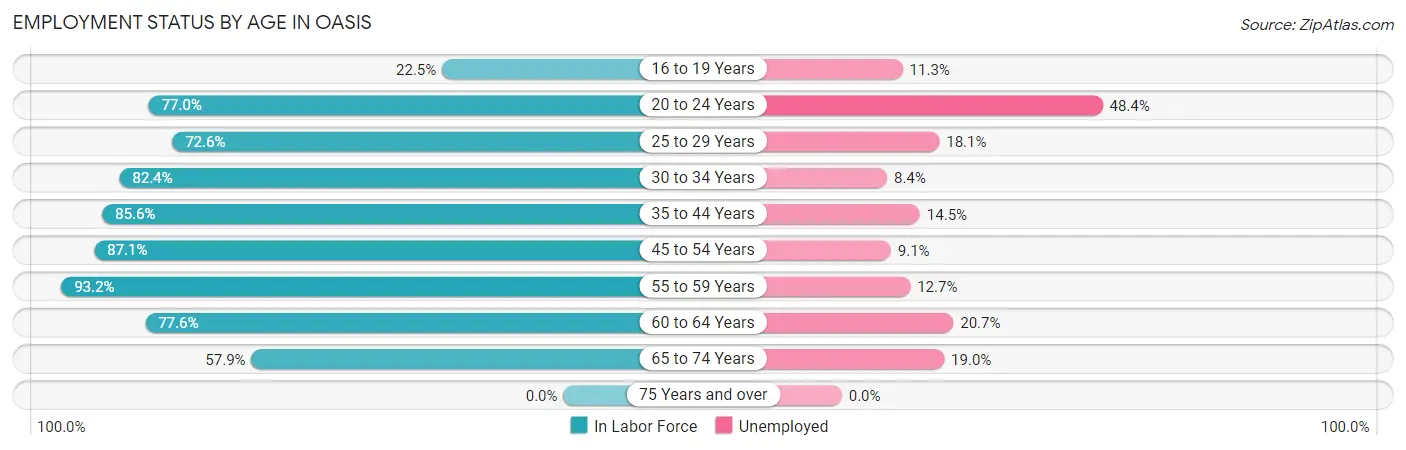
| Age Bracket | In Labor Force | Unemployed |
| 16 to 19 Years | 62 (22.5%) | 7 (11.3%) |
| 20 to 24 Years | 382 (77.0%) | 185 (48.4%) |
| 25 to 29 Years | 138 (72.6%) | 25 (18.1%) |
| 30 to 34 Years | 178 (82.4%) | 15 (8.4%) |
| 35 to 44 Years | 434 (85.6%) | 63 (14.5%) |
| 45 to 54 Years | 585 (87.1%) | 53 (9.1%) |
| 55 to 59 Years | 205 (93.2%) | 26 (12.7%) |
| 60 to 64 Years | 121 (77.6%) | 25 (20.7%) |
| 65 to 74 Years | 84 (57.9%) | 16 (19.0%) |
| 75 Years and over | 0 (0.0%) | 0 (0.0%) |
| Total | 2,189 (75.0%) | 416 (19.0%) |
Employment Status by Educational Attainment in Oasis
According to labor force statistics for Oasis, 84.7% of individuals (1,661) out of the total population between 25 and 64 years of age (1,961) are in the labor force, with 12.5% or 208 of them being unemployed. The group with the highest labor force participation rate are those with the educational attainment of college / associate degree, with 86.7% or 111 individuals in the labor force. Within the labor force, individuals with less than high school education have the highest percentage of unemployment, with 14.0% or 193 of them being unemployed.
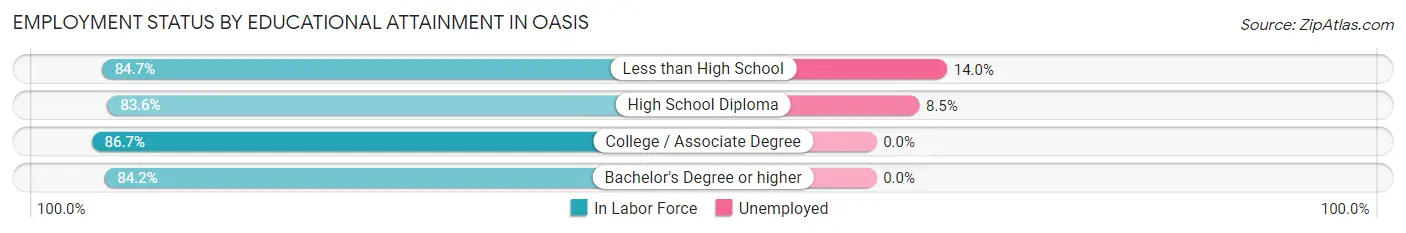
| Educational Attainment | In Labor Force | Unemployed |
| Less than High School | 1,381 (84.7%) | 228 (14.0%) |
| High School Diploma | 153 (83.6%) | 16 (8.5%) |
| College / Associate Degree | 111 (86.7%) | 0 (0.0%) |
| Bachelor's Degree or higher | 16 (84.2%) | 0 (0.0%) |
| Total | 1,661 (84.7%) | 245 (12.5%) |
Employment Occupations by Sex in Oasis
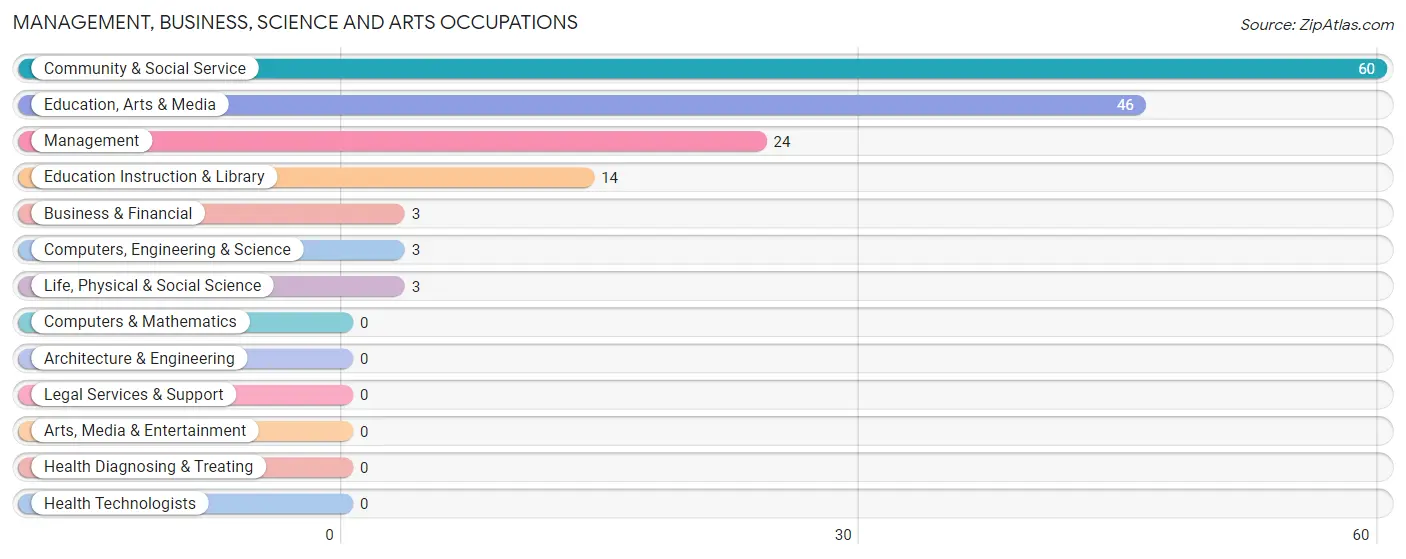
Management, Business, Science and Arts Occupations
The most common Management, Business, Science and Arts occupations in Oasis are Community & Social Service (60 | 3.4%), Education, Arts & Media (46 | 2.6%), Management (24 | 1.3%), Education Instruction & Library (14 | 0.8%), and Business & Financial (3 | 0.2%).
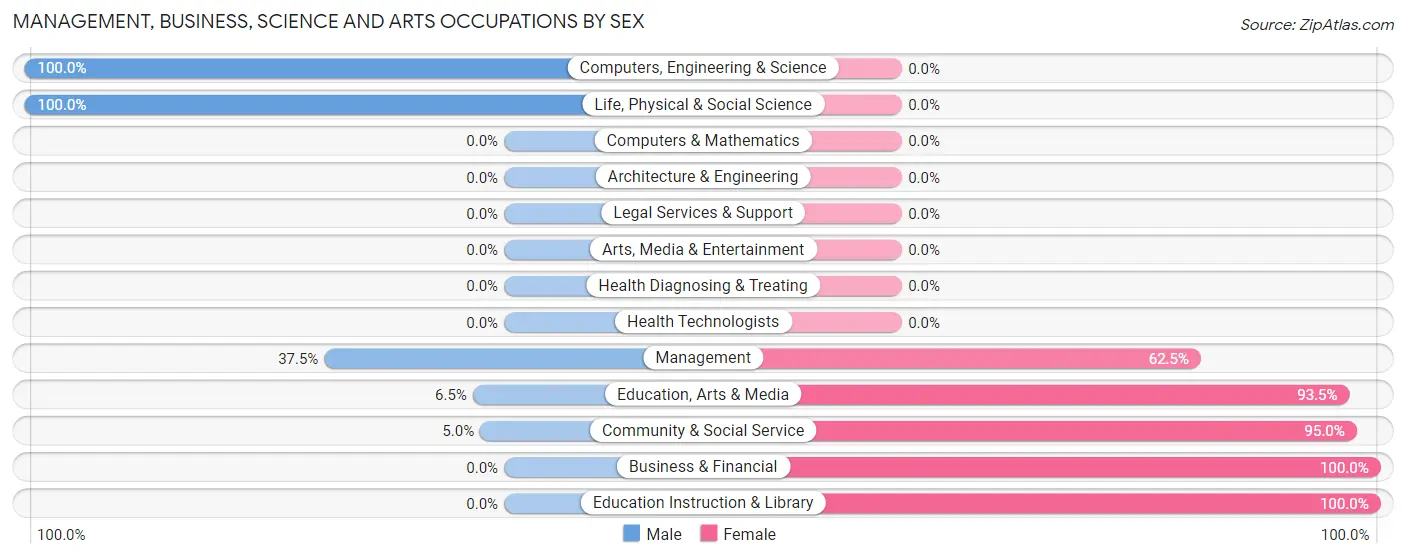
Management, Business, Science and Arts Occupations by Sex
Within the Management, Business, Science and Arts occupations in Oasis, the most male-oriented occupations are Computers, Engineering & Science (100.0%), Life, Physical & Social Science (100.0%), and Management (37.5%), while the most female-oriented occupations are Business & Financial (100.0%), Education Instruction & Library (100.0%), and Community & Social Service (95.0%).
| Occupation | Male | Female |
| Management | 9 (37.5%) | 15 (62.5%) |
| Business & Financial | 0 (0.0%) | 3 (100.0%) |
| Computers, Engineering & Science | 3 (100.0%) | 0 (0.0%) |
| Computers & Mathematics | 0 (0.0%) | 0 (0.0%) |
| Architecture & Engineering | 0 (0.0%) | 0 (0.0%) |
| Life, Physical & Social Science | 3 (100.0%) | 0 (0.0%) |
| Community & Social Service | 3 (5.0%) | 57 (95.0%) |
| Education, Arts & Media | 3 (6.5%) | 43 (93.5%) |
| Legal Services & Support | 0 (0.0%) | 0 (0.0%) |
| Education Instruction & Library | 0 (0.0%) | 14 (100.0%) |
| Arts, Media & Entertainment | 0 (0.0%) | 0 (0.0%) |
| Health Diagnosing & Treating | 0 (0.0%) | 0 (0.0%) |
| Health Technologists | 0 (0.0%) | 0 (0.0%) |
| Total (Category) | 15 (16.7%) | 75 (83.3%) |
| Total (Overall) | 1,228 (69.2%) | 546 (30.8%) |
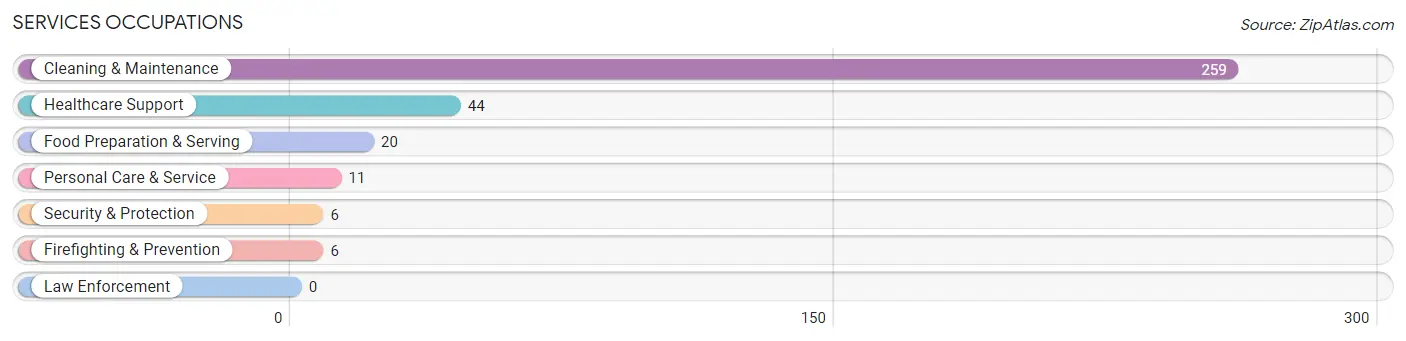
Services Occupations
The most common Services occupations in Oasis are Cleaning & Maintenance (259 | 14.6%), Healthcare Support (44 | 2.5%), Food Preparation & Serving (20 | 1.1%), Personal Care & Service (11 | 0.6%), and Security & Protection (6 | 0.3%).
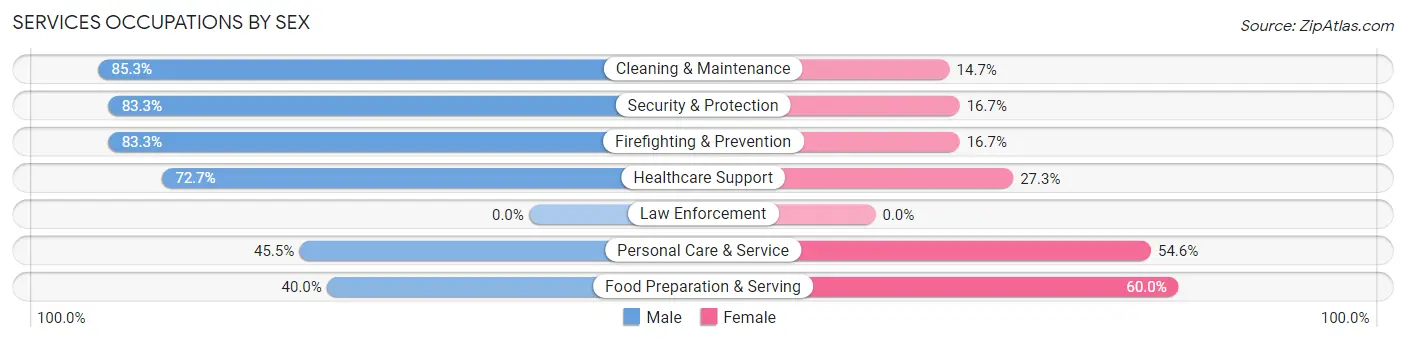
Services Occupations by Sex
Within the Services occupations in Oasis, the most male-oriented occupations are Cleaning & Maintenance (85.3%), Security & Protection (83.3%), and Firefighting & Prevention (83.3%), while the most female-oriented occupations are Food Preparation & Serving (60.0%), Personal Care & Service (54.5%), and Healthcare Support (27.3%).
| Occupation | Male | Female |
| Healthcare Support | 32 (72.7%) | 12 (27.3%) |
| Security & Protection | 5 (83.3%) | 1 (16.7%) |
| Firefighting & Prevention | 5 (83.3%) | 1 (16.7%) |
| Law Enforcement | 0 (0.0%) | 0 (0.0%) |
| Food Preparation & Serving | 8 (40.0%) | 12 (60.0%) |
| Cleaning & Maintenance | 221 (85.3%) | 38 (14.7%) |
| Personal Care & Service | 5 (45.5%) | 6 (54.5%) |
| Total (Category) | 271 (79.7%) | 69 (20.3%) |
| Total (Overall) | 1,228 (69.2%) | 546 (30.8%) |
Sales and Office Occupations
The most common Sales and Office occupations in Oasis are Sales & Related (80 | 4.5%), and Office & Administration (48 | 2.7%).
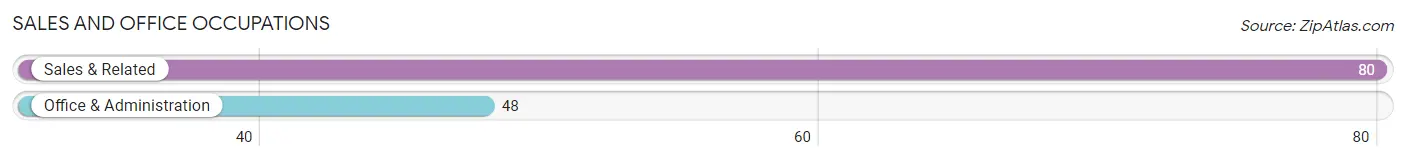
Sales and Office Occupations by Sex
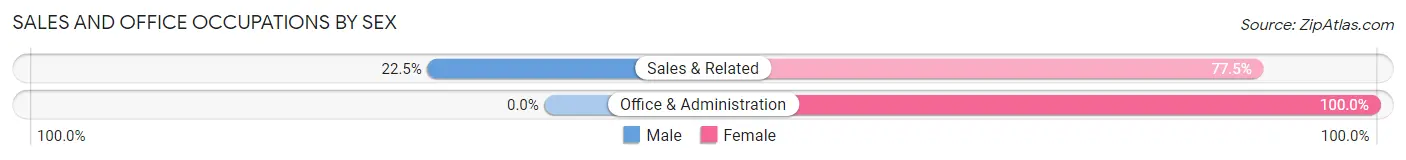
| Occupation | Male | Female |
| Sales & Related | 18 (22.5%) | 62 (77.5%) |
| Office & Administration | 0 (0.0%) | 48 (100.0%) |
| Total (Category) | 18 (14.1%) | 110 (85.9%) |
| Total (Overall) | 1,228 (69.2%) | 546 (30.8%) |
Natural Resources, Construction and Maintenance Occupations
The most common Natural Resources, Construction and Maintenance occupations in Oasis are Farming, Fishing & Forestry (887 | 50.0%), Construction & Extraction (123 | 6.9%), and Installation, Maintenance & Repair (49 | 2.8%).
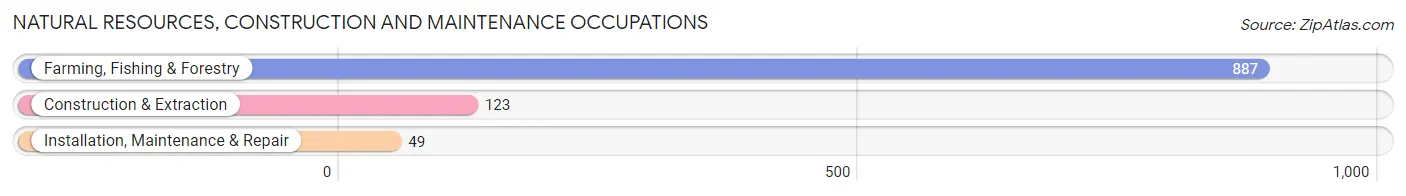
Natural Resources, Construction and Maintenance Occupations by Sex
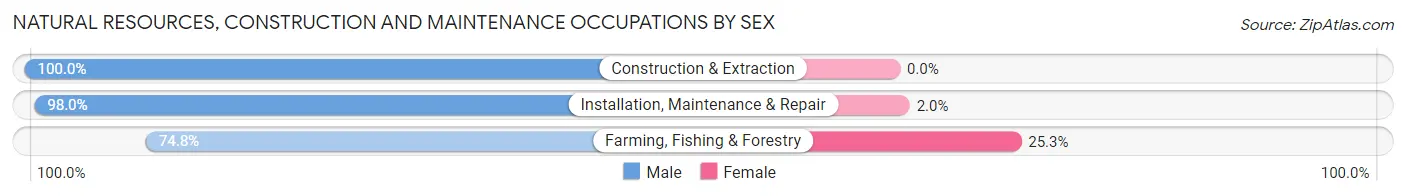
| Occupation | Male | Female |
| Farming, Fishing & Forestry | 663 (74.8%) | 224 (25.3%) |
| Construction & Extraction | 123 (100.0%) | 0 (0.0%) |
| Installation, Maintenance & Repair | 48 (98.0%) | 1 (2.0%) |
| Total (Category) | 834 (78.7%) | 225 (21.2%) |
| Total (Overall) | 1,228 (69.2%) | 546 (30.8%) |
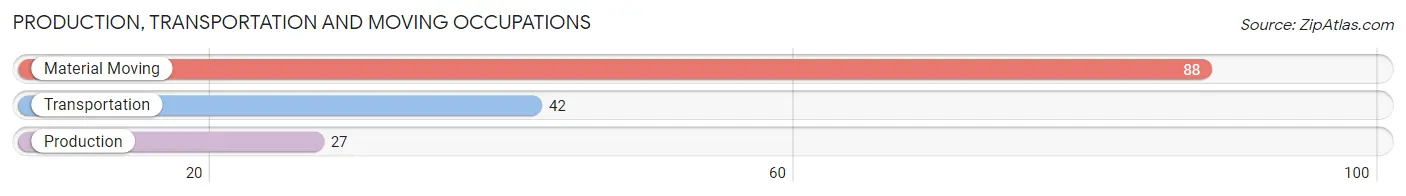
Production, Transportation and Moving Occupations
The most common Production, Transportation and Moving occupations in Oasis are Material Moving (88 | 5.0%), Transportation (42 | 2.4%), and Production (27 | 1.5%).
Production, Transportation and Moving Occupations by Sex
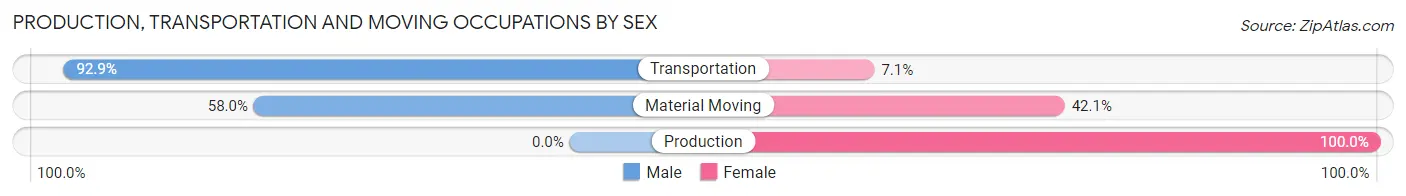
| Occupation | Male | Female |
| Production | 0 (0.0%) | 27 (100.0%) |
| Transportation | 39 (92.9%) | 3 (7.1%) |
| Material Moving | 51 (58.0%) | 37 (42.0%) |
| Total (Category) | 90 (57.3%) | 67 (42.7%) |
| Total (Overall) | 1,228 (69.2%) | 546 (30.8%) |
Employment Industries by Sex in Oasis
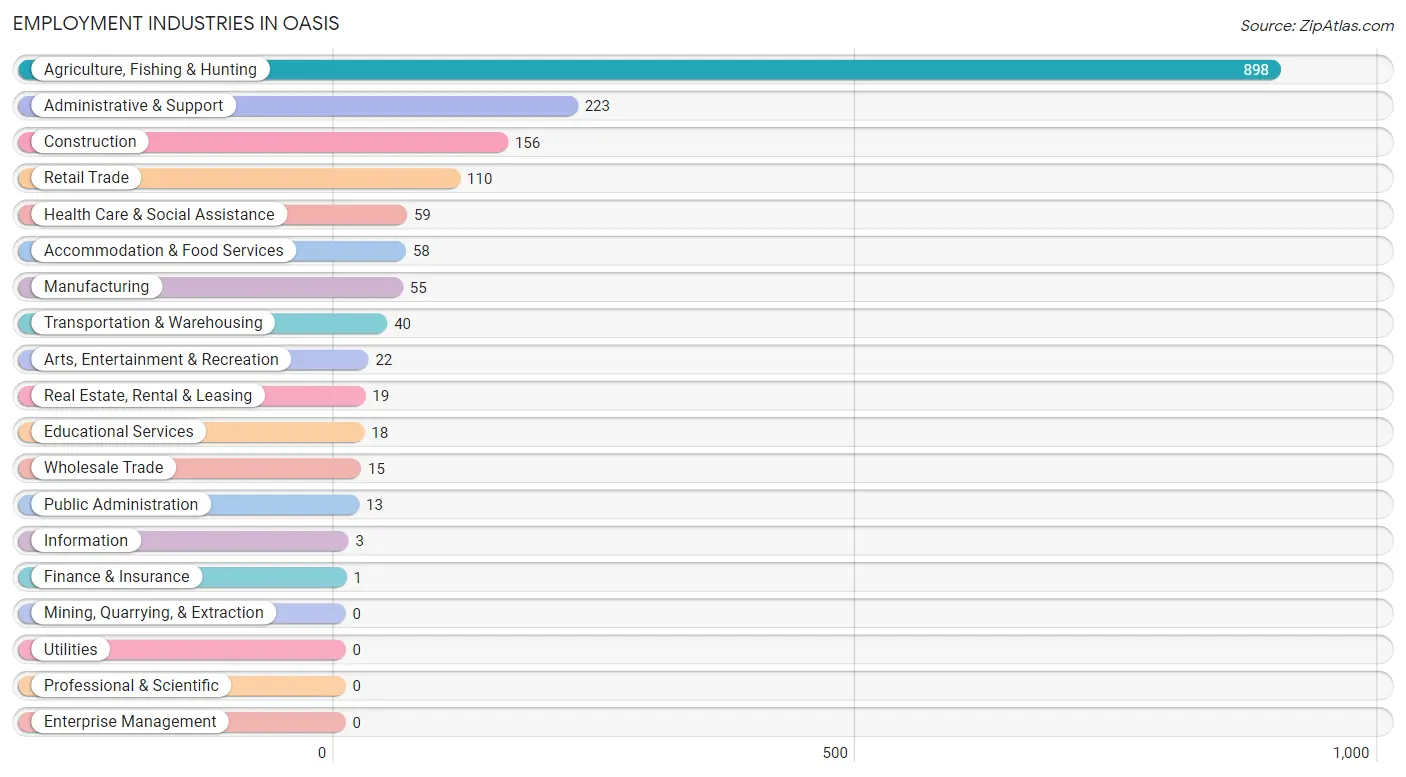
Employment Industries in Oasis
The major employment industries in Oasis include Agriculture, Fishing & Hunting (898 | 50.6%), Administrative & Support (223 | 12.6%), Construction (156 | 8.8%), Retail Trade (110 | 6.2%), and Health Care & Social Assistance (59 | 3.3%).
Employment Industries by Sex in Oasis
The Oasis industries that see more men than women are Construction (100.0%), Information (100.0%), and Administrative & Support (96.9%), whereas the industries that tend to have a higher number of women are Finance & Insurance (100.0%), Educational Services (100.0%), and Retail Trade (90.9%).
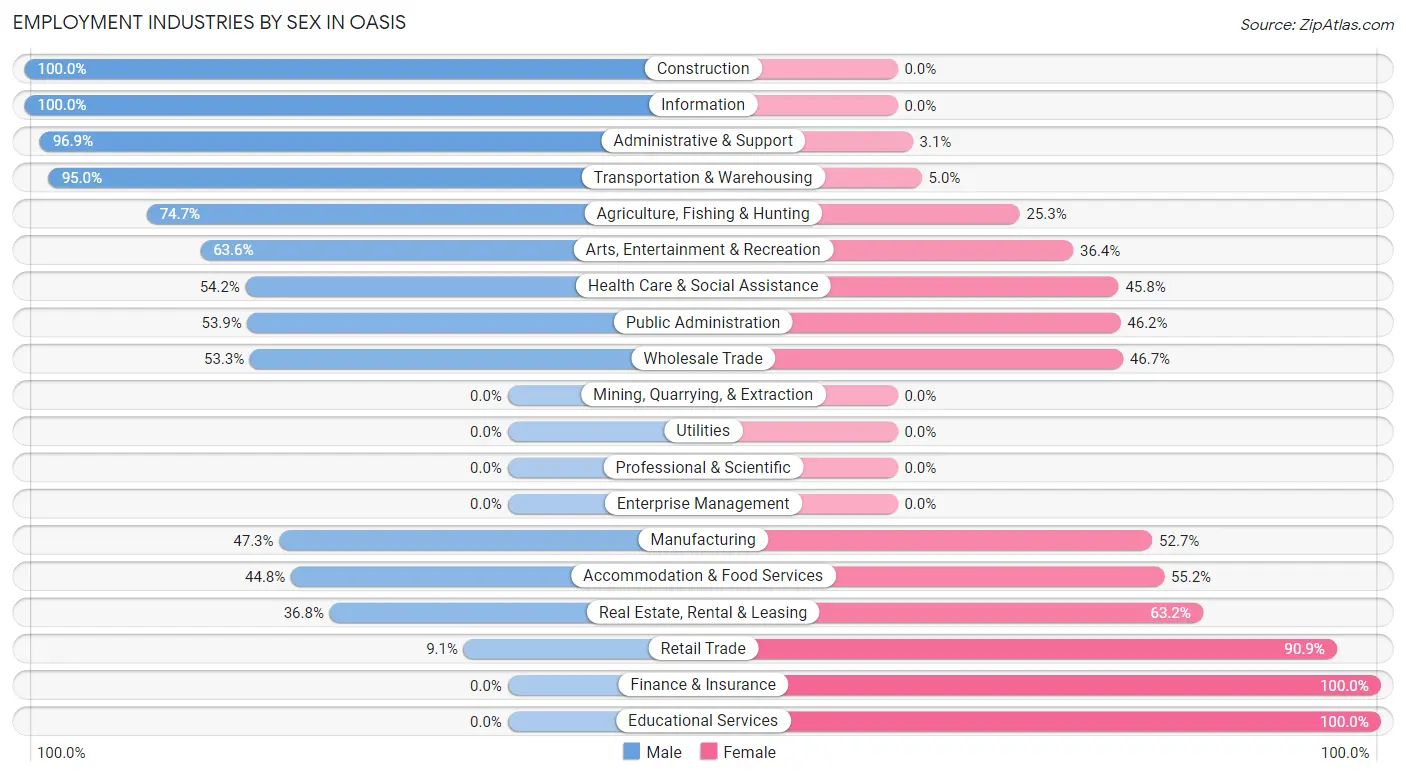
| Industry | Male | Female |
| Agriculture, Fishing & Hunting | 671 (74.7%) | 227 (25.3%) |
| Mining, Quarrying, & Extraction | 0 (0.0%) | 0 (0.0%) |
| Construction | 156 (100.0%) | 0 (0.0%) |
| Manufacturing | 26 (47.3%) | 29 (52.7%) |
| Wholesale Trade | 8 (53.3%) | 7 (46.7%) |
| Retail Trade | 10 (9.1%) | 100 (90.9%) |
| Transportation & Warehousing | 38 (95.0%) | 2 (5.0%) |
| Utilities | 0 (0.0%) | 0 (0.0%) |
| Information | 3 (100.0%) | 0 (0.0%) |
| Finance & Insurance | 0 (0.0%) | 1 (100.0%) |
| Real Estate, Rental & Leasing | 7 (36.8%) | 12 (63.2%) |
| Professional & Scientific | 0 (0.0%) | 0 (0.0%) |
| Enterprise Management | 0 (0.0%) | 0 (0.0%) |
| Administrative & Support | 216 (96.9%) | 7 (3.1%) |
| Educational Services | 0 (0.0%) | 18 (100.0%) |
| Health Care & Social Assistance | 32 (54.2%) | 27 (45.8%) |
| Arts, Entertainment & Recreation | 14 (63.6%) | 8 (36.4%) |
| Accommodation & Food Services | 26 (44.8%) | 32 (55.2%) |
| Public Administration | 7 (53.8%) | 6 (46.2%) |
| Total | 1,228 (69.2%) | 546 (30.8%) |
Education in Oasis
School Enrollment in Oasis
The most common levels of schooling among the 1,045 students in Oasis are high school (274 | 26.2%), college / undergraduate (273 | 26.1%), and elementary school (269 | 25.7%).
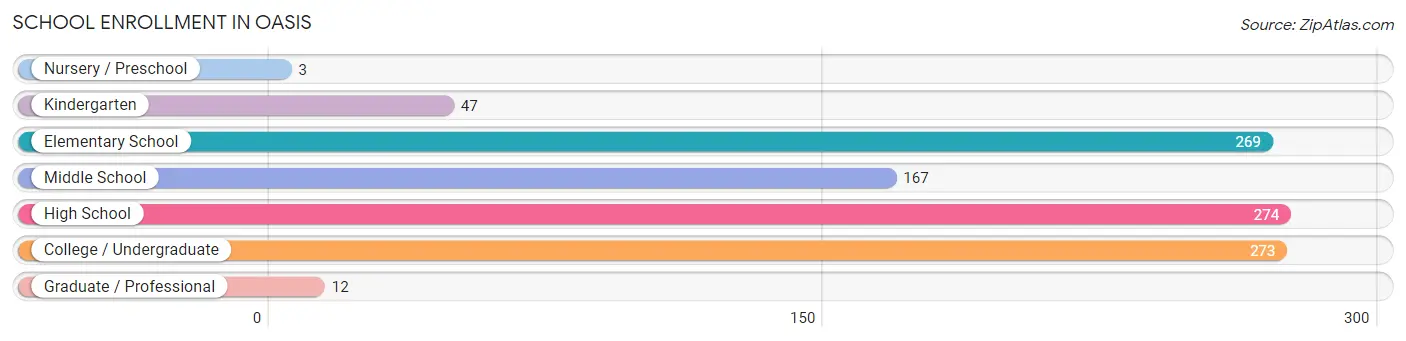
| School Level | # Students | % Students |
| Nursery / Preschool | 3 | 0.3% |
| Kindergarten | 47 | 4.5% |
| Elementary School | 269 | 25.7% |
| Middle School | 167 | 16.0% |
| High School | 274 | 26.2% |
| College / Undergraduate | 273 | 26.1% |
| Graduate / Professional | 12 | 1.1% |
| Total | 1,045 | 100.0% |
School Enrollment by Age by Funding Source in Oasis
Out of a total of 1,045 students who are enrolled in schools in Oasis, 17 (1.6%) attend a private institution, while the remaining 1,028 (98.4%) are enrolled in public schools. The age group of 25 to 34 year olds has the highest likelihood of being enrolled in private schools, with 4 (57.1% in the age bracket) enrolled. Conversely, the age group of 3 to 4 year olds has the lowest likelihood of being enrolled in a private school, with 3 (100.0% in the age bracket) attending a public institution.
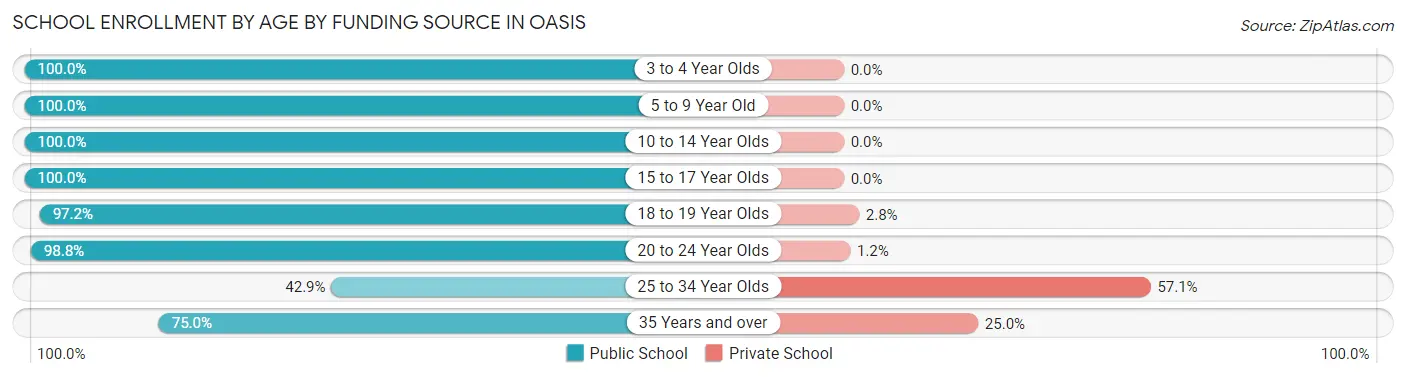
| Age Bracket | Public School | Private School |
| 3 to 4 Year Olds | 3 (100.0%) | 0 (0.0%) |
| 5 to 9 Year Old | 242 (100.0%) | 0 (0.0%) |
| 10 to 14 Year Olds | 272 (100.0%) | 0 (0.0%) |
| 15 to 17 Year Olds | 151 (100.0%) | 0 (0.0%) |
| 18 to 19 Year Olds | 172 (97.2%) | 5 (2.8%) |
| 20 to 24 Year Olds | 167 (98.8%) | 2 (1.2%) |
| 25 to 34 Year Olds | 3 (42.9%) | 4 (57.1%) |
| 35 Years and over | 18 (75.0%) | 6 (25.0%) |
| Total | 1,028 (98.4%) | 17 (1.6%) |
Educational Attainment by Field of Study in Oasis
Education (10 | 35.7%), bio, nature & agricultural (6 | 21.4%), literature & languages (4 | 14.3%), psychology (3 | 10.7%), and liberal arts & history (3 | 10.7%) are the most common fields of study among 28 individuals in Oasis who have obtained a bachelor's degree or higher.
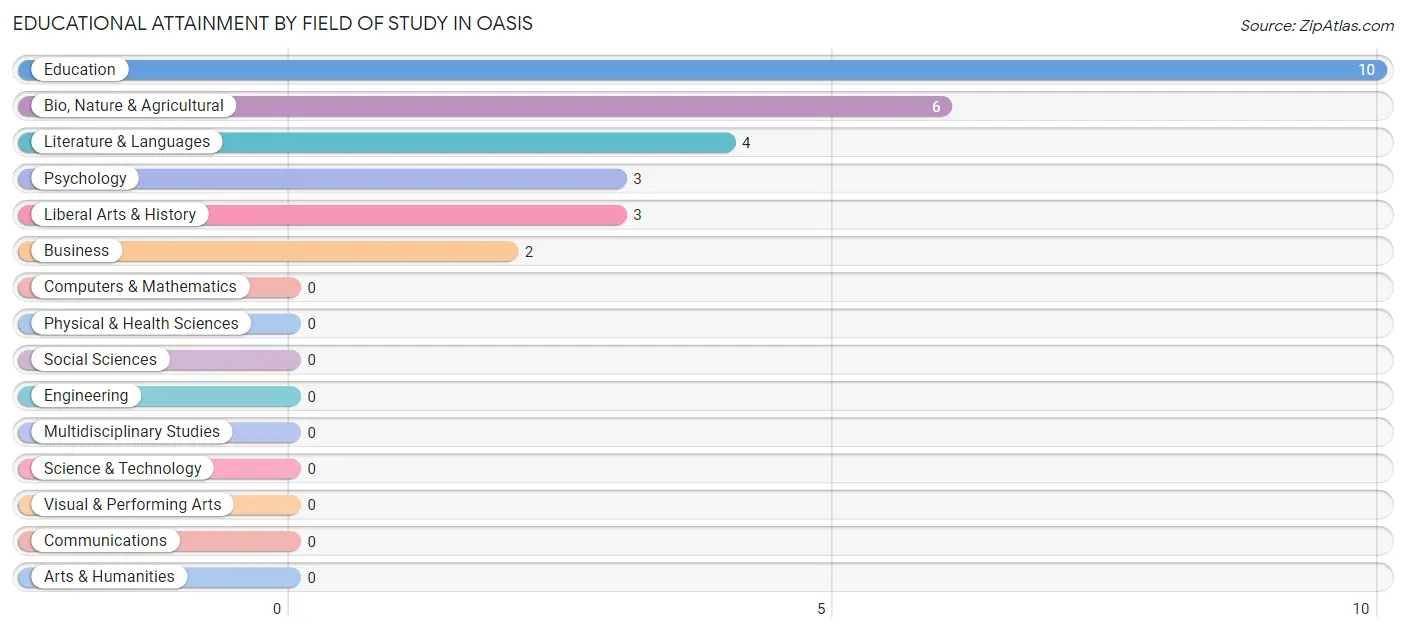
| Field of Study | # Graduates | % Graduates |
| Computers & Mathematics | 0 | 0.0% |
| Bio, Nature & Agricultural | 6 | 21.4% |
| Physical & Health Sciences | 0 | 0.0% |
| Psychology | 3 | 10.7% |
| Social Sciences | 0 | 0.0% |
| Engineering | 0 | 0.0% |
| Multidisciplinary Studies | 0 | 0.0% |
| Science & Technology | 0 | 0.0% |
| Business | 2 | 7.1% |
| Education | 10 | 35.7% |
| Literature & Languages | 4 | 14.3% |
| Liberal Arts & History | 3 | 10.7% |
| Visual & Performing Arts | 0 | 0.0% |
| Communications | 0 | 0.0% |
| Arts & Humanities | 0 | 0.0% |
| Total | 28 | 100.0% |
Transportation & Commute in Oasis
Vehicle Availability by Sex in Oasis
The most prevalent vehicle ownership categories in Oasis are males with 2 vehicles (504, accounting for 41.3%) and females with 2 vehicles (208, making up 92.8%).
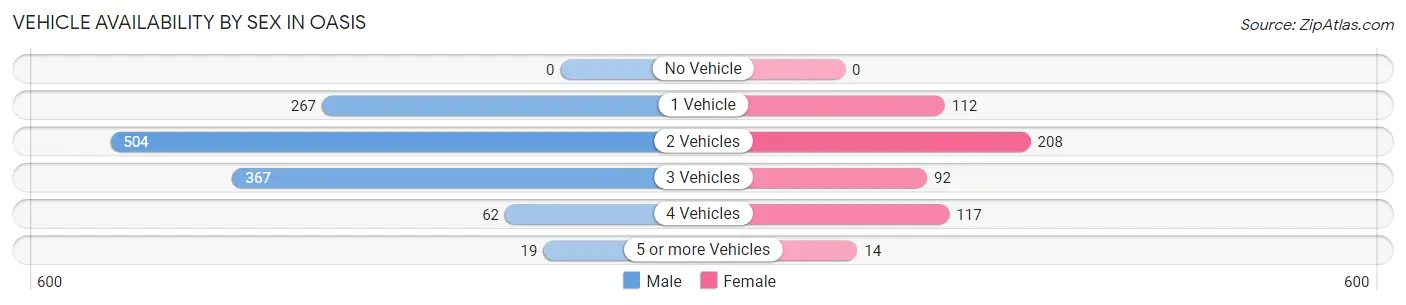
| Vehicles Available | Male | Female |
| No Vehicle | 0 (0.0%) | 0 (0.0%) |
| 1 Vehicle | 267 (21.9%) | 112 (20.6%) |
| 2 Vehicles | 504 (41.3%) | 208 (38.3%) |
| 3 Vehicles | 367 (30.1%) | 92 (16.9%) |
| 4 Vehicles | 62 (5.1%) | 117 (21.5%) |
| 5 or more Vehicles | 19 (1.6%) | 14 (2.6%) |
| Total | 1,219 (100.0%) | 543 (100.0%) |
Commute Time in Oasis
The most frequently occuring commute durations in Oasis are 10 to 14 minutes (372 commuters, 21.9%), 30 to 34 minutes (372 commuters, 21.9%), and 20 to 24 minutes (273 commuters, 16.0%).
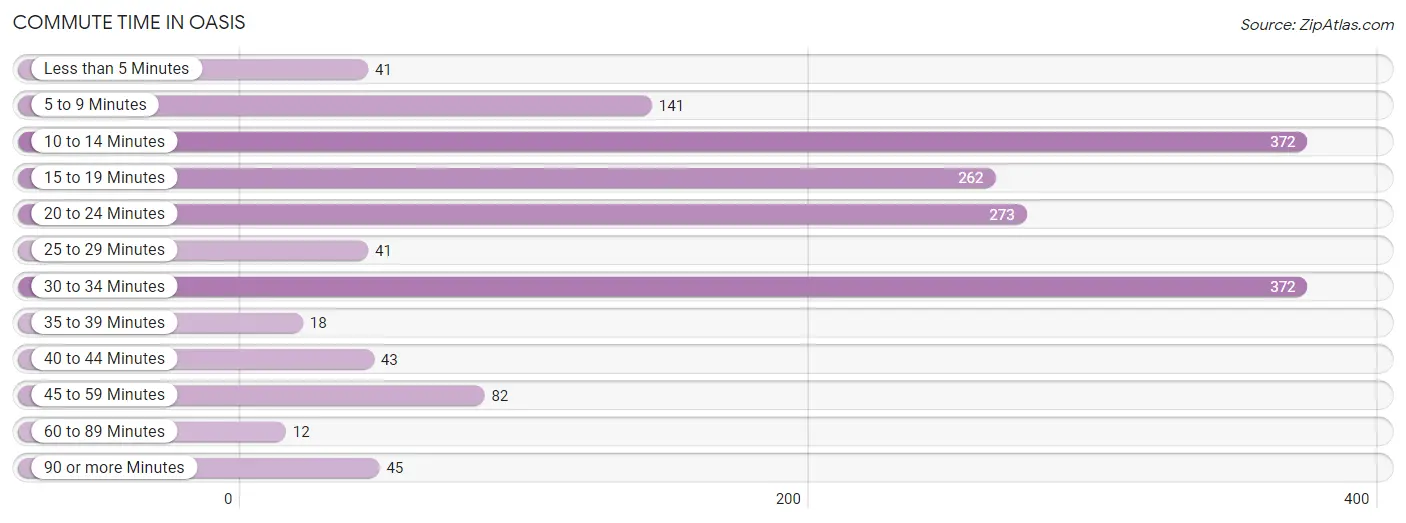
| Commute Time | # Commuters | % Commuters |
| Less than 5 Minutes | 41 | 2.4% |
| 5 to 9 Minutes | 141 | 8.3% |
| 10 to 14 Minutes | 372 | 21.9% |
| 15 to 19 Minutes | 262 | 15.4% |
| 20 to 24 Minutes | 273 | 16.0% |
| 25 to 29 Minutes | 41 | 2.4% |
| 30 to 34 Minutes | 372 | 21.9% |
| 35 to 39 Minutes | 18 | 1.1% |
| 40 to 44 Minutes | 43 | 2.5% |
| 45 to 59 Minutes | 82 | 4.8% |
| 60 to 89 Minutes | 12 | 0.7% |
| 90 or more Minutes | 45 | 2.6% |
Commute Time by Sex in Oasis
The most common commute times in Oasis are 30 to 34 minutes (296 commuters, 24.7%) for males and 20 to 24 minutes (138 commuters, 27.3%) for females.
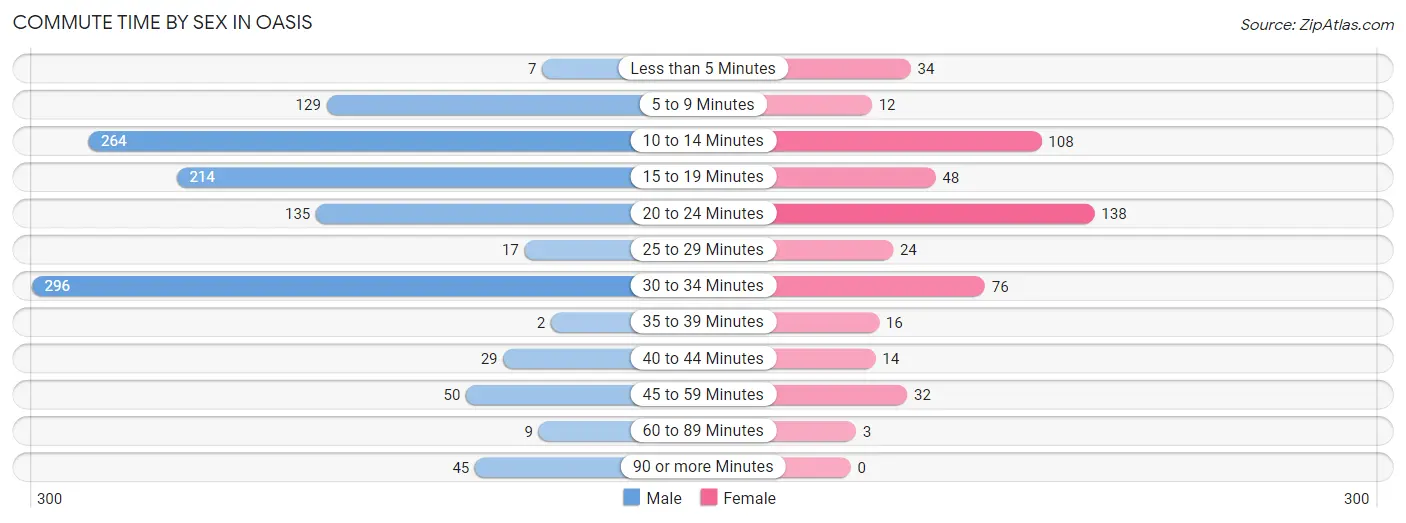
| Commute Time | Male | Female |
| Less than 5 Minutes | 7 (0.6%) | 34 (6.7%) |
| 5 to 9 Minutes | 129 (10.8%) | 12 (2.4%) |
| 10 to 14 Minutes | 264 (22.1%) | 108 (21.4%) |
| 15 to 19 Minutes | 214 (17.9%) | 48 (9.5%) |
| 20 to 24 Minutes | 135 (11.3%) | 138 (27.3%) |
| 25 to 29 Minutes | 17 (1.4%) | 24 (4.8%) |
| 30 to 34 Minutes | 296 (24.7%) | 76 (15.0%) |
| 35 to 39 Minutes | 2 (0.2%) | 16 (3.2%) |
| 40 to 44 Minutes | 29 (2.4%) | 14 (2.8%) |
| 45 to 59 Minutes | 50 (4.2%) | 32 (6.3%) |
| 60 to 89 Minutes | 9 (0.7%) | 3 (0.6%) |
| 90 or more Minutes | 45 (3.8%) | 0 (0.0%) |
Time of Departure to Work by Sex in Oasis
The most frequent times of departure to work in Oasis are 5:00 AM to 5:29 AM (298, 24.9%) for males and 5:30 AM to 5:59 AM (106, 21.0%) for females.
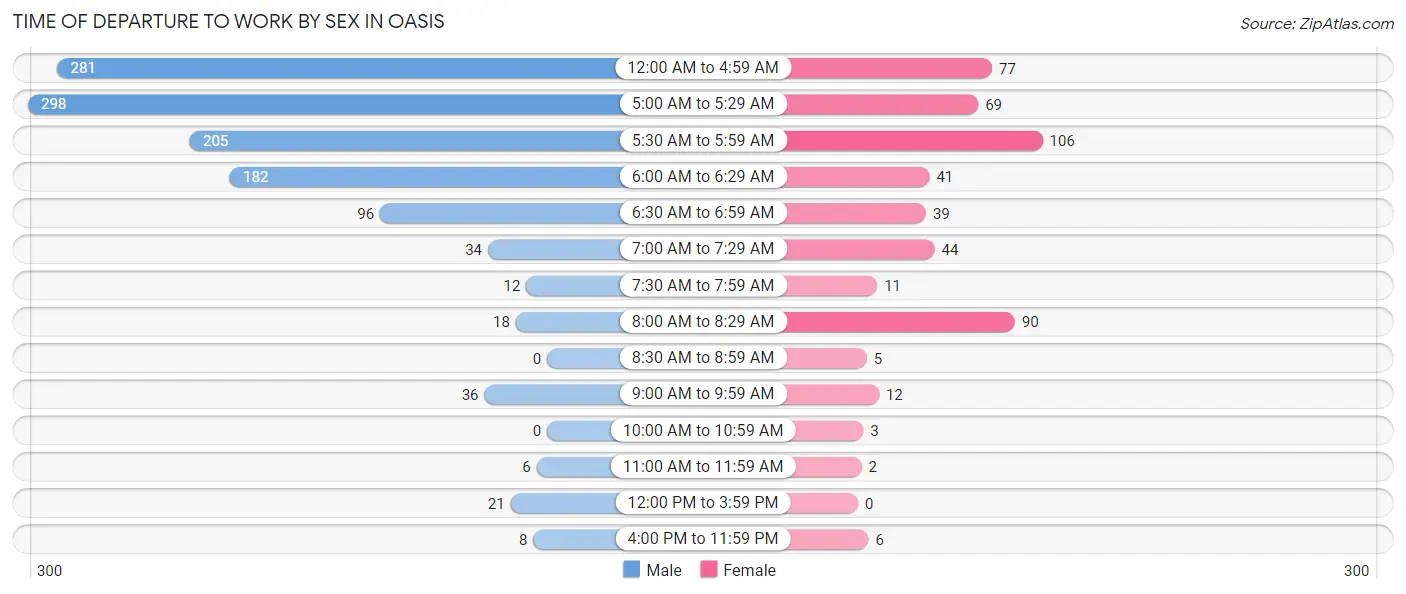
| Time of Departure | Male | Female |
| 12:00 AM to 4:59 AM | 281 (23.5%) | 77 (15.2%) |
| 5:00 AM to 5:29 AM | 298 (24.9%) | 69 (13.7%) |
| 5:30 AM to 5:59 AM | 205 (17.1%) | 106 (21.0%) |
| 6:00 AM to 6:29 AM | 182 (15.2%) | 41 (8.1%) |
| 6:30 AM to 6:59 AM | 96 (8.0%) | 39 (7.7%) |
| 7:00 AM to 7:29 AM | 34 (2.8%) | 44 (8.7%) |
| 7:30 AM to 7:59 AM | 12 (1.0%) | 11 (2.2%) |
| 8:00 AM to 8:29 AM | 18 (1.5%) | 90 (17.8%) |
| 8:30 AM to 8:59 AM | 0 (0.0%) | 5 (1.0%) |
| 9:00 AM to 9:59 AM | 36 (3.0%) | 12 (2.4%) |
| 10:00 AM to 10:59 AM | 0 (0.0%) | 3 (0.6%) |
| 11:00 AM to 11:59 AM | 6 (0.5%) | 2 (0.4%) |
| 12:00 PM to 3:59 PM | 21 (1.8%) | 0 (0.0%) |
| 4:00 PM to 11:59 PM | 8 (0.7%) | 6 (1.2%) |
| Total | 1,197 (100.0%) | 505 (100.0%) |
Housing Occupancy in Oasis
Occupancy by Ownership in Oasis
Of the total 1,215 dwellings in Oasis, owner-occupied units account for 1,027 (84.5%), while renter-occupied units make up 188 (15.5%).
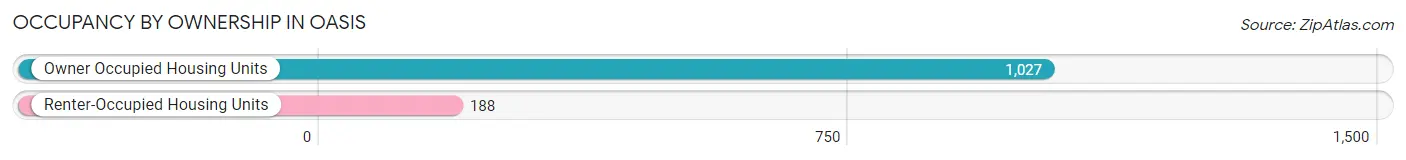
| Occupancy | # Housing Units | % Housing Units |
| Owner Occupied Housing Units | 1,027 | 84.5% |
| Renter-Occupied Housing Units | 188 | 15.5% |
| Total Occupied Housing Units | 1,215 | 100.0% |
Occupancy by Household Size in Oasis
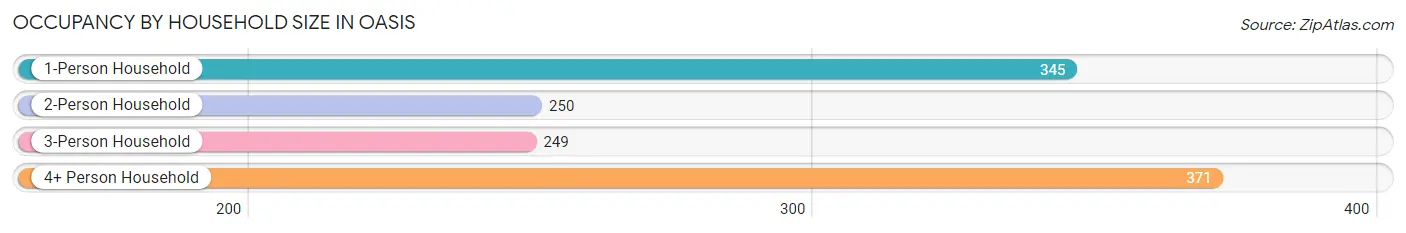
| Household Size | # Housing Units | % Housing Units |
| 1-Person Household | 345 | 28.4% |
| 2-Person Household | 250 | 20.6% |
| 3-Person Household | 249 | 20.5% |
| 4+ Person Household | 371 | 30.5% |
| Total Housing Units | 1,215 | 100.0% |
Occupancy by Ownership by Household Size in Oasis
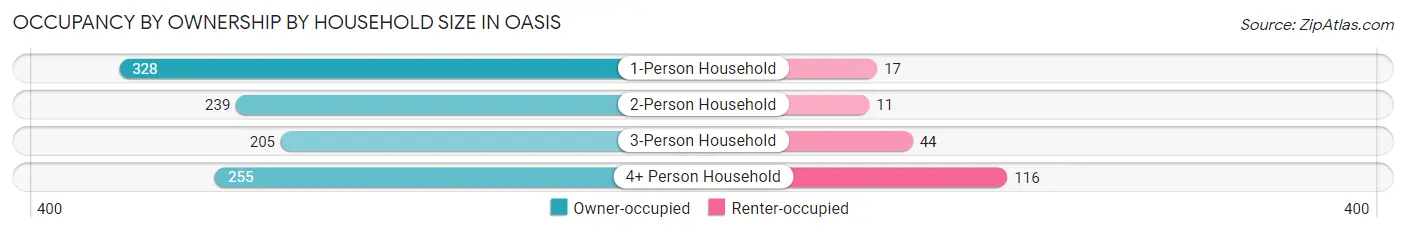
| Household Size | Owner-occupied | Renter-occupied |
| 1-Person Household | 328 (95.1%) | 17 (4.9%) |
| 2-Person Household | 239 (95.6%) | 11 (4.4%) |
| 3-Person Household | 205 (82.3%) | 44 (17.7%) |
| 4+ Person Household | 255 (68.7%) | 116 (31.3%) |
| Total Housing Units | 1,027 (84.5%) | 188 (15.5%) |
Occupancy by Educational Attainment in Oasis
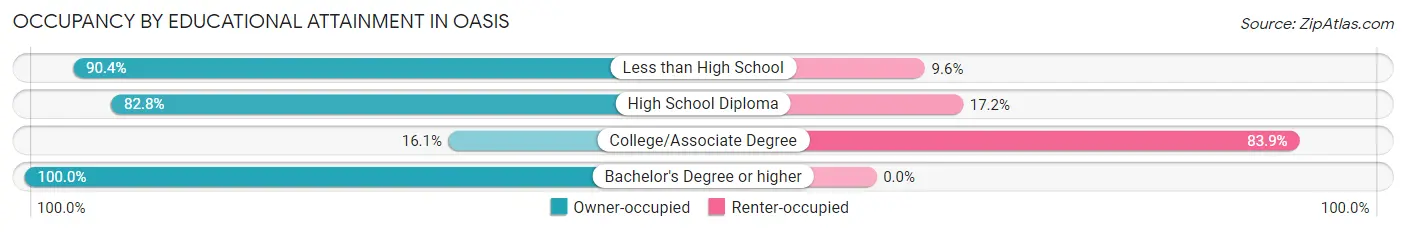
| Household Size | Owner-occupied | Renter-occupied |
| Less than High School | 922 (90.4%) | 98 (9.6%) |
| High School Diploma | 82 (82.8%) | 17 (17.2%) |
| College/Associate Degree | 14 (16.1%) | 73 (83.9%) |
| Bachelor's Degree or higher | 9 (100.0%) | 0 (0.0%) |
Occupancy by Age of Householder in Oasis
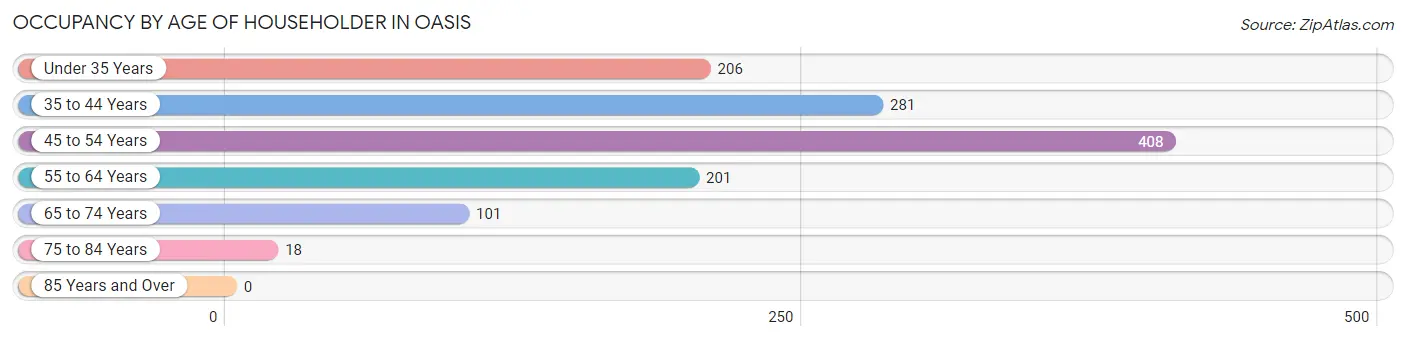
| Age Bracket | # Households | % Households |
| Under 35 Years | 206 | 17.0% |
| 35 to 44 Years | 281 | 23.1% |
| 45 to 54 Years | 408 | 33.6% |
| 55 to 64 Years | 201 | 16.5% |
| 65 to 74 Years | 101 | 8.3% |
| 75 to 84 Years | 18 | 1.5% |
| 85 Years and Over | 0 | 0.0% |
| Total | 1,215 | 100.0% |
Housing Finances in Oasis
Median Income by Occupancy in Oasis
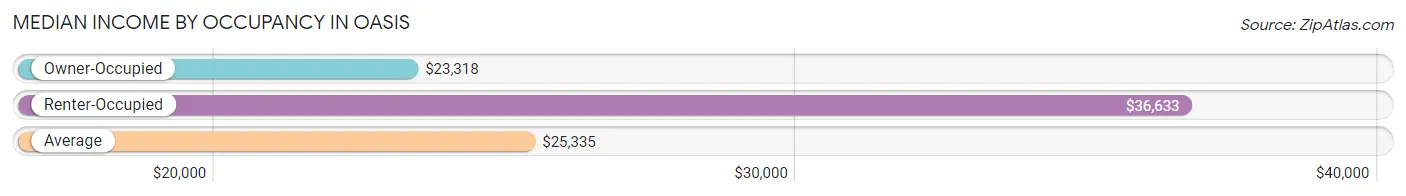
| Occupancy Type | # Households | Median Income |
| Owner-Occupied | 1,027 (84.5%) | $23,318 |
| Renter-Occupied | 188 (15.5%) | $36,633 |
| Average | 1,215 (100.0%) | $25,335 |
Occupancy by Householder Income Bracket in Oasis
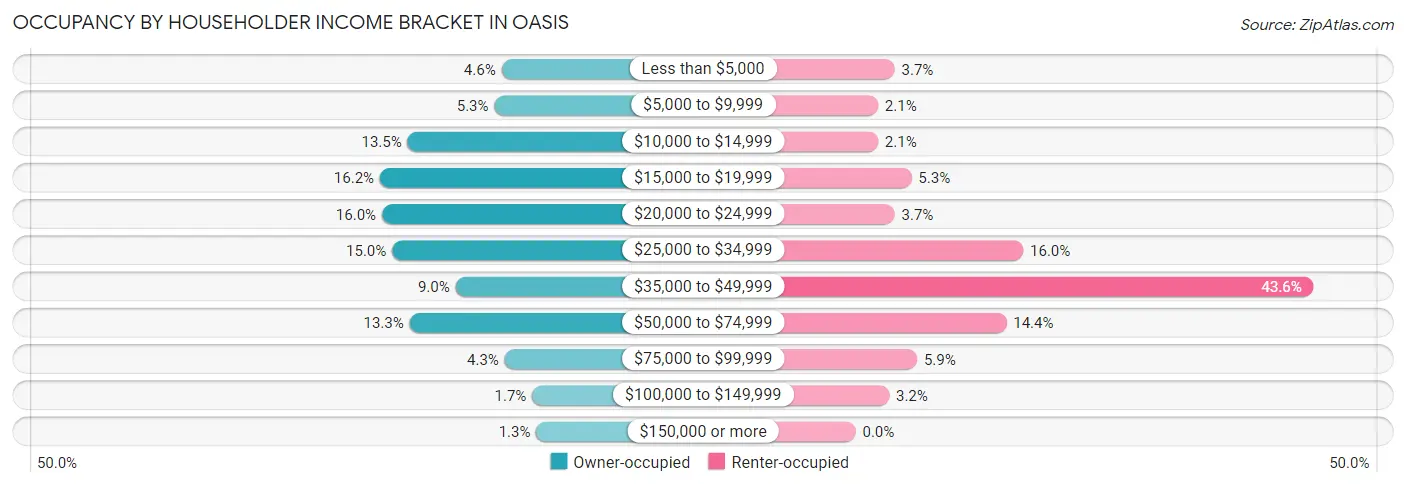
| Income Bracket | Owner-occupied | Renter-occupied |
| Less than $5,000 | 47 (4.6%) | 7 (3.7%) |
| $5,000 to $9,999 | 54 (5.3%) | 4 (2.1%) |
| $10,000 to $14,999 | 139 (13.5%) | 4 (2.1%) |
| $15,000 to $19,999 | 166 (16.2%) | 10 (5.3%) |
| $20,000 to $24,999 | 164 (16.0%) | 7 (3.7%) |
| $25,000 to $34,999 | 154 (15.0%) | 30 (16.0%) |
| $35,000 to $49,999 | 92 (9.0%) | 82 (43.6%) |
| $50,000 to $74,999 | 137 (13.3%) | 27 (14.4%) |
| $75,000 to $99,999 | 44 (4.3%) | 11 (5.9%) |
| $100,000 to $149,999 | 17 (1.7%) | 6 (3.2%) |
| $150,000 or more | 13 (1.3%) | 0 (0.0%) |
| Total | 1,027 (100.0%) | 188 (100.0%) |
Monthly Housing Cost Tiers in Oasis
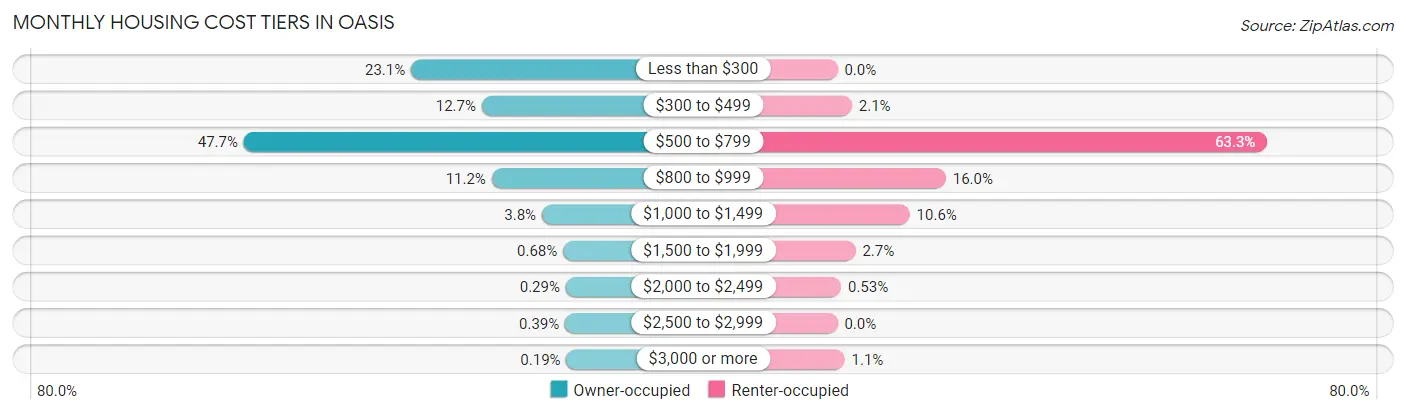
| Monthly Cost | Owner-occupied | Renter-occupied |
| Less than $300 | 237 (23.1%) | 0 (0.0%) |
| $300 to $499 | 130 (12.7%) | 4 (2.1%) |
| $500 to $799 | 490 (47.7%) | 119 (63.3%) |
| $800 to $999 | 115 (11.2%) | 30 (16.0%) |
| $1,000 to $1,499 | 39 (3.8%) | 20 (10.6%) |
| $1,500 to $1,999 | 7 (0.7%) | 5 (2.7%) |
| $2,000 to $2,499 | 3 (0.3%) | 1 (0.5%) |
| $2,500 to $2,999 | 4 (0.4%) | 0 (0.0%) |
| $3,000 or more | 2 (0.2%) | 2 (1.1%) |
| Total | 1,027 (100.0%) | 188 (100.0%) |
Physical Housing Characteristics in Oasis
Housing Structures in Oasis
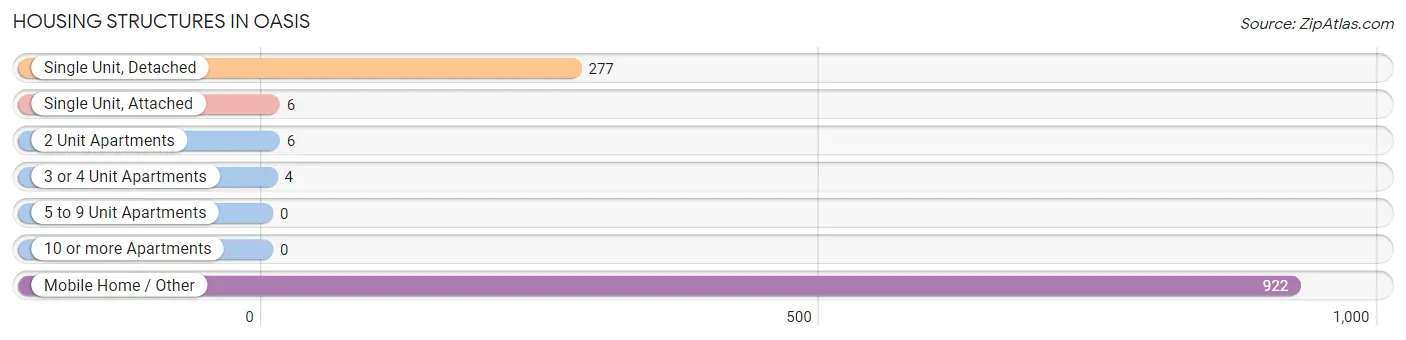
| Structure Type | # Housing Units | % Housing Units |
| Single Unit, Detached | 277 | 22.8% |
| Single Unit, Attached | 6 | 0.5% |
| 2 Unit Apartments | 6 | 0.5% |
| 3 or 4 Unit Apartments | 4 | 0.3% |
| 5 to 9 Unit Apartments | 0 | 0.0% |
| 10 or more Apartments | 0 | 0.0% |
| Mobile Home / Other | 922 | 75.9% |
| Total | 1,215 | 100.0% |
Housing Structures by Occupancy in Oasis
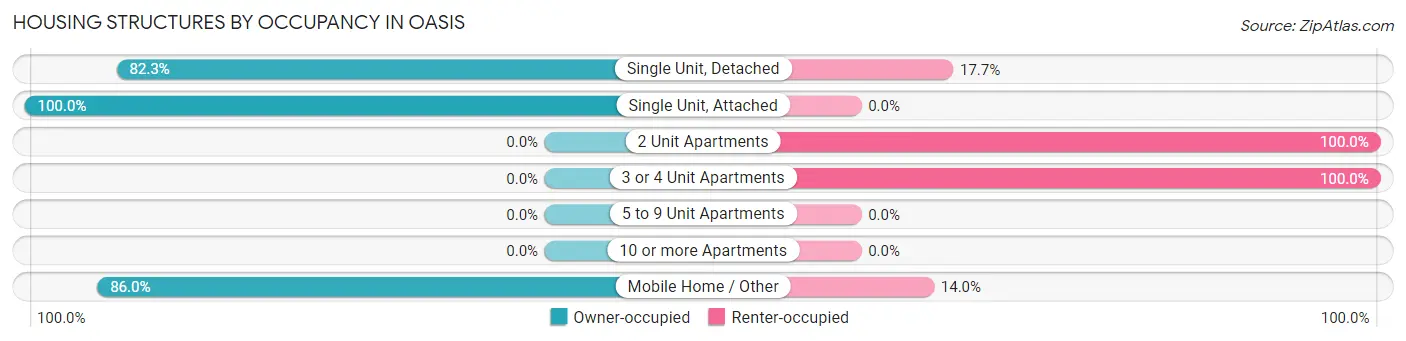
| Structure Type | Owner-occupied | Renter-occupied |
| Single Unit, Detached | 228 (82.3%) | 49 (17.7%) |
| Single Unit, Attached | 6 (100.0%) | 0 (0.0%) |
| 2 Unit Apartments | 0 (0.0%) | 6 (100.0%) |
| 3 or 4 Unit Apartments | 0 (0.0%) | 4 (100.0%) |
| 5 to 9 Unit Apartments | 0 (0.0%) | 0 (0.0%) |
| 10 or more Apartments | 0 (0.0%) | 0 (0.0%) |
| Mobile Home / Other | 793 (86.0%) | 129 (14.0%) |
| Total | 1,027 (84.5%) | 188 (15.5%) |
Housing Structures by Number of Rooms in Oasis
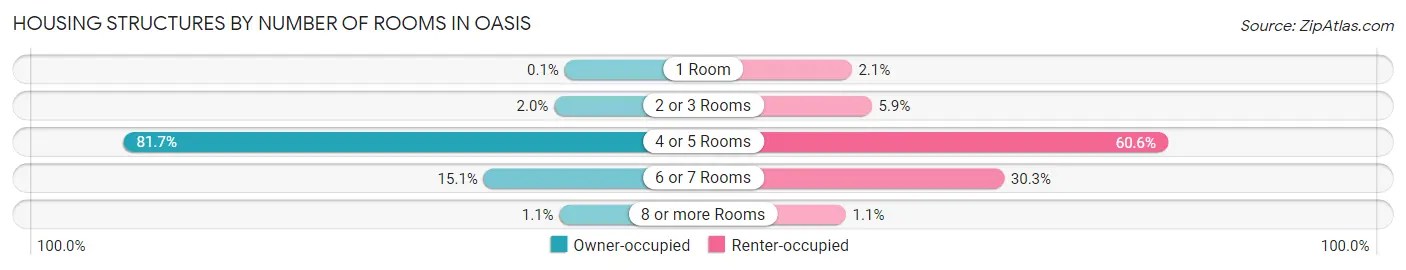
| Number of Rooms | Owner-occupied | Renter-occupied |
| 1 Room | 1 (0.1%) | 4 (2.1%) |
| 2 or 3 Rooms | 21 (2.0%) | 11 (5.9%) |
| 4 or 5 Rooms | 839 (81.7%) | 114 (60.6%) |
| 6 or 7 Rooms | 155 (15.1%) | 57 (30.3%) |
| 8 or more Rooms | 11 (1.1%) | 2 (1.1%) |
| Total | 1,027 (100.0%) | 188 (100.0%) |
Housing Structure by Heating Type in Oasis
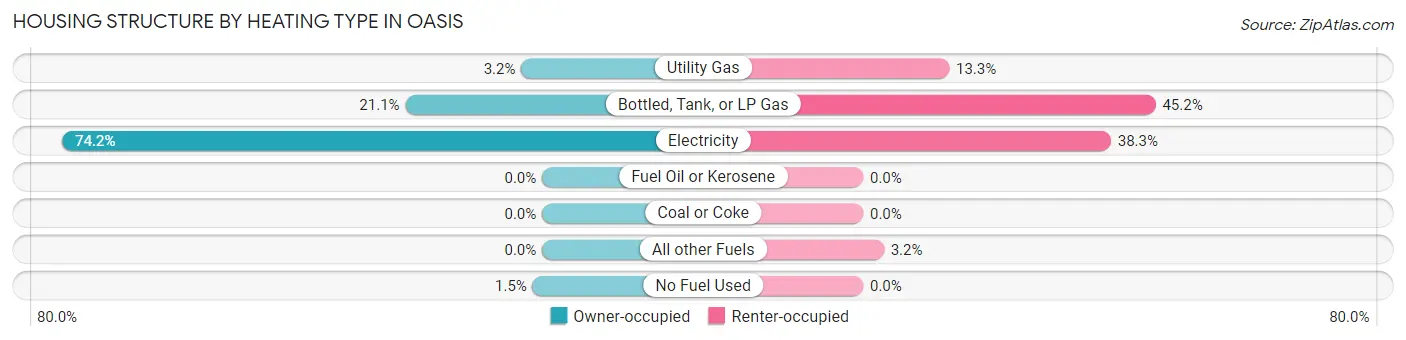
| Heating Type | Owner-occupied | Renter-occupied |
| Utility Gas | 33 (3.2%) | 25 (13.3%) |
| Bottled, Tank, or LP Gas | 217 (21.1%) | 85 (45.2%) |
| Electricity | 762 (74.2%) | 72 (38.3%) |
| Fuel Oil or Kerosene | 0 (0.0%) | 0 (0.0%) |
| Coal or Coke | 0 (0.0%) | 0 (0.0%) |
| All other Fuels | 0 (0.0%) | 6 (3.2%) |
| No Fuel Used | 15 (1.5%) | 0 (0.0%) |
| Total | 1,027 (100.0%) | 188 (100.0%) |
Household Vehicle Usage in Oasis
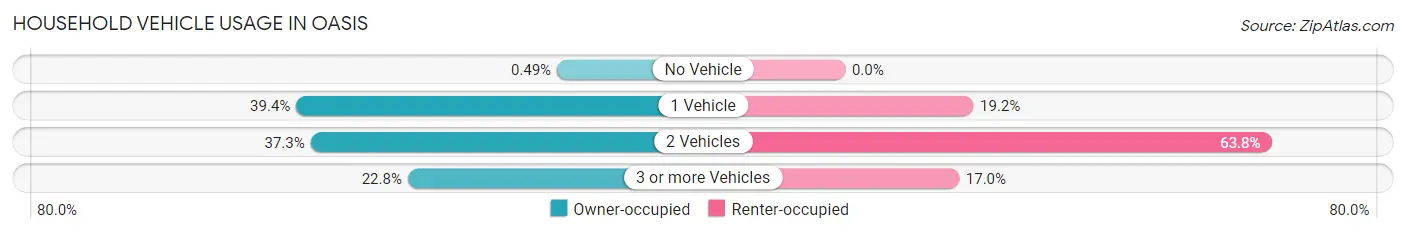
| Vehicles per Household | Owner-occupied | Renter-occupied |
| No Vehicle | 5 (0.5%) | 0 (0.0%) |
| 1 Vehicle | 405 (39.4%) | 36 (19.2%) |
| 2 Vehicles | 383 (37.3%) | 120 (63.8%) |
| 3 or more Vehicles | 234 (22.8%) | 32 (17.0%) |
| Total | 1,027 (100.0%) | 188 (100.0%) |
Real Estate & Mortgages in Oasis
Real Estate and Mortgage Overview in Oasis
| Characteristic | Without Mortgage | With Mortgage |
| Housing Units | 985 | 42 |
| Median Property Value | $33,400 | $0 |
| Median Household Income | $23,586 | $0 |
| Monthly Housing Costs | $656 | $2 |
| Real Estate Taxes | $1,396 | $30 |
Property Value by Mortgage Status in Oasis
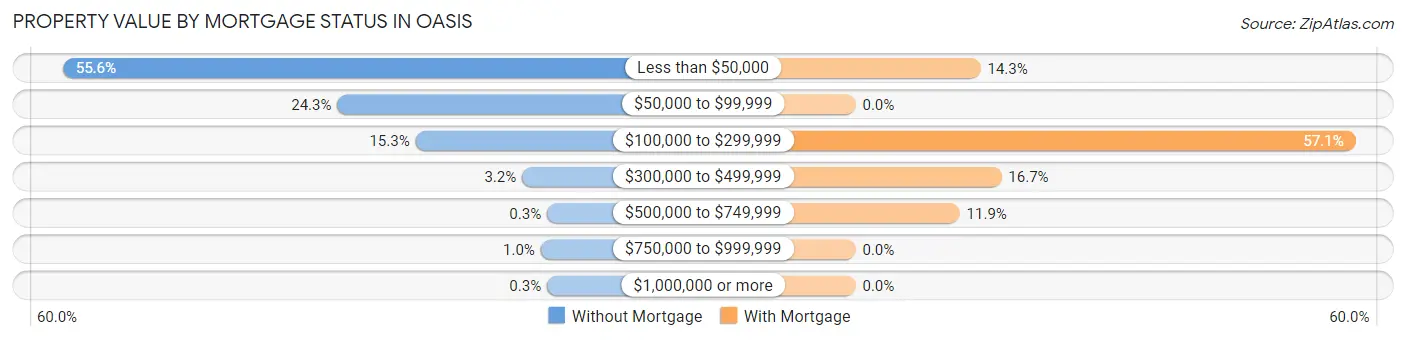
| Property Value | Without Mortgage | With Mortgage |
| Less than $50,000 | 548 (55.6%) | 6 (14.3%) |
| $50,000 to $99,999 | 239 (24.3%) | 0 (0.0%) |
| $100,000 to $299,999 | 151 (15.3%) | 24 (57.1%) |
| $300,000 to $499,999 | 31 (3.2%) | 7 (16.7%) |
| $500,000 to $749,999 | 3 (0.3%) | 5 (11.9%) |
| $750,000 to $999,999 | 10 (1.0%) | 0 (0.0%) |
| $1,000,000 or more | 3 (0.3%) | 0 (0.0%) |
| Total | 985 (100.0%) | 42 (100.0%) |
Household Income by Mortgage Status in Oasis
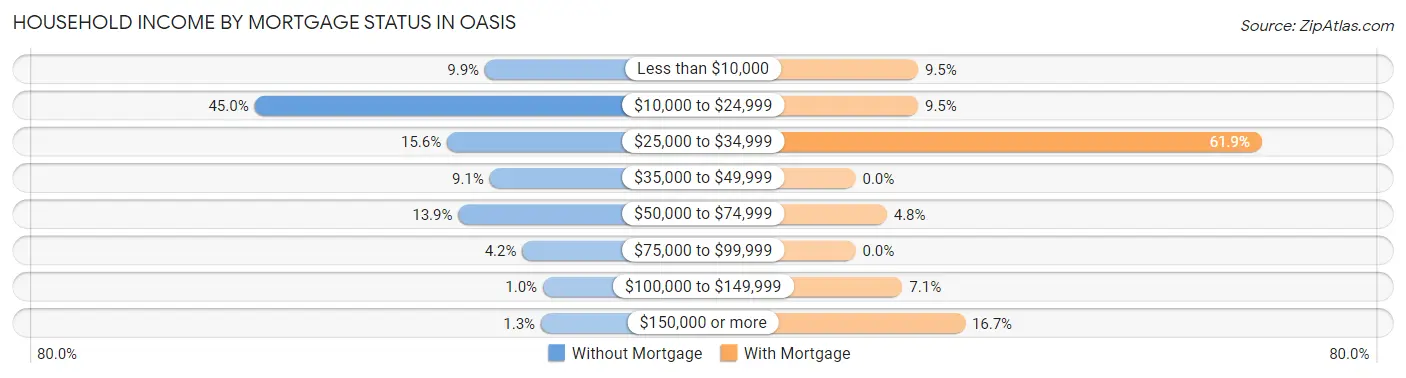
| Household Income | Without Mortgage | With Mortgage |
| Less than $10,000 | 97 (9.9%) | 4 (9.5%) |
| $10,000 to $24,999 | 443 (45.0%) | 4 (9.5%) |
| $25,000 to $34,999 | 154 (15.6%) | 26 (61.9%) |
| $35,000 to $49,999 | 90 (9.1%) | 0 (0.0%) |
| $50,000 to $74,999 | 137 (13.9%) | 2 (4.8%) |
| $75,000 to $99,999 | 41 (4.2%) | 0 (0.0%) |
| $100,000 to $149,999 | 10 (1.0%) | 3 (7.1%) |
| $150,000 or more | 13 (1.3%) | 7 (16.7%) |
| Total | 985 (100.0%) | 42 (100.0%) |
Property Value to Household Income Ratio in Oasis
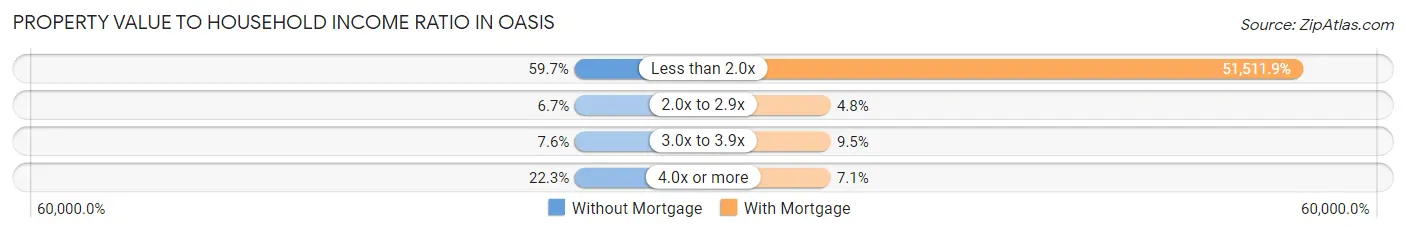
| Value-to-Income Ratio | Without Mortgage | With Mortgage |
| Less than 2.0x | 588 (59.7%) | 21,635 (51,511.9%) |
| 2.0x to 2.9x | 66 (6.7%) | 2 (4.8%) |
| 3.0x to 3.9x | 75 (7.6%) | 4 (9.5%) |
| 4.0x or more | 220 (22.3%) | 3 (7.1%) |
| Total | 985 (100.0%) | 42 (100.0%) |
Real Estate Taxes by Mortgage Status in Oasis
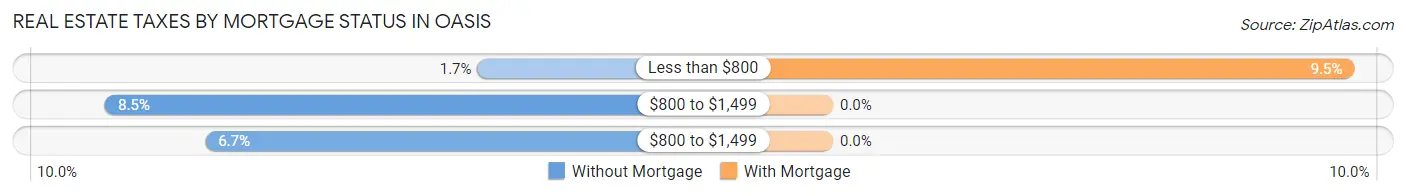
| Property Taxes | Without Mortgage | With Mortgage |
| Less than $800 | 17 (1.7%) | 4 (9.5%) |
| $800 to $1,499 | 84 (8.5%) | 0 (0.0%) |
| $800 to $1,499 | 66 (6.7%) | 0 (0.0%) |
| Total | 985 (100.0%) | 42 (100.0%) |
Health & Disability in Oasis
Health Insurance Coverage by Age in Oasis
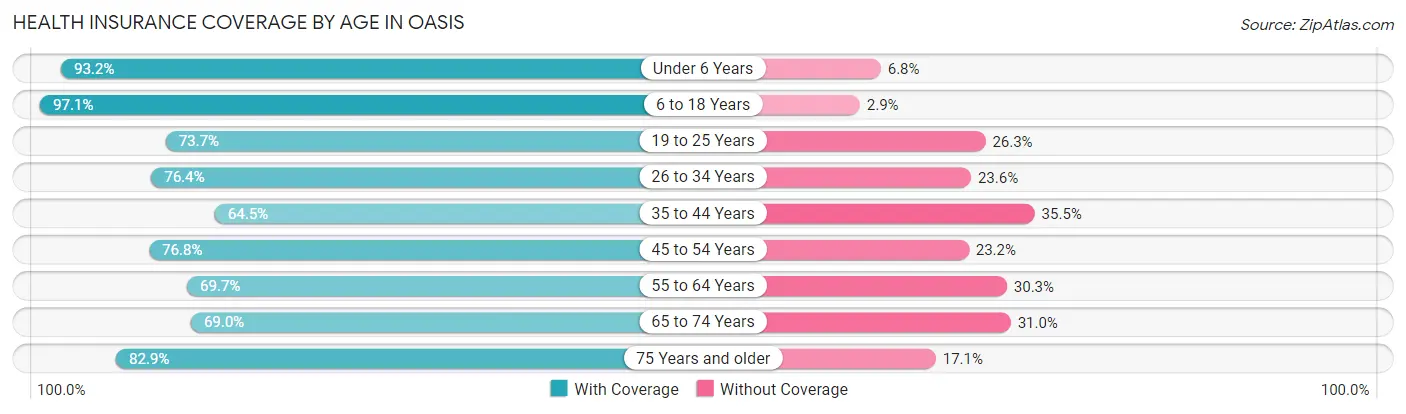
| Age Bracket | With Coverage | Without Coverage |
| Under 6 Years | 233 (93.2%) | 17 (6.8%) |
| 6 to 18 Years | 770 (97.1%) | 23 (2.9%) |
| 19 to 25 Years | 462 (73.7%) | 165 (26.3%) |
| 26 to 34 Years | 278 (76.4%) | 86 (23.6%) |
| 35 to 44 Years | 327 (64.5%) | 180 (35.5%) |
| 45 to 54 Years | 516 (76.8%) | 156 (23.2%) |
| 55 to 64 Years | 262 (69.7%) | 114 (30.3%) |
| 65 to 74 Years | 100 (69.0%) | 45 (31.0%) |
| 75 Years and older | 34 (82.9%) | 7 (17.1%) |
| Total | 2,982 (79.0%) | 793 (21.0%) |
Health Insurance Coverage by Citizenship Status in Oasis
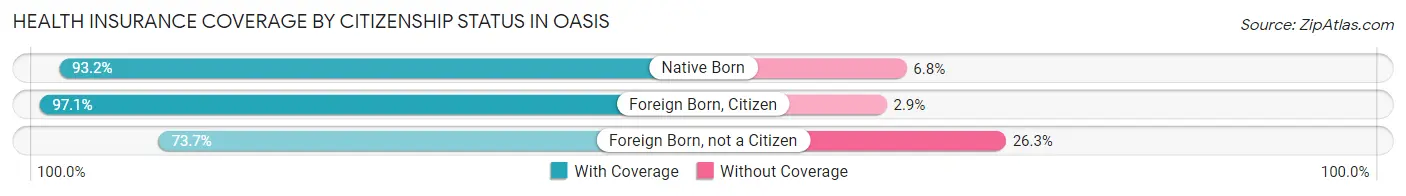
| Citizenship Status | With Coverage | Without Coverage |
| Native Born | 233 (93.2%) | 17 (6.8%) |
| Foreign Born, Citizen | 770 (97.1%) | 23 (2.9%) |
| Foreign Born, not a Citizen | 462 (73.7%) | 165 (26.3%) |
Health Insurance Coverage by Household Income in Oasis
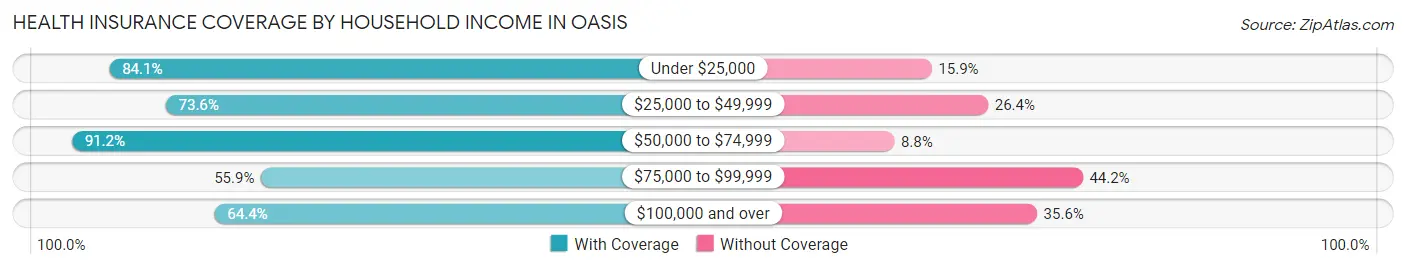
| Household Income | With Coverage | Without Coverage |
| Under $25,000 | 1,098 (84.1%) | 207 (15.9%) |
| $25,000 to $49,999 | 944 (73.6%) | 339 (26.4%) |
| $50,000 to $74,999 | 629 (91.2%) | 61 (8.8%) |
| $75,000 to $99,999 | 148 (55.8%) | 117 (44.2%) |
| $100,000 and over | 125 (64.4%) | 69 (35.6%) |
Public vs Private Health Insurance Coverage by Age in Oasis
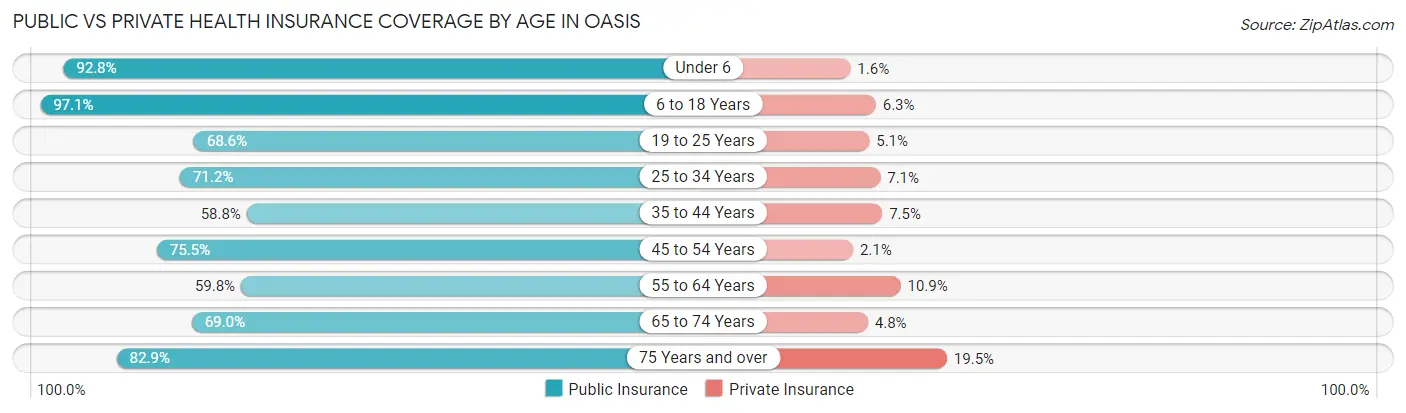
| Age Bracket | Public Insurance | Private Insurance |
| Under 6 | 232 (92.8%) | 4 (1.6%) |
| 6 to 18 Years | 770 (97.1%) | 50 (6.3%) |
| 19 to 25 Years | 430 (68.6%) | 32 (5.1%) |
| 25 to 34 Years | 259 (71.2%) | 26 (7.1%) |
| 35 to 44 Years | 298 (58.8%) | 38 (7.5%) |
| 45 to 54 Years | 507 (75.4%) | 14 (2.1%) |
| 55 to 64 Years | 225 (59.8%) | 41 (10.9%) |
| 65 to 74 Years | 100 (69.0%) | 7 (4.8%) |
| 75 Years and over | 34 (82.9%) | 8 (19.5%) |
| Total | 2,855 (75.6%) | 220 (5.8%) |
Disability Status by Sex by Age in Oasis
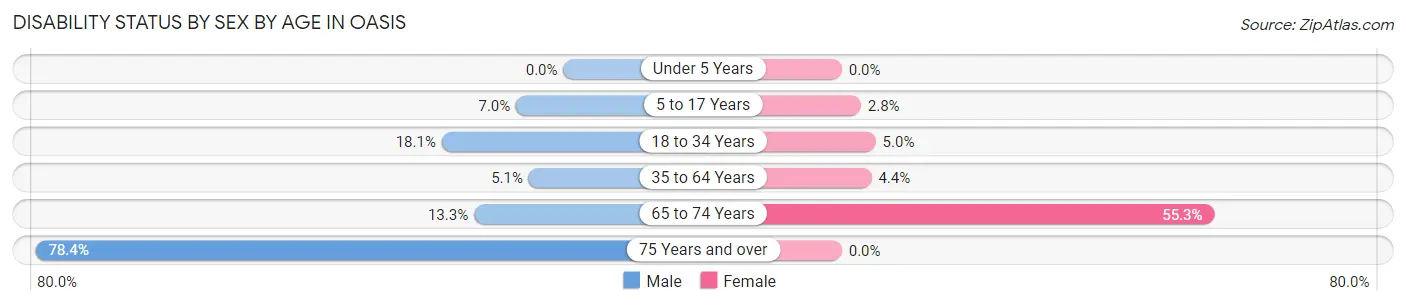
| Age Bracket | Male | Female |
| Under 5 Years | 0 (0.0%) | 0 (0.0%) |
| 5 to 17 Years | 26 (7.0%) | 10 (2.8%) |
| 18 to 34 Years | 95 (18.1%) | 29 (5.0%) |
| 35 to 64 Years | 46 (5.1%) | 29 (4.4%) |
| 65 to 74 Years | 13 (13.3%) | 26 (55.3%) |
| 75 Years and over | 29 (78.4%) | 0 (0.0%) |
Disability Class by Sex by Age in Oasis
Disability Class: Hearing Difficulty
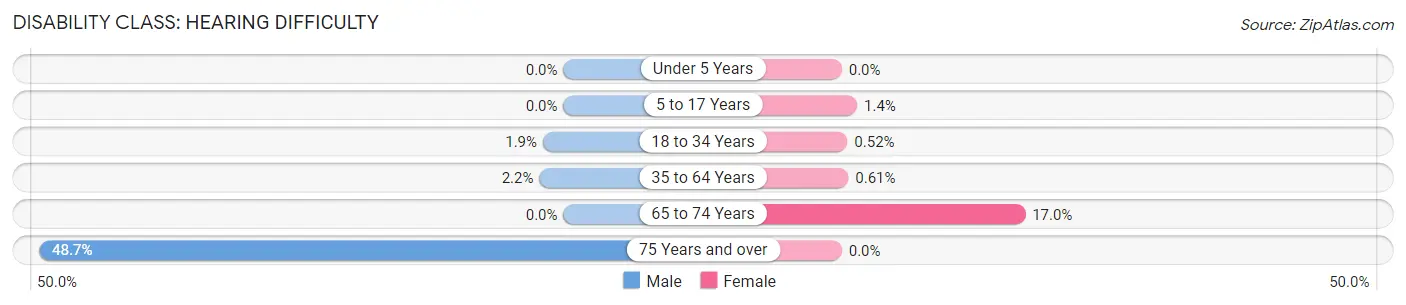
| Age Bracket | Male | Female |
| Under 5 Years | 0 (0.0%) | 0 (0.0%) |
| 5 to 17 Years | 0 (0.0%) | 5 (1.4%) |
| 18 to 34 Years | 10 (1.9%) | 3 (0.5%) |
| 35 to 64 Years | 20 (2.2%) | 4 (0.6%) |
| 65 to 74 Years | 0 (0.0%) | 8 (17.0%) |
| 75 Years and over | 18 (48.6%) | 0 (0.0%) |
Disability Class: Vision Difficulty
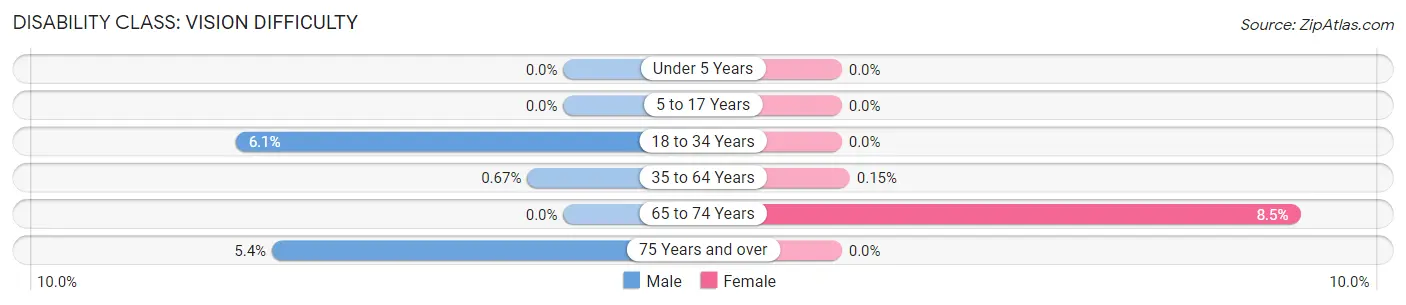
| Age Bracket | Male | Female |
| Under 5 Years | 0 (0.0%) | 0 (0.0%) |
| 5 to 17 Years | 0 (0.0%) | 0 (0.0%) |
| 18 to 34 Years | 32 (6.1%) | 0 (0.0%) |
| 35 to 64 Years | 6 (0.7%) | 1 (0.2%) |
| 65 to 74 Years | 0 (0.0%) | 4 (8.5%) |
| 75 Years and over | 2 (5.4%) | 0 (0.0%) |
Disability Class: Cognitive Difficulty
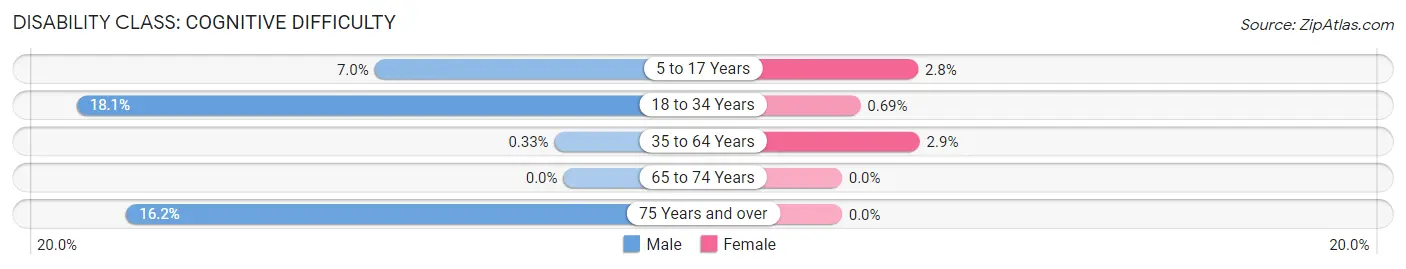
| Age Bracket | Male | Female |
| 5 to 17 Years | 26 (7.0%) | 10 (2.8%) |
| 18 to 34 Years | 95 (18.1%) | 4 (0.7%) |
| 35 to 64 Years | 3 (0.3%) | 19 (2.9%) |
| 65 to 74 Years | 0 (0.0%) | 0 (0.0%) |
| 75 Years and over | 6 (16.2%) | 0 (0.0%) |
Disability Class: Ambulatory Difficulty
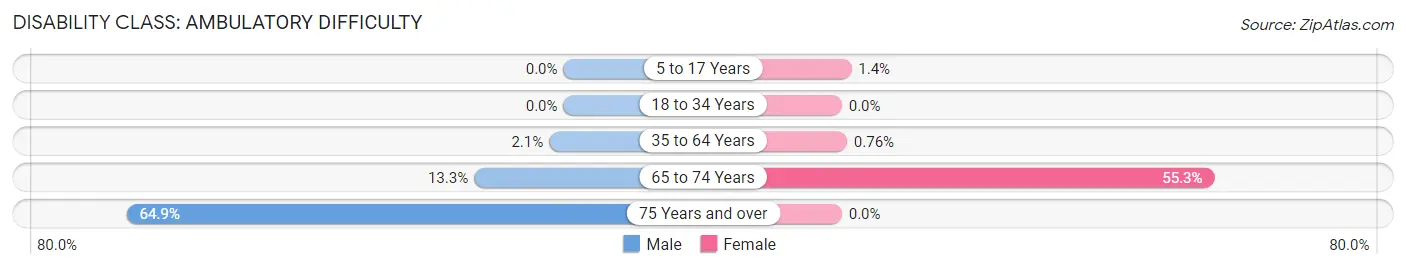
| Age Bracket | Male | Female |
| 5 to 17 Years | 0 (0.0%) | 5 (1.4%) |
| 18 to 34 Years | 0 (0.0%) | 0 (0.0%) |
| 35 to 64 Years | 19 (2.1%) | 5 (0.8%) |
| 65 to 74 Years | 13 (13.3%) | 26 (55.3%) |
| 75 Years and over | 24 (64.9%) | 0 (0.0%) |
Disability Class: Self-Care Difficulty
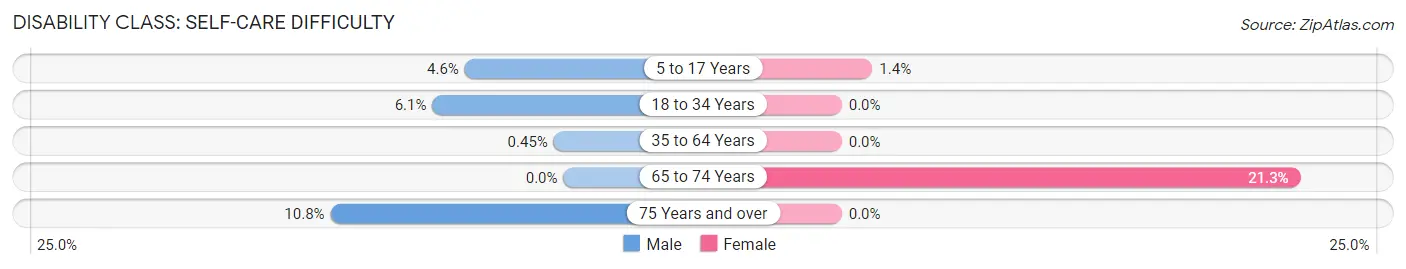
| Age Bracket | Male | Female |
| 5 to 17 Years | 17 (4.6%) | 5 (1.4%) |
| 18 to 34 Years | 32 (6.1%) | 0 (0.0%) |
| 35 to 64 Years | 4 (0.4%) | 0 (0.0%) |
| 65 to 74 Years | 0 (0.0%) | 10 (21.3%) |
| 75 Years and over | 4 (10.8%) | 0 (0.0%) |
Technology Access in Oasis
Computing Device Access in Oasis
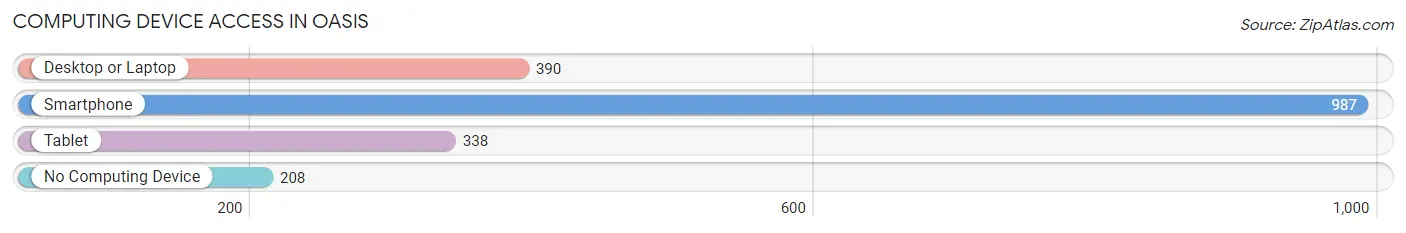
| Device Type | # Households | % Households |
| Desktop or Laptop | 390 | 32.1% |
| Smartphone | 987 | 81.2% |
| Tablet | 338 | 27.8% |
| No Computing Device | 208 | 17.1% |
| Total | 1,215 | 100.0% |
Internet Access in Oasis
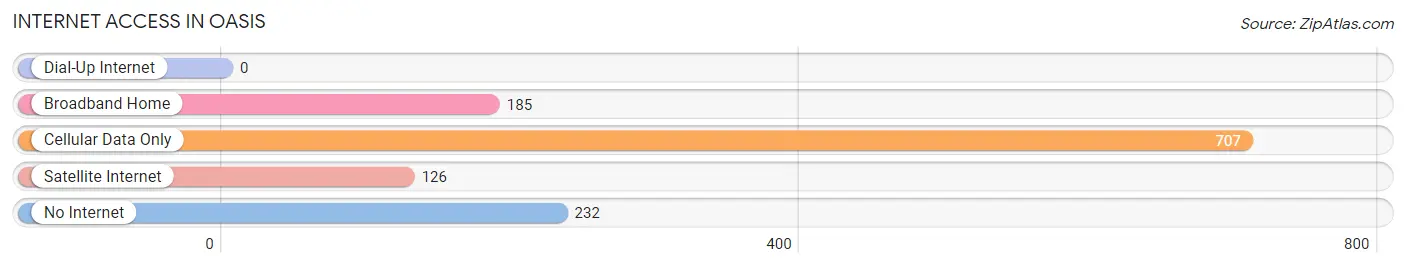
| Internet Type | # Households | % Households |
| Dial-Up Internet | 0 | 0.0% |
| Broadband Home | 185 | 15.2% |
| Cellular Data Only | 707 | 58.2% |
| Satellite Internet | 126 | 10.4% |
| No Internet | 232 | 19.1% |
| Total | 1,215 | 100.0% |
Oasis Summary
Oasis is a small town located in the Mojave Desert of California. It is situated in San Bernardino County, approximately 40 miles northeast of Barstow. The town was founded in 1876 and is home to a population of just over 1,000 people.
Geography
Oasis is located in the Mojave Desert, which is characterized by its dry climate and sparse vegetation. The town is situated at an elevation of 2,845 feet and is surrounded by the San Bernardino Mountains to the north and the San Gabriel Mountains to the south. The town is located on the Mojave River, which is a tributary of the Colorado River. The town is also located near the San Andreas Fault, which is a major geological feature of the region.
The town is located in a semi-arid climate, with hot summers and mild winters. The average annual temperature is around 70 degrees Fahrenheit, with temperatures reaching up to 100 degrees in the summer months. The town receives an average of 8 inches of precipitation per year, with most of it falling in the winter months.
Economy
The economy of Oasis is largely based on agriculture and tourism. The town is home to a number of farms, which produce a variety of crops, including alfalfa, cotton, and melons. The town is also home to a number of tourist attractions, including the Oasis Wildlife Sanctuary, which is home to a variety of desert animals, and the Oasis Museum, which features a variety of artifacts from the town’s history.
The town is also home to a number of small businesses, including restaurants, shops, and a gas station. The town is also home to a number of service-based businesses, such as auto repair shops and a post office.
Demographics
As of the 2010 census, the population of Oasis was 1,037. The town is predominantly white, with the majority of the population being of Hispanic or Latino origin. The median household income in the town is $37,500, and the median age is 37.
The town is home to a number of churches, including the Oasis Church of the Nazarene, the Oasis Baptist Church, and the Oasis United Methodist Church. The town is also home to a number of schools, including the Oasis Elementary School, the Oasis Middle School, and the Oasis High School.
Conclusion
Oasis is a small town located in the Mojave Desert of California. It is situated in San Bernardino County, approximately 40 miles northeast of Barstow. The town was founded in 1876 and is home to a population of just over 1,000 people. The economy of Oasis is largely based on agriculture and tourism, and the town is predominantly white, with the majority of the population being of Hispanic or Latino origin. The town is home to a number of churches, schools, and businesses, and is a popular tourist destination due to its proximity to the San Bernardino Mountains and the San Andreas Fault.
Common Questions
What is Per Capita Income in Oasis?
Per Capita income in Oasis is $12,149.
What is the Median Family Income in Oasis?
Median Family Income in Oasis is $32,865.
What is the Median Household income in Oasis?
Median Household Income in Oasis is $25,335.
What is Income or Wage Gap in Oasis?
Income or Wage Gap in Oasis is 33.8%.
Women in Oasis earn 66.2 cents for every dollar earned by a man.
What is Inequality or Gini Index in Oasis?
Inequality or Gini Index in Oasis is 0.40.
What is the Total Population of Oasis?
Total Population of Oasis is 3,775.
What is the Total Male Population of Oasis?
Total Male Population of Oasis is 2,036.
What is the Total Female Population of Oasis?
Total Female Population of Oasis is 1,739.
What is the Ratio of Males per 100 Females in Oasis?
There are 117.08 Males per 100 Females in Oasis.
What is the Ratio of Females per 100 Males in Oasis?
There are 85.41 Females per 100 Males in Oasis.
What is the Median Population Age in Oasis?
Median Population Age in Oasis is 31.9 Years.
What is the Average Family Size in Oasis
Average Family Size in Oasis is 3.9 People.
What is the Average Household Size in Oasis
Average Household Size in Oasis is 3.1 People.
How Large is the Labor Force in Oasis?
There are 2,189 People in the Labor Forcein in Oasis.
What is the Percentage of People in the Labor Force in Oasis?
75.0% of People are in the Labor Force in Oasis.
What is the Unemployment Rate in Oasis?
Unemployment Rate in Oasis is 19.0%.