Cities with the Highest Unemployment Rate Amomg Youth Under the Age of 25 in New Mexico
RELATED REPORTS & OPTIONS
Highest Unemployment | Youth < 25
New Mexico
Compare Cities
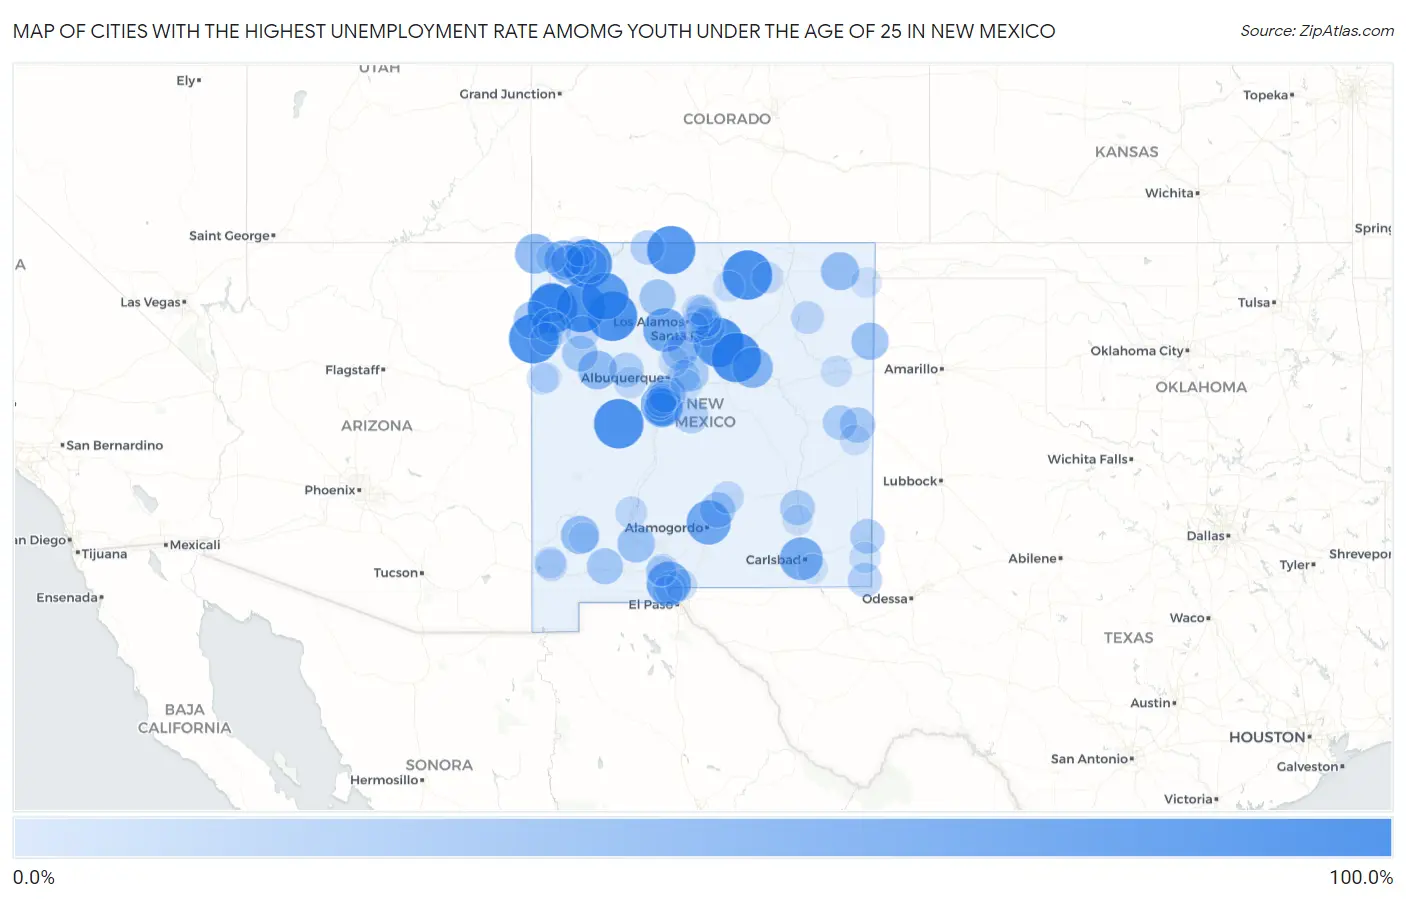
Map of Cities with the Highest Unemployment Rate Amomg Youth Under the Age of 25 in New Mexico
0.0%
100.0%
Cities with the Highest Unemployment Rate Amomg Youth Under the Age of 25 in New Mexico
| City | Youth Unemployment | vs State | vs National | |
| 1. | Pueblo Pintado | 100.0% | 11.6%(+88.4)#1 | 10.9%(+89.1)#20 |
| 2. | Glorieta | 100.0% | 11.6%(+88.4)#2 | 10.9%(+89.1)#97 |
| 3. | Naschitti | 100.0% | 11.6%(+88.4)#3 | 10.9%(+89.1)#132 |
| 4. | Ribera | 100.0% | 11.6%(+88.4)#4 | 10.9%(+89.1)#137 |
| 5. | Tse Bonito | 100.0% | 11.6%(+88.4)#5 | 10.9%(+89.1)#232 |
| 6. | Lake Valley | 100.0% | 11.6%(+88.4)#6 | 10.9%(+89.1)#269 |
| 7. | Alamo | 99.9% | 11.6%(+88.3)#7 | 10.9%(+89.0)#333 |
| 8. | Eagle Nest | 99.9% | 11.6%(+88.3)#8 | 10.9%(+89.0)#357 |
| 9. | Lee Acres | 97.4% | 11.6%(+85.8)#9 | 10.9%(+86.5)#380 |
| 10. | Chama | 94.1% | 11.6%(+82.5)#10 | 10.9%(+83.2)#388 |
| 11. | Nageezi | 88.8% | 11.6%(+77.2)#11 | 10.9%(+77.9)#409 |
| 12. | La Luz | 76.2% | 11.6%(+64.6)#12 | 10.9%(+65.3)#493 |
| 13. | Berino | 76.2% | 11.6%(+64.6)#13 | 10.9%(+65.3)#494 |
| 14. | Jemez Springs | 73.8% | 11.6%(+62.2)#14 | 10.9%(+62.9)#535 |
| 15. | Happy Valley | 70.5% | 11.6%(+58.9)#15 | 10.9%(+59.6)#580 |
| 16. | Sausal | 63.8% | 11.6%(+52.2)#16 | 10.9%(+52.9)#693 |
| 17. | Fruitland | 61.8% | 11.6%(+50.2)#17 | 10.9%(+50.9)#732 |
| 18. | Tecolotito | 60.8% | 11.6%(+49.2)#18 | 10.9%(+49.9)#754 |
| 19. | Ojo Encino | 60.6% | 11.6%(+49.0)#19 | 10.9%(+49.7)#757 |
| 20. | Beclabito | 57.1% | 11.6%(+45.5)#20 | 10.9%(+46.2)#857 |
| 21. | Sheep Springs | 56.5% | 11.6%(+44.9)#21 | 10.9%(+45.6)#875 |
| 22. | Ojo Amarillo | 55.5% | 11.6%(+43.9)#22 | 10.9%(+44.6)#903 |
| 23. | Waterflow | 54.3% | 11.6%(+42.7)#23 | 10.9%(+43.4)#945 |
| 24. | Milan | 52.6% | 11.6%(+41.0)#24 | 10.9%(+41.7)#1,002 |
| 25. | Peralta | 51.8% | 11.6%(+40.2)#25 | 10.9%(+40.9)#1,030 |
| 26. | Totah Vista | 51.2% | 11.6%(+39.6)#26 | 10.9%(+40.3)#1,053 |
| 27. | Rio Communities | 50.1% | 11.6%(+38.5)#27 | 10.9%(+39.2)#1,078 |
| 28. | Arenas Valley | 50.0% | 11.6%(+38.4)#28 | 10.9%(+39.1)#1,087 |
| 29. | Grenville | 50.0% | 11.6%(+38.4)#29 | 10.9%(+39.1)#1,157 |
| 30. | Hatch | 46.4% | 11.6%(+34.8)#30 | 10.9%(+35.5)#1,292 |
| 31. | Navajo | 45.9% | 11.6%(+34.3)#31 | 10.9%(+35.0)#1,320 |
| 32. | Nara Visa | 45.4% | 11.6%(+33.8)#32 | 10.9%(+34.5)#1,348 |
| 33. | Pinedale | 45.3% | 11.6%(+33.7)#33 | 10.9%(+34.4)#1,351 |
| 34. | West Hammond | 43.9% | 11.6%(+32.3)#34 | 10.9%(+33.0)#1,417 |
| 35. | Tesuque Pueblo | 43.4% | 11.6%(+31.8)#35 | 10.9%(+32.5)#1,464 |
| 36. | Iyanbito | 42.6% | 11.6%(+31.0)#36 | 10.9%(+31.7)#1,531 |
| 37. | Gallina | 41.6% | 11.6%(+30.0)#37 | 10.9%(+30.7)#1,601 |
| 38. | Keeler Farm | 40.0% | 11.6%(+28.4)#38 | 10.9%(+29.1)#1,688 |
| 39. | Thoreau | 39.3% | 11.6%(+27.7)#39 | 10.9%(+28.4)#1,758 |
| 40. | Center Point | 39.0% | 11.6%(+27.4)#40 | 10.9%(+28.1)#1,779 |
| 41. | San Felipe Pueblo | 38.4% | 11.6%(+26.8)#41 | 10.9%(+27.5)#1,814 |
| 42. | Mescalero | 37.2% | 11.6%(+25.6)#42 | 10.9%(+26.3)#1,927 |
| 43. | Cannon Afb | 36.8% | 11.6%(+25.2)#43 | 10.9%(+25.9)#1,943 |
| 44. | Jarales | 36.0% | 11.6%(+24.4)#44 | 10.9%(+25.1)#2,014 |
| 45. | Edgewood | 35.5% | 11.6%(+23.9)#45 | 10.9%(+24.6)#2,052 |
| 46. | Dexter | 35.5% | 11.6%(+23.9)#46 | 10.9%(+24.6)#2,060 |
| 47. | Seboyeta | 34.2% | 11.6%(+22.6)#47 | 10.9%(+23.3)#2,185 |
| 48. | North Hobbs | 34.1% | 11.6%(+22.5)#48 | 10.9%(+23.2)#2,192 |
| 49. | Melrose | 33.3% | 11.6%(+21.7)#49 | 10.9%(+22.4)#2,273 |
| 50. | Dulce | 32.3% | 11.6%(+20.7)#50 | 10.9%(+21.4)#2,417 |
| 51. | Jal | 32.3% | 11.6%(+20.7)#51 | 10.9%(+21.4)#2,418 |
| 52. | Mountainair | 32.0% | 11.6%(+20.4)#52 | 10.9%(+21.1)#2,450 |
| 53. | Placitas Cdp Sandoval County | 30.3% | 11.6%(+18.7)#53 | 10.9%(+19.4)#2,644 |
| 54. | Tohatchi | 29.4% | 11.6%(+17.8)#54 | 10.9%(+18.5)#2,769 |
| 55. | Crownpoint | 27.5% | 11.6%(+15.9)#55 | 10.9%(+16.6)#3,031 |
| 56. | Roy | 26.5% | 11.6%(+14.9)#56 | 10.9%(+15.6)#3,213 |
| 57. | Santo Domingo Pueblo | 26.3% | 11.6%(+14.7)#57 | 10.9%(+15.4)#3,239 |
| 58. | Anthony | 26.2% | 11.6%(+14.6)#58 | 10.9%(+15.3)#3,265 |
| 59. | Brimhall Nizhoni | 26.2% | 11.6%(+14.6)#59 | 10.9%(+15.3)#3,277 |
| 60. | Nenahnezad | 25.7% | 11.6%(+14.1)#60 | 10.9%(+14.8)#3,367 |
| 61. | Belen | 25.6% | 11.6%(+14.0)#61 | 10.9%(+14.7)#3,373 |
| 62. | Cedar Crest | 24.9% | 11.6%(+13.3)#62 | 10.9%(+14.0)#3,528 |
| 63. | Ruidoso Downs | 24.7% | 11.6%(+13.1)#63 | 10.9%(+13.8)#3,571 |
| 64. | Valencia | 24.7% | 11.6%(+13.1)#64 | 10.9%(+13.8)#3,575 |
| 65. | University Park | 24.0% | 11.6%(+12.4)#65 | 10.9%(+13.1)#3,698 |
| 66. | Santa Cruz | 23.3% | 11.6%(+11.7)#66 | 10.9%(+12.4)#3,864 |
| 67. | Lordsburg | 23.0% | 11.6%(+11.4)#67 | 10.9%(+12.1)#3,924 |
| 68. | Yah Ta Hey | 23.0% | 11.6%(+11.4)#68 | 10.9%(+12.1)#3,936 |
| 69. | Williamsburg | 22.9% | 11.6%(+11.3)#69 | 10.9%(+12.0)#3,972 |
| 70. | Isleta | 22.8% | 11.6%(+11.2)#70 | 10.9%(+11.9)#3,992 |
| 71. | Cimarron | 21.6% | 11.6%(+10.0)#71 | 10.9%(+10.7)#4,288 |
| 72. | Mesita | 21.5% | 11.6%(+9.90)#72 | 10.9%(+10.6)#4,316 |
| 73. | Chaparral | 21.4% | 11.6%(+9.80)#73 | 10.9%(+10.5)#4,321 |
| 74. | Glen Acres | 20.6% | 11.6%(+9.00)#74 | 10.9%(+9.70)#4,557 |
| 75. | Ponderosa Pine | 20.4% | 11.6%(+8.80)#75 | 10.9%(+9.50)#4,603 |
| 76. | Eunice | 20.3% | 11.6%(+8.70)#76 | 10.9%(+9.40)#4,626 |
| 77. | Zuni Pueblo | 20.1% | 11.6%(+8.50)#77 | 10.9%(+9.20)#4,664 |
| 78. | Taos | 19.3% | 11.6%(+7.70)#78 | 10.9%(+8.40)#4,927 |
| 79. | Tucumcari | 19.3% | 11.6%(+7.70)#79 | 10.9%(+8.40)#4,930 |
| 80. | Cuyamungue Grant | 18.6% | 11.6%(+7.00)#80 | 10.9%(+7.70)#5,189 |
| 81. | Hernandez | 18.1% | 11.6%(+6.50)#81 | 10.9%(+7.20)#5,329 |
| 82. | San Ildefonso Pueblo | 18.1% | 11.6%(+6.50)#82 | 10.9%(+7.20)#5,331 |
| 83. | La Union | 17.9% | 11.6%(+6.30)#83 | 10.9%(+7.00)#5,429 |
| 84. | Nambe | 17.3% | 11.6%(+5.70)#84 | 10.9%(+6.40)#5,690 |
| 85. | Bernalillo | 17.2% | 11.6%(+5.60)#85 | 10.9%(+6.30)#5,722 |
| 86. | Ohkay Owingeh | 17.2% | 11.6%(+5.60)#86 | 10.9%(+6.30)#5,741 |
| 87. | Shiprock | 17.1% | 11.6%(+5.50)#87 | 10.9%(+6.20)#5,767 |
| 88. | Portales | 17.0% | 11.6%(+5.40)#88 | 10.9%(+6.10)#5,791 |
| 89. | South River | 17.0% | 11.6%(+5.40)#89 | 10.9%(+6.10)#5,800 |
| 90. | Los Chaves | 16.8% | 11.6%(+5.20)#90 | 10.9%(+5.90)#5,866 |
| 91. | White Rock | 16.6% | 11.6%(+5.00)#91 | 10.9%(+5.70)#5,933 |
| 92. | Lake Arthur | 16.6% | 11.6%(+5.00)#92 | 10.9%(+5.70)#5,965 |
| 93. | Clayton | 16.2% | 11.6%(+4.60)#93 | 10.9%(+5.30)#6,128 |
| 94. | Bayard | 16.2% | 11.6%(+4.60)#94 | 10.9%(+5.30)#6,136 |
| 95. | La Plata | 15.6% | 11.6%(+4.00)#95 | 10.9%(+4.70)#6,400 |
| 96. | San Pablo | 15.6% | 11.6%(+4.00)#96 | 10.9%(+4.70)#6,417 |
| 97. | Black Rock | 15.5% | 11.6%(+3.90)#97 | 10.9%(+4.60)#6,461 |
| 98. | Loving | 15.1% | 11.6%(+3.50)#98 | 10.9%(+4.20)#6,636 |
| 99. | Torreon Cdp Sandoval County | 14.9% | 11.6%(+3.30)#99 | 10.9%(+4.00)#6,747 |
| 100. | Farmington | 14.7% | 11.6%(+3.10)#100 | 10.9%(+3.80)#6,821 |
1
2Common Questions
What are the Top 10 Cities with the Highest Unemployment Rate Amomg Youth Under the Age of 25 in New Mexico?
Top 10 Cities with the Highest Unemployment Rate Amomg Youth Under the Age of 25 in New Mexico are:
#1
100.0%
#2
100.0%
#3
100.0%
#4
100.0%
#5
100.0%
#6
100.0%
#7
99.9%
#8
99.9%
#9
97.4%
#10
94.1%
What city has the Highest Unemployment Rate Amomg Youth Under the Age of 25 in New Mexico?
Pueblo Pintado has the Highest Unemployment Rate Amomg Youth Under the Age of 25 in New Mexico with 100.0%.
What is the Unemployment Rate Amomg Youth Under the Age of 25 in the State of New Mexico?
Unemployment Rate Amomg Youth Under the Age of 25 in New Mexico is 11.6%.
What is the Unemployment Rate Amomg Youth Under the Age of 25 in the United States?
Unemployment Rate Amomg Youth Under the Age of 25 in the United States is 10.9%.