La Vina, CA Map & Demographics
La Vina Map
La Vina Overview
$9,918
PER CAPITA INCOME
47.4%
WAGE / INCOME GAP [ % ]
52.6¢/ $1
WAGE / INCOME GAP [ $ ]
0.35
INEQUALITY / GINI INDEX
912
TOTAL POPULATION
693
MALE POPULATION
219
FEMALE POPULATION
316.44
MALES / 100 FEMALES
31.60
FEMALES / 100 MALES
17.0
MEDIAN AGE
5.8
AVG FAMILY SIZE
5.8
AVG HOUSEHOLD SIZE
278
LABOR FORCE [ PEOPLE ]
60.6%
PERCENT IN LABOR FORCE
28.4%
UNEMPLOYMENT RATE
Income in La Vina
Income Overview in La Vina
| Characteristic | Number | Measure |
| Per Capita Income | 912 | $9,918 |
| Median Family Income | 157 | $0 |
| Mean Family Income | 157 | $45,429 |
| Median Household Income | 157 | $0 |
| Mean Household Income | 157 | $45,429 |
| Income Deficit | 157 | $0 |
| Wage / Income Gap (%) | 912 | 47.37% |
| Wage / Income Gap ($) | 912 | 52.63¢ per $1 |
| Gini / Inequality Index | 912 | 0.35 |
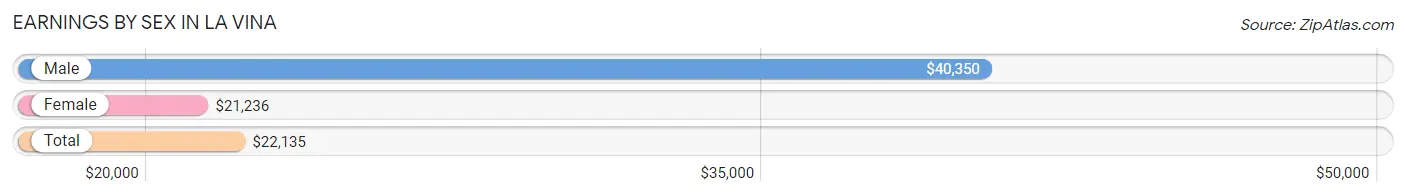
Earnings by Sex in La Vina
Average Earnings in La Vina are $22,135, $40,350 for men and $21,236 for women, a difference of 47.4%.
| Sex | Number | Average Earnings |
| Male | 176 (63.3%) | $40,350 |
| Female | 102 (36.7%) | $21,236 |
| Total | 278 (100.0%) | $22,135 |
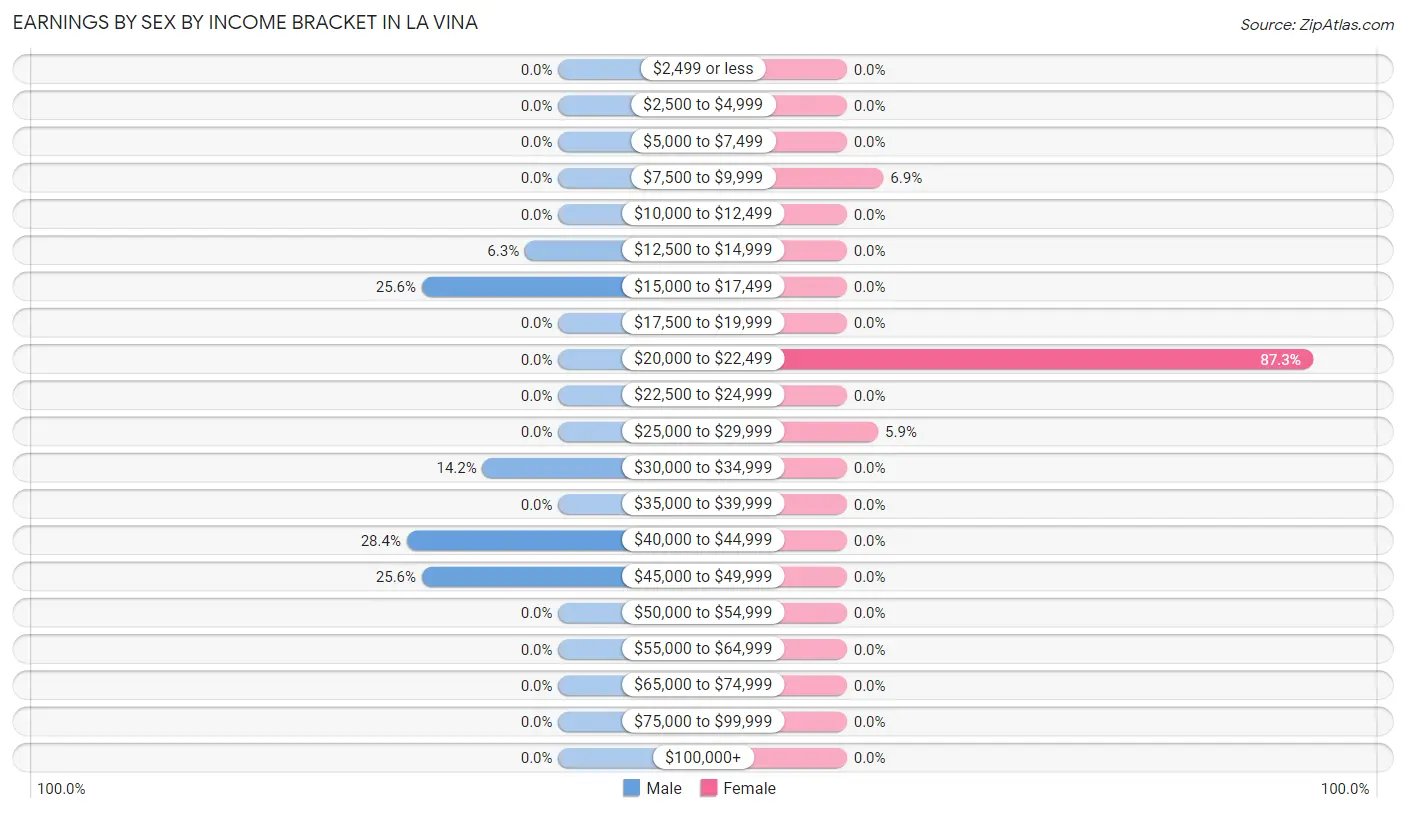
Earnings by Sex by Income Bracket in La Vina
The most common earnings brackets in La Vina are $40,000 to $44,999 for men (50 | 28.4%) and $20,000 to $22,499 for women (89 | 87.3%).
| Income | Male | Female |
| $2,499 or less | 0 (0.0%) | 0 (0.0%) |
| $2,500 to $4,999 | 0 (0.0%) | 0 (0.0%) |
| $5,000 to $7,499 | 0 (0.0%) | 0 (0.0%) |
| $7,500 to $9,999 | 0 (0.0%) | 7 (6.9%) |
| $10,000 to $12,499 | 0 (0.0%) | 0 (0.0%) |
| $12,500 to $14,999 | 11 (6.2%) | 0 (0.0%) |
| $15,000 to $17,499 | 45 (25.6%) | 0 (0.0%) |
| $17,500 to $19,999 | 0 (0.0%) | 0 (0.0%) |
| $20,000 to $22,499 | 0 (0.0%) | 89 (87.3%) |
| $22,500 to $24,999 | 0 (0.0%) | 0 (0.0%) |
| $25,000 to $29,999 | 0 (0.0%) | 6 (5.9%) |
| $30,000 to $34,999 | 25 (14.2%) | 0 (0.0%) |
| $35,000 to $39,999 | 0 (0.0%) | 0 (0.0%) |
| $40,000 to $44,999 | 50 (28.4%) | 0 (0.0%) |
| $45,000 to $49,999 | 45 (25.6%) | 0 (0.0%) |
| $50,000 to $54,999 | 0 (0.0%) | 0 (0.0%) |
| $55,000 to $64,999 | 0 (0.0%) | 0 (0.0%) |
| $65,000 to $74,999 | 0 (0.0%) | 0 (0.0%) |
| $75,000 to $99,999 | 0 (0.0%) | 0 (0.0%) |
| $100,000+ | 0 (0.0%) | 0 (0.0%) |
| Total | 176 (100.0%) | 102 (100.0%) |
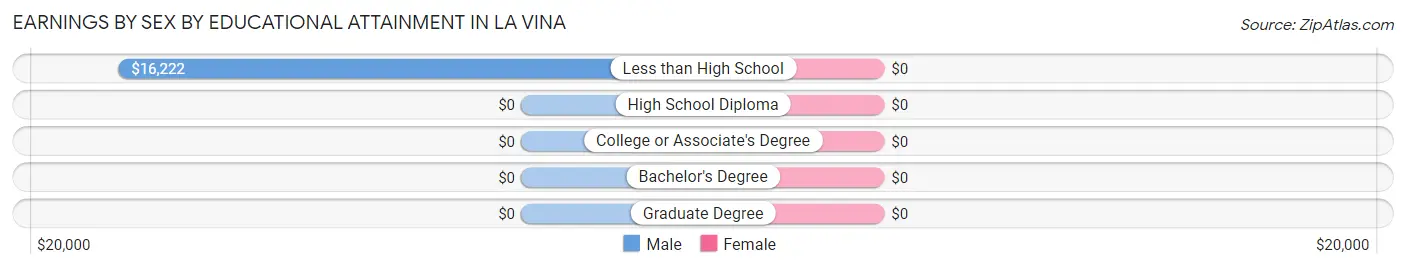
Earnings by Sex by Educational Attainment in La Vina
| Educational Attainment | Male Income | Female Income |
| Less than High School | $16,222 | $0 |
| High School Diploma | - | - |
| College or Associate's Degree | - | - |
| Bachelor's Degree | - | - |
| Graduate Degree | - | - |
| Total | $40,425 | $21,236 |
Family Income in La Vina
Family Income Brackets in La Vina
According to the La Vina family income data, there are 89 families falling into the $15,000 to $24,999 income range, which is the most common income bracket and makes up 56.7% of all families.
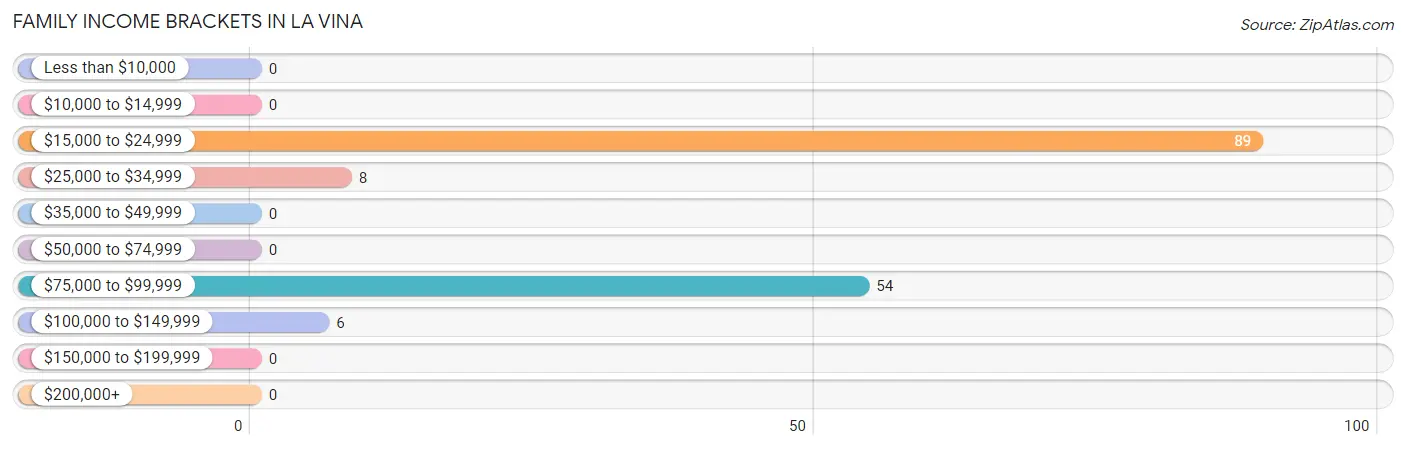
| Income Bracket | # Families | % Families |
| Less than $10,000 | 0 | 0.0% |
| $10,000 to $14,999 | 0 | 0.0% |
| $15,000 to $24,999 | 89 | 56.7% |
| $25,000 to $34,999 | 8 | 5.1% |
| $35,000 to $49,999 | 0 | 0.0% |
| $50,000 to $74,999 | 0 | 0.0% |
| $75,000 to $99,999 | 54 | 34.4% |
| $100,000 to $149,999 | 6 | 3.8% |
| $150,000 to $199,999 | 0 | 0.0% |
| $200,000+ | 0 | 0.0% |
Family Income by Famaliy Size in La Vina
3-person families (43 | 27.4%) account for the highest median family income in La Vina with $76,164 per family, while 3-person families (43 | 27.4%) have the highest median income of $25,388 per family member.
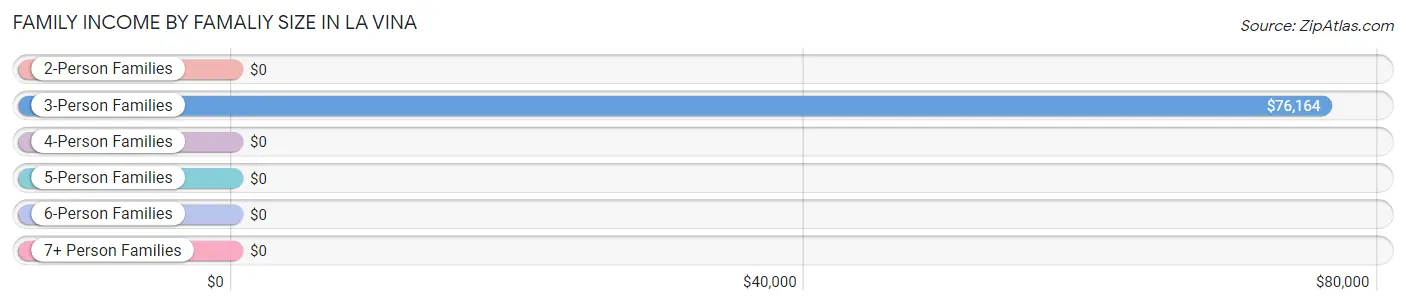
| Income Bracket | # Families | Median Income |
| 2-Person Families | 0 (0.0%) | $0 |
| 3-Person Families | 43 (27.4%) | $76,164 |
| 4-Person Families | 0 (0.0%) | $0 |
| 5-Person Families | 0 (0.0%) | $0 |
| 6-Person Families | 89 (56.7%) | $0 |
| 7+ Person Families | 25 (15.9%) | $0 |
| Total | 157 (100.0%) | $0 |
Family Income by Number of Earners in La Vina
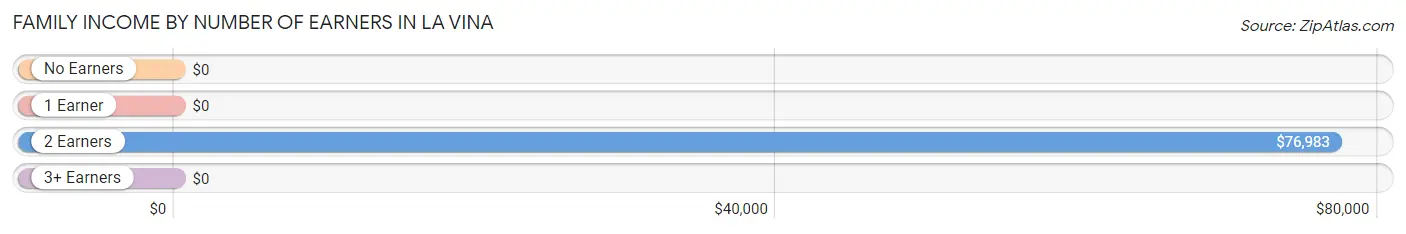
| Number of Earners | # Families | Median Income |
| No Earners | 0 (0.0%) | $0 |
| 1 Earner | 89 (56.7%) | $0 |
| 2 Earners | 62 (39.5%) | $76,983 |
| 3+ Earners | 6 (3.8%) | $0 |
| Total | 157 (100.0%) | $0 |
Household Income in La Vina
Household Income Brackets in La Vina
With 89 households falling in the category, the $15,000 to $24,999 income range is the most frequent in La Vina, accounting for 56.7% of all households.
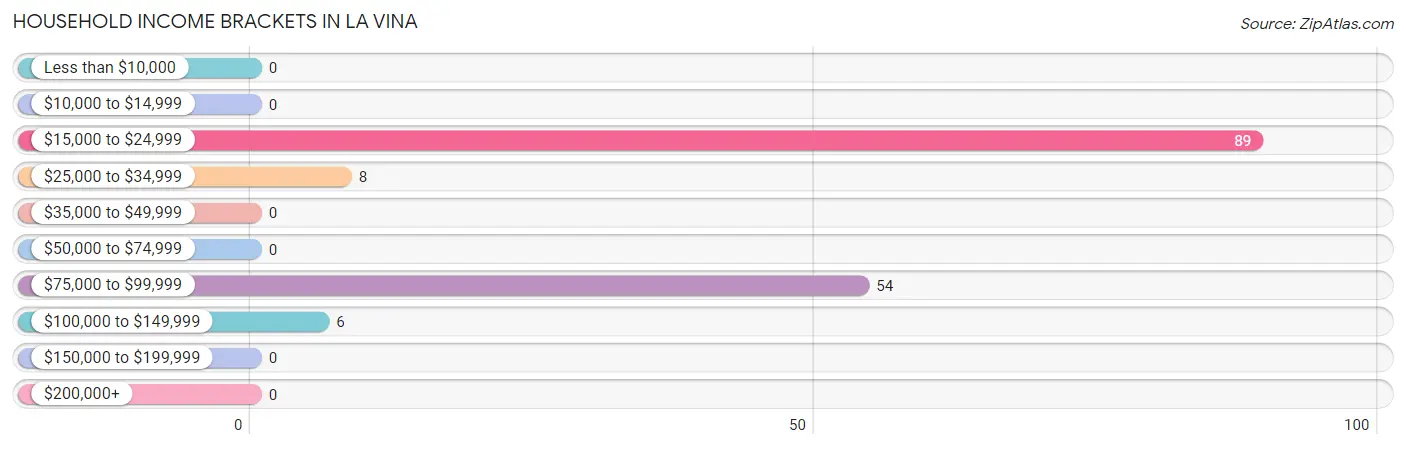
| Income Bracket | # Households | % Households |
| Less than $10,000 | 0 | 0.0% |
| $10,000 to $14,999 | 0 | 0.0% |
| $15,000 to $24,999 | 89 | 56.7% |
| $25,000 to $34,999 | 8 | 5.1% |
| $35,000 to $49,999 | 0 | 0.0% |
| $50,000 to $74,999 | 0 | 0.0% |
| $75,000 to $99,999 | 54 | 34.4% |
| $100,000 to $149,999 | 6 | 3.8% |
| $150,000 to $199,999 | 0 | 0.0% |
| $200,000+ | 0 | 0.0% |
Household Income by Householder Age in La Vina
The median household income in La Vina is $0, with the highest median household income of $88,650 found in the 45 to 64 years age bracket for the primary householder. A total of 39 households (24.8%) fall into this category.
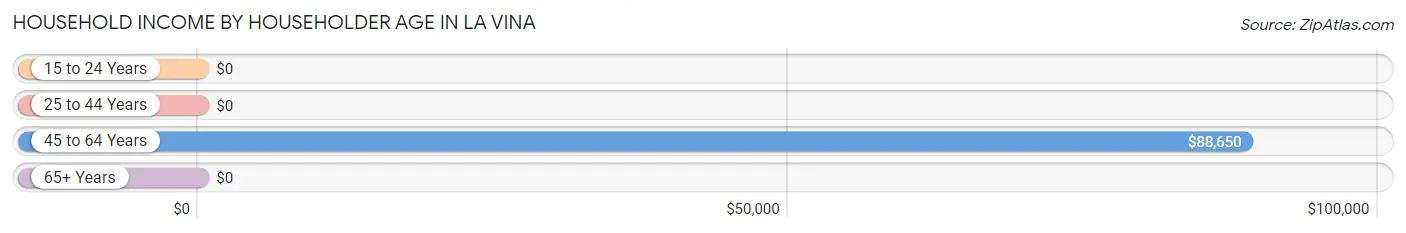
| Income Bracket | # Households | Median Income |
| 15 to 24 Years | 0 (0.0%) | $0 |
| 25 to 44 Years | 89 (56.7%) | $0 |
| 45 to 64 Years | 39 (24.8%) | $88,650 |
| 65+ Years | 29 (18.5%) | $0 |
| Total | 157 (100.0%) | $0 |
Poverty in La Vina
Income Below Poverty by Sex and Age in La Vina
With 62.3% poverty level for males and 40.6% for females among the residents of La Vina, 12 to 14 year old males and 25 to 34 year old females are the most vulnerable to poverty, with 88 males (100.0%) and 89 females (70.1%) in their respective age groups living below the poverty level.
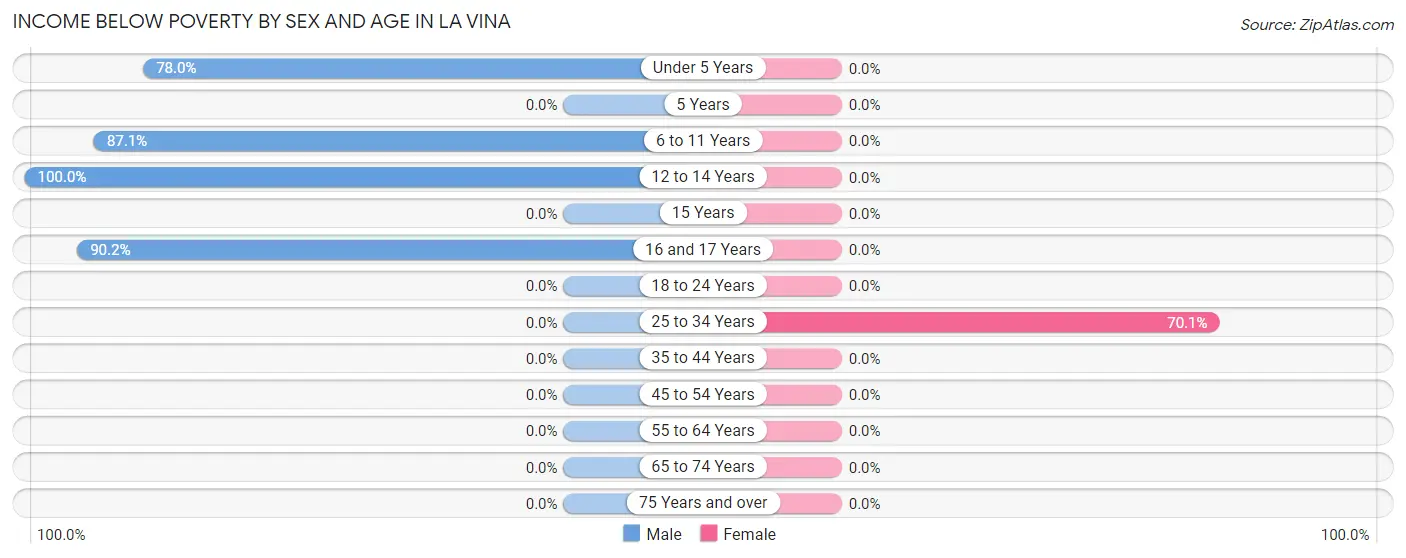
| Age Bracket | Male | Female |
| Under 5 Years | 85 (78.0%) | 0 (0.0%) |
| 5 Years | 0 (0.0%) | 0 (0.0%) |
| 6 to 11 Years | 176 (87.1%) | 0 (0.0%) |
| 12 to 14 Years | 88 (100.0%) | 0 (0.0%) |
| 15 Years | 0 (0.0%) | 0 (0.0%) |
| 16 and 17 Years | 83 (90.2%) | 0 (0.0%) |
| 18 to 24 Years | 0 (0.0%) | 0 (0.0%) |
| 25 to 34 Years | 0 (0.0%) | 89 (70.1%) |
| 35 to 44 Years | 0 (0.0%) | 0 (0.0%) |
| 45 to 54 Years | 0 (0.0%) | 0 (0.0%) |
| 55 to 64 Years | 0 (0.0%) | 0 (0.0%) |
| 65 to 74 Years | 0 (0.0%) | 0 (0.0%) |
| 75 Years and over | 0 (0.0%) | 0 (0.0%) |
| Total | 432 (62.3%) | 89 (40.6%) |
Income Above Poverty by Sex and Age in La Vina
According to the poverty statistics in La Vina, males aged 5 years and females aged 12 to 14 years are the age groups that are most secure financially, with 100.0% of males and 100.0% of females in these age groups living above the poverty line.
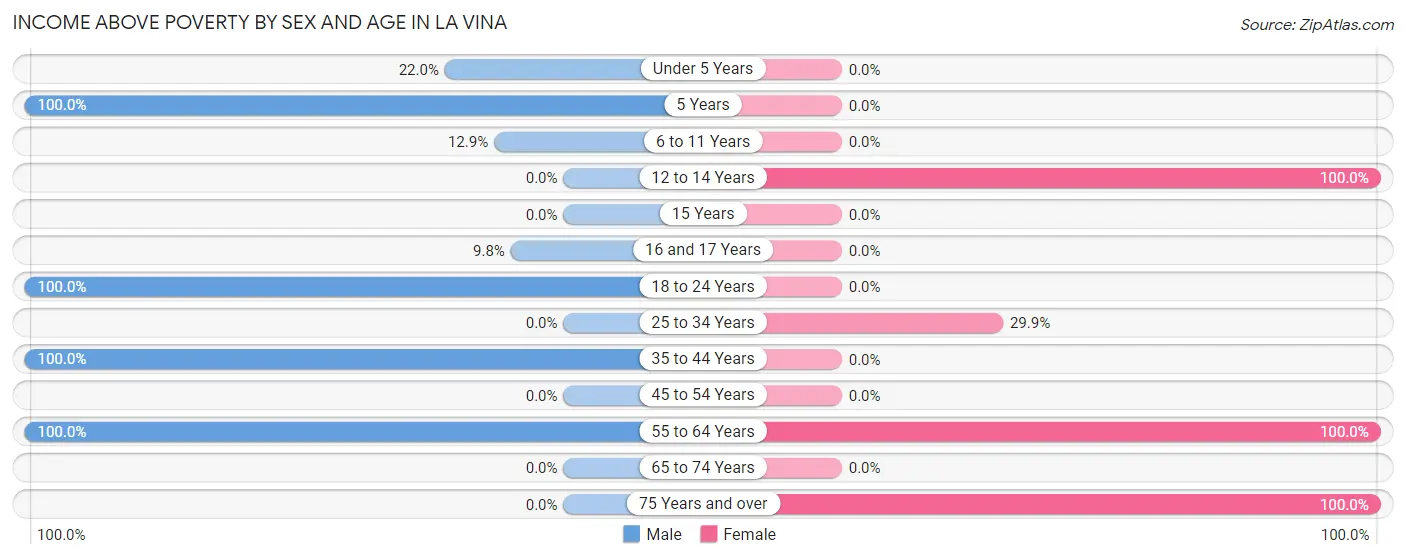
| Age Bracket | Male | Female |
| Under 5 Years | 24 (22.0%) | 0 (0.0%) |
| 5 Years | 26 (100.0%) | 0 (0.0%) |
| 6 to 11 Years | 26 (12.9%) | 0 (0.0%) |
| 12 to 14 Years | 0 (0.0%) | 28 (100.0%) |
| 15 Years | 0 (0.0%) | 0 (0.0%) |
| 16 and 17 Years | 9 (9.8%) | 0 (0.0%) |
| 18 to 24 Years | 3 (100.0%) | 0 (0.0%) |
| 25 to 34 Years | 0 (0.0%) | 38 (29.9%) |
| 35 to 44 Years | 88 (100.0%) | 0 (0.0%) |
| 45 to 54 Years | 0 (0.0%) | 0 (0.0%) |
| 55 to 64 Years | 85 (100.0%) | 35 (100.0%) |
| 65 to 74 Years | 0 (0.0%) | 0 (0.0%) |
| 75 Years and over | 0 (0.0%) | 29 (100.0%) |
| Total | 261 (37.7%) | 130 (59.4%) |
Income Below Poverty Among Married-Couple Families in La Vina
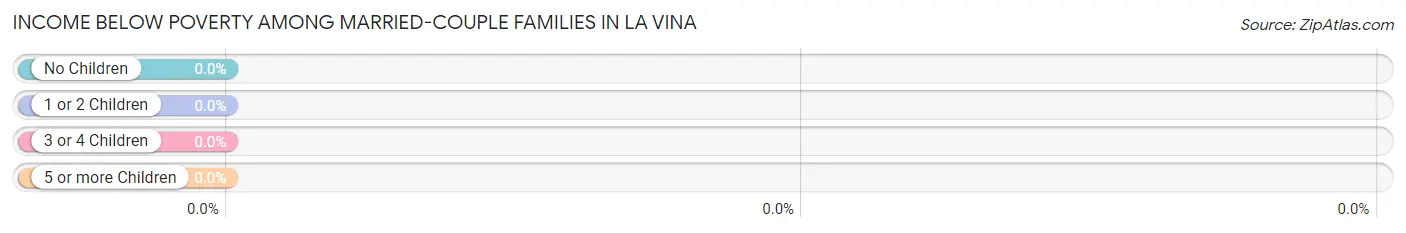
| Children | Above Poverty | Below Poverty |
| No Children | 6 (100.0%) | 0 (0.0%) |
| 1 or 2 Children | 8 (100.0%) | 0 (0.0%) |
| 3 or 4 Children | 25 (100.0%) | 0 (0.0%) |
| 5 or more Children | 0 (0.0%) | 0 (0.0%) |
| Total | 39 (100.0%) | 0 (0.0%) |
Income Below Poverty Among Single-Parent Households in La Vina
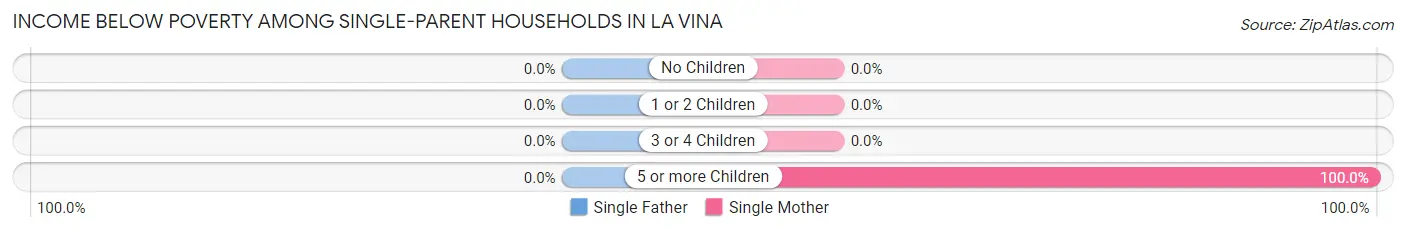
| Children | Single Father | Single Mother |
| No Children | 0 (0.0%) | 0 (0.0%) |
| 1 or 2 Children | 0 (0.0%) | 0 (0.0%) |
| 3 or 4 Children | 0 (0.0%) | 0 (0.0%) |
| 5 or more Children | 0 (0.0%) | 89 (100.0%) |
| Total | 0 (0.0%) | 89 (75.4%) |
Income Below Poverty Among Married-Couple vs Single-Parent Households in La Vina
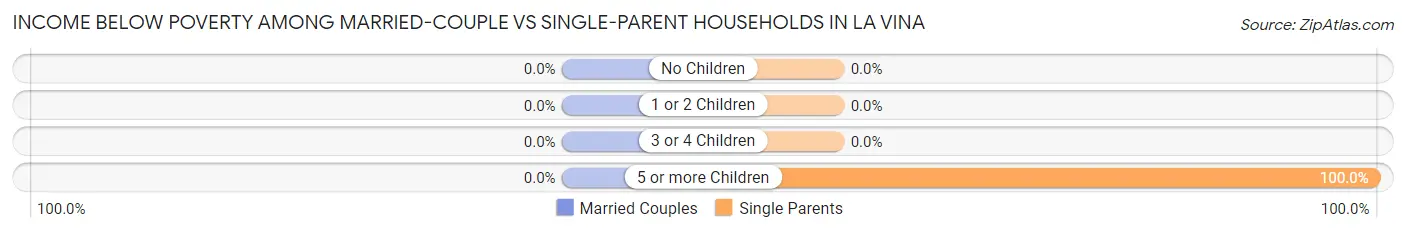
| Children | Married-Couple Families | Single-Parent Households |
| No Children | 0 (0.0%) | 0 (0.0%) |
| 1 or 2 Children | 0 (0.0%) | 0 (0.0%) |
| 3 or 4 Children | 0 (0.0%) | 0 (0.0%) |
| 5 or more Children | 0 (0.0%) | 89 (100.0%) |
| Total | 0 (0.0%) | 89 (75.4%) |
Race in La Vina
The most populous races in La Vina are Hispanic or Latino (912 | 100.0%), Two or more Races (521 | 57.1%), and Some other Race (367 | 40.2%).
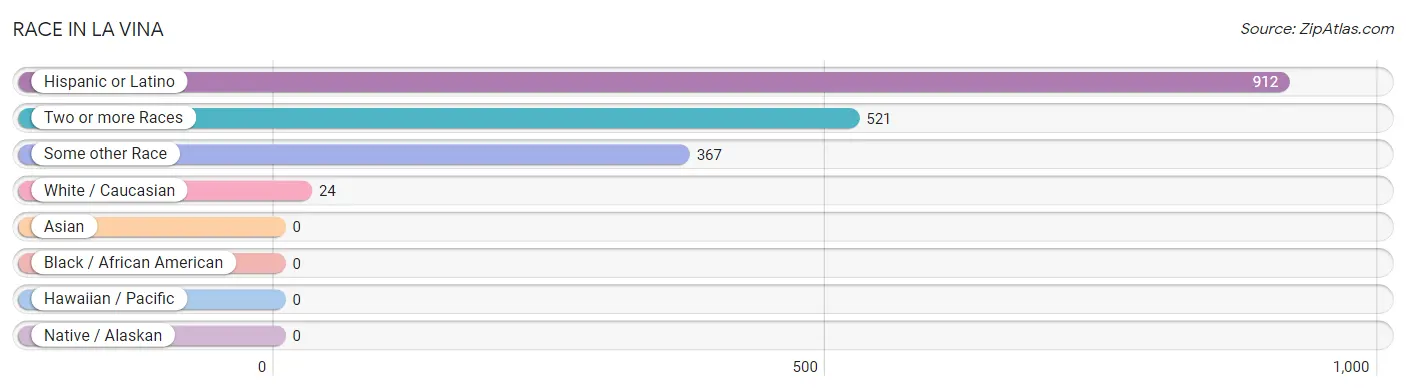
| Race | # Population | % Population |
| Asian | 0 | 0.0% |
| Black / African American | 0 | 0.0% |
| Hawaiian / Pacific | 0 | 0.0% |
| Hispanic or Latino | 912 | 100.0% |
| Native / Alaskan | 0 | 0.0% |
| White / Caucasian | 24 | 2.6% |
| Two or more Races | 521 | 57.1% |
| Some other Race | 367 | 40.2% |
| Total | 912 | 100.0% |
Ancestry in La Vina
The most populous ancestries reported in La Vina are , and Mexican (912 | 100.0%), together accounting for 100.0% of all La Vina residents.

| Ancestry | # Population | % Population |
| Mexican | 912 | 100.0% | View All 1 Rows |
Immigrants in La Vina
The most numerous immigrant groups reported in La Vina came from Central America (326 | 35.7%), Latin America (326 | 35.7%), and Mexico (326 | 35.7%), together accounting for 107.3% of all La Vina residents.
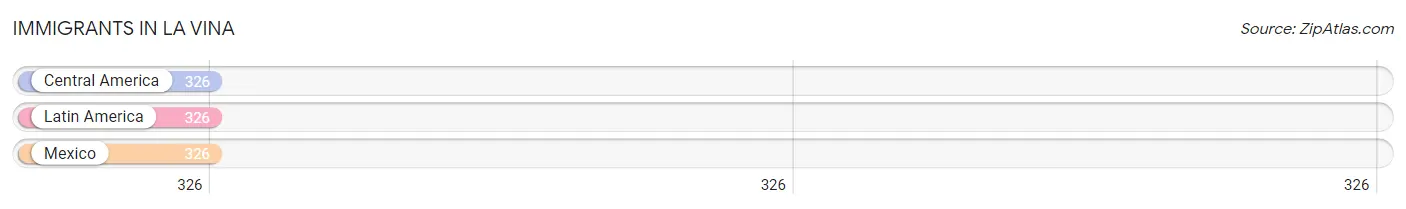
| Immigration Origin | # Population | % Population |
| Central America | 326 | 35.7% |
| Latin America | 326 | 35.7% |
| Mexico | 326 | 35.7% | View All 3 Rows |
Sex and Age in La Vina
Sex and Age in La Vina
The most populous age groups in La Vina are 5 to 9 Years (228 | 32.9%) for men and 30 to 34 Years (127 | 58.0%) for women.
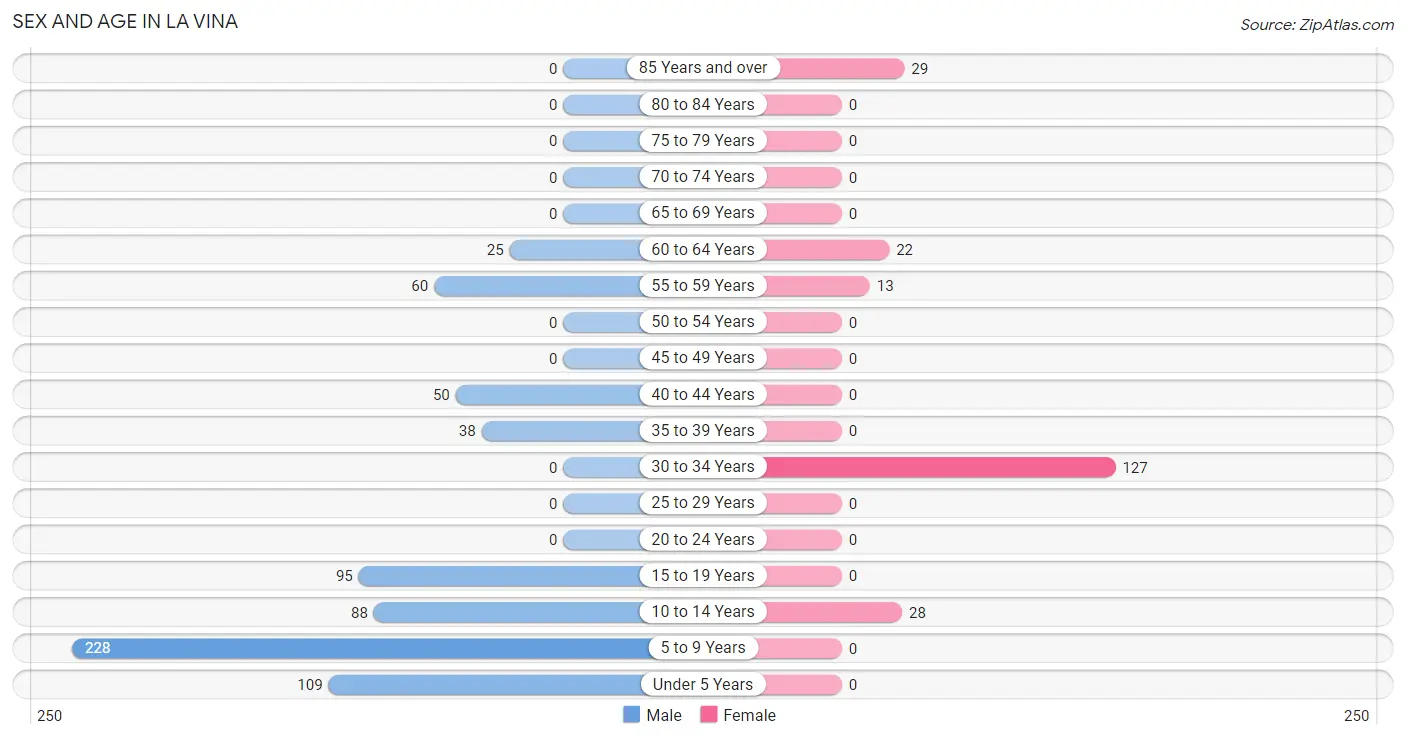
| Age Bracket | Male | Female |
| Under 5 Years | 109 (15.7%) | 0 (0.0%) |
| 5 to 9 Years | 228 (32.9%) | 0 (0.0%) |
| 10 to 14 Years | 88 (12.7%) | 28 (12.8%) |
| 15 to 19 Years | 95 (13.7%) | 0 (0.0%) |
| 20 to 24 Years | 0 (0.0%) | 0 (0.0%) |
| 25 to 29 Years | 0 (0.0%) | 0 (0.0%) |
| 30 to 34 Years | 0 (0.0%) | 127 (58.0%) |
| 35 to 39 Years | 38 (5.5%) | 0 (0.0%) |
| 40 to 44 Years | 50 (7.2%) | 0 (0.0%) |
| 45 to 49 Years | 0 (0.0%) | 0 (0.0%) |
| 50 to 54 Years | 0 (0.0%) | 0 (0.0%) |
| 55 to 59 Years | 60 (8.7%) | 13 (5.9%) |
| 60 to 64 Years | 25 (3.6%) | 22 (10.1%) |
| 65 to 69 Years | 0 (0.0%) | 0 (0.0%) |
| 70 to 74 Years | 0 (0.0%) | 0 (0.0%) |
| 75 to 79 Years | 0 (0.0%) | 0 (0.0%) |
| 80 to 84 Years | 0 (0.0%) | 0 (0.0%) |
| 85 Years and over | 0 (0.0%) | 29 (13.2%) |
| Total | 693 (100.0%) | 219 (100.0%) |
Families and Households in La Vina
Median Family Size in La Vina
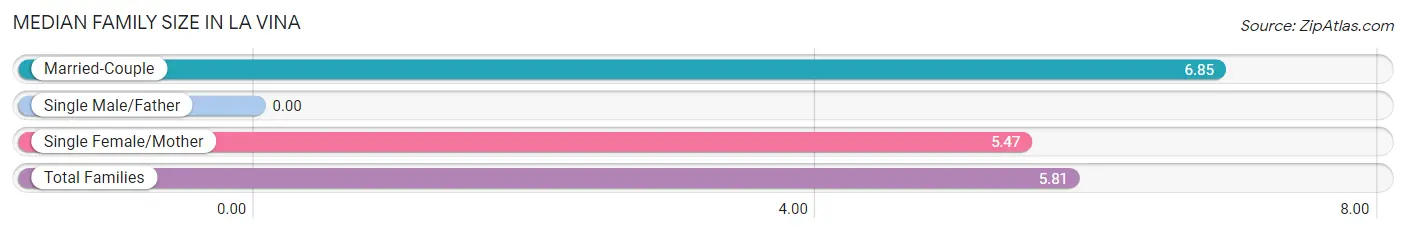
| Family Type | # Families | Family Size |
| Married-Couple | 39 (24.8%) | 6.85 |
| Single Male/Father | 0 (0.0%) | - |
| Single Female/Mother | 118 (75.2%) | 5.47 |
| Total Families | 157 (100.0%) | 5.81 |
Median Household Size in La Vina
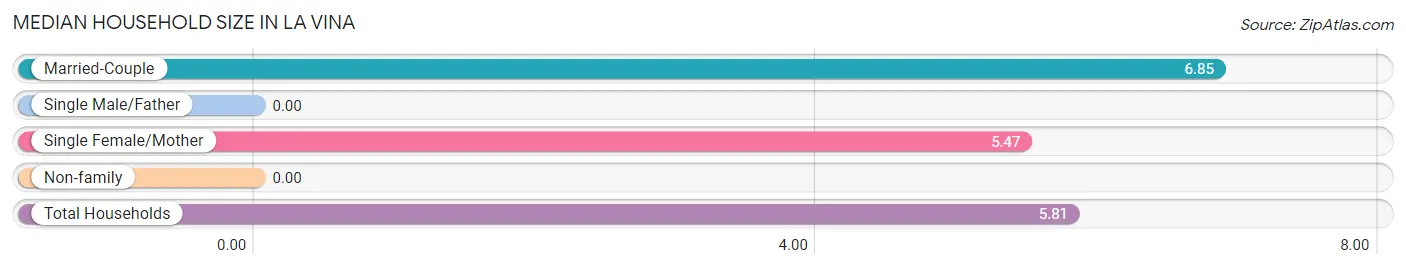
| Household Type | # Households | Household Size |
| Married-Couple | 39 (24.8%) | 6.85 |
| Single Male/Father | 0 (0.0%) | - |
| Single Female/Mother | 118 (75.2%) | 5.47 |
| Non-family | 0 (0.0%) | - |
| Total Households | 157 (100.0%) | 5.81 |
Household Size by Marriage Status in La Vina
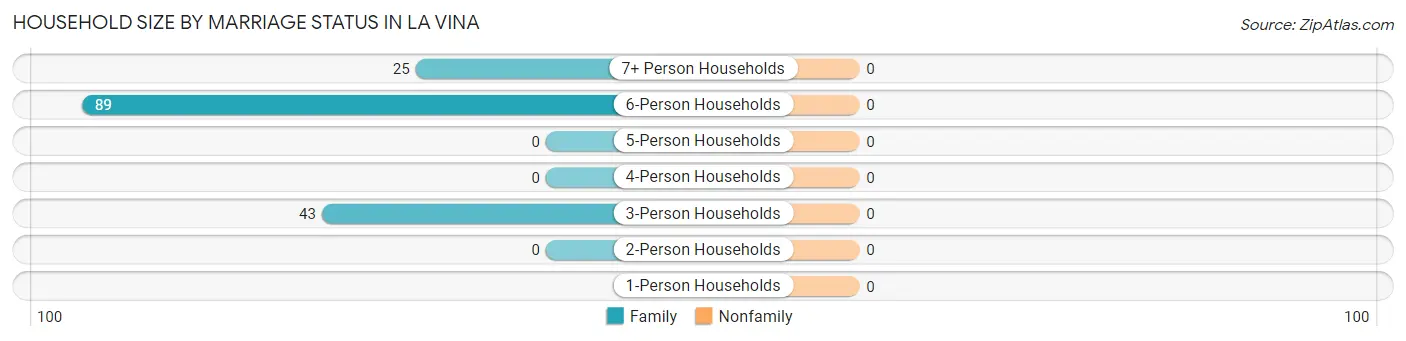
| Household Size | Family Households | Nonfamily Households |
| 1-Person Households | - | 0 (0.0%) |
| 2-Person Households | 0 (0.0%) | 0 (0.0%) |
| 3-Person Households | 43 (27.4%) | 0 (0.0%) |
| 4-Person Households | 0 (0.0%) | 0 (0.0%) |
| 5-Person Households | 0 (0.0%) | 0 (0.0%) |
| 6-Person Households | 89 (56.7%) | 0 (0.0%) |
| 7+ Person Households | 25 (15.9%) | 0 (0.0%) |
| Total | 157 (100.0%) | 0 (0.0%) |
Female Fertility in La Vina
Fertility by Age in La Vina
| Age Bracket | Women with Births | Births / 1,000 Women |
| 15 to 19 years | 0 (0.0%) | 0.0 |
| 20 to 34 years | 0 (0.0%) | 0.0 |
| 35 to 50 years | 0 (0.0%) | 0.0 |
| Total | 0 (0.0%) | 0.0 |
Fertility by Age by Marriage Status in La Vina
| Age Bracket | Married | Unmarried |
| 15 to 19 years | 0 (0.0%) | 0 (0.0%) |
| 20 to 34 years | 0 (0.0%) | 0 (0.0%) |
| 35 to 50 years | 0 (0.0%) | 0 (0.0%) |
| Total | 0 (0.0%) | 0 (0.0%) |
Fertility by Education in La Vina
| Educational Attainment | Women with Births | Births / 1,000 Women |
| Less than High School | 0 (0.0%) | 0.0 |
| High School Diploma | 0 (0.0%) | 0.0 |
| College or Associate's Degree | 0 (0.0%) | 0.0 |
| Bachelor's Degree | 0 (0.0%) | 0.0 |
| Graduate Degree | 0 (0.0%) | 0.0 |
| Total | 0 (0.0%) | 0.0 |
Fertility by Education by Marriage Status in La Vina
| Educational Attainment | Married | Unmarried |
| Less than High School | 0 (0.0%) | 0 (0.0%) |
| High School Diploma | 0 (0.0%) | 0 (0.0%) |
| College or Associate's Degree | 0 (0.0%) | 0 (0.0%) |
| Bachelor's Degree | 0 (0.0%) | 0 (0.0%) |
| Graduate Degree | 0 (0.0%) | 0 (0.0%) |
| Total | 0 (0.0%) | 0 (0.0%) |
Employment Characteristics in La Vina
Employment by Class of Employer in La Vina
Among the 154 employed individuals in La Vina, , and private company employees (154 | 100.0%) make up the most common classes of employment.
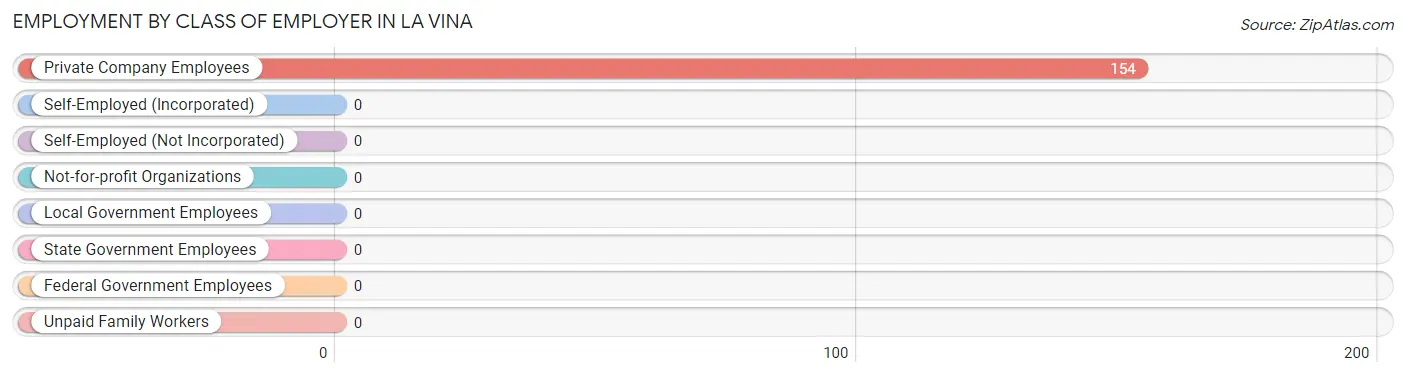
| Employer Class | # Employees | % Employees |
| Private Company Employees | 154 | 100.0% |
| Self-Employed (Incorporated) | 0 | 0.0% |
| Self-Employed (Not Incorporated) | 0 | 0.0% |
| Not-for-profit Organizations | 0 | 0.0% |
| Local Government Employees | 0 | 0.0% |
| State Government Employees | 0 | 0.0% |
| Federal Government Employees | 0 | 0.0% |
| Unpaid Family Workers | 0 | 0.0% |
| Total | 154 | 100.0% |
Employment Status by Age in La Vina
According to the labor force statistics for La Vina, out of the total population over 16 years of age (459), 60.6% or 278 individuals are in the labor force, with 28.4% or 79 of them unemployed. The age group with the highest labor force participation rate is 35 to 44 years, with 100.0% or 88 individuals in the labor force. Within the labor force, the 16 to 19 years age range has the highest percentage of unemployed individuals, with 100.0% or 3 of them being unemployed.
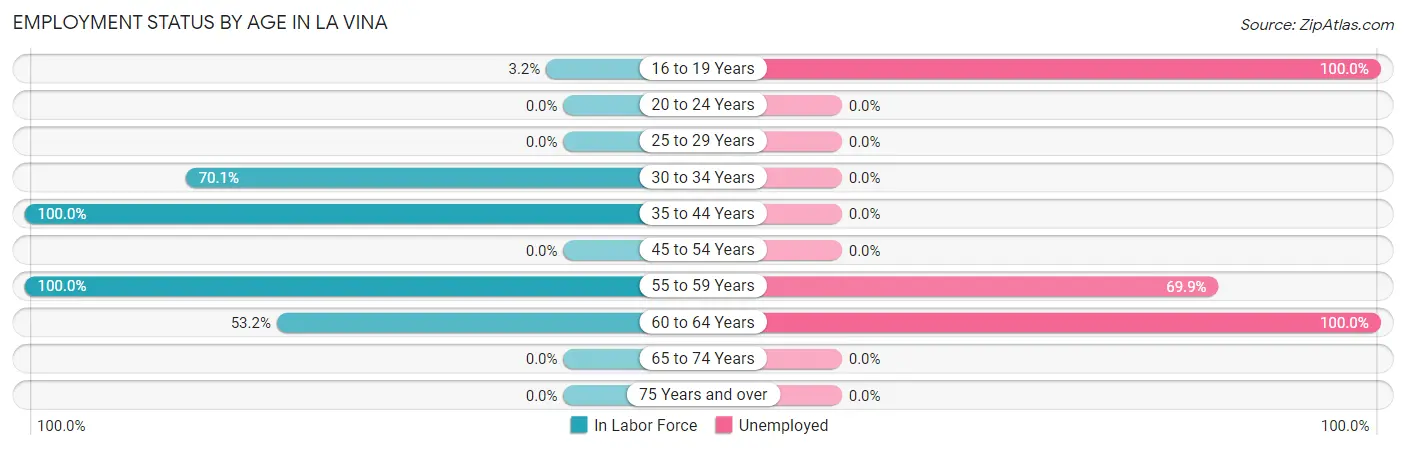
| Age Bracket | In Labor Force | Unemployed |
| 16 to 19 Years | 3 (3.2%) | 3 (100.0%) |
| 20 to 24 Years | 0 (0.0%) | 0 (0.0%) |
| 25 to 29 Years | 0 (0.0%) | 0 (0.0%) |
| 30 to 34 Years | 89 (70.1%) | 0 (0.0%) |
| 35 to 44 Years | 88 (100.0%) | 0 (0.0%) |
| 45 to 54 Years | 0 (0.0%) | 0 (0.0%) |
| 55 to 59 Years | 73 (100.0%) | 51 (69.9%) |
| 60 to 64 Years | 25 (53.2%) | 25 (100.0%) |
| 65 to 74 Years | 0 (0.0%) | 0 (0.0%) |
| 75 Years and over | 0 (0.0%) | 0 (0.0%) |
| Total | 278 (60.6%) | 79 (28.4%) |
Employment Status by Educational Attainment in La Vina
According to labor force statistics for La Vina, 82.1% of individuals (275) out of the total population between 25 and 64 years of age (335) are in the labor force, with 27.6% or 76 of them being unemployed. The group with the highest labor force participation rate are those with the educational attainment of high school diploma, with 100.0% or 177 individuals in the labor force. Within the labor force, individuals with college / associate degree education have the highest percentage of unemployment, with 100.0% or 25 of them being unemployed.
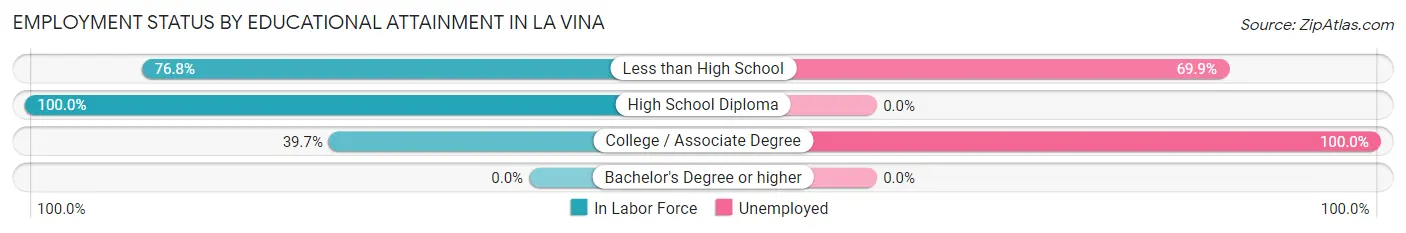
| Educational Attainment | In Labor Force | Unemployed |
| Less than High School | 73 (76.8%) | 66 (69.9%) |
| High School Diploma | 177 (100.0%) | 0 (0.0%) |
| College / Associate Degree | 25 (39.7%) | 63 (100.0%) |
| Bachelor's Degree or higher | 0 (0.0%) | 0 (0.0%) |
| Total | 275 (82.1%) | 92 (27.6%) |
Employment Occupations by Sex in La Vina
Management, Business, Science and Arts Occupations
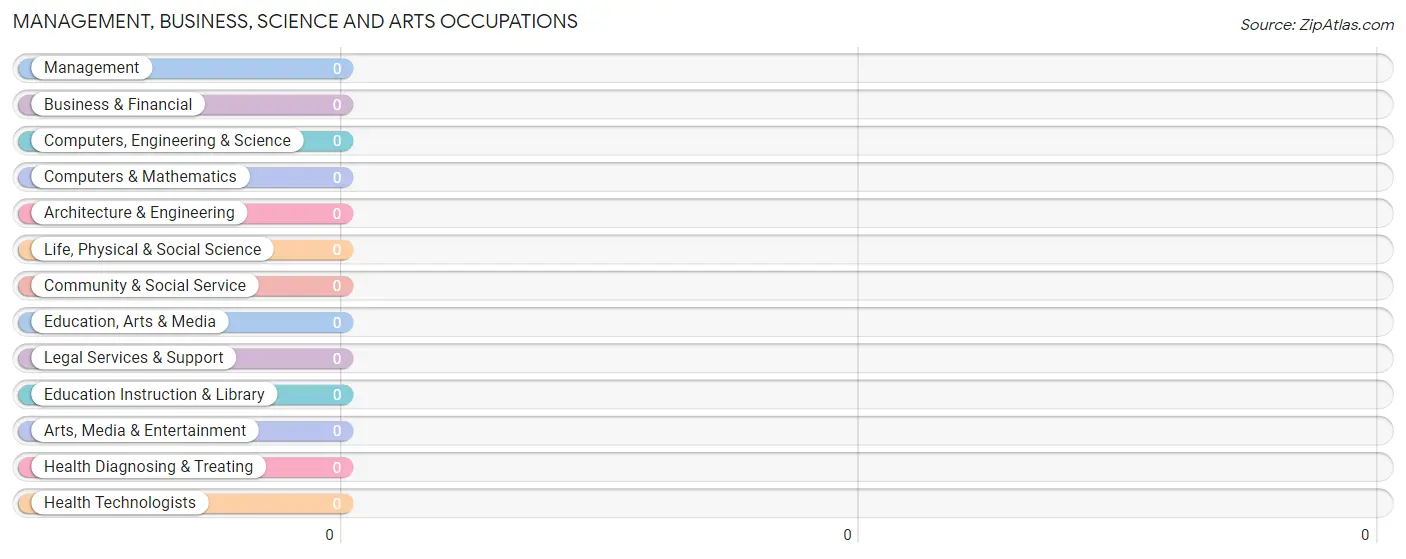
Management, Business, Science and Arts Occupations by Sex
| Occupation | Male | Female |
| Management | 0 (0.0%) | 0 (0.0%) |
| Business & Financial | 0 (0.0%) | 0 (0.0%) |
| Computers, Engineering & Science | 0 (0.0%) | 0 (0.0%) |
| Computers & Mathematics | 0 (0.0%) | 0 (0.0%) |
| Architecture & Engineering | 0 (0.0%) | 0 (0.0%) |
| Life, Physical & Social Science | 0 (0.0%) | 0 (0.0%) |
| Community & Social Service | 0 (0.0%) | 0 (0.0%) |
| Education, Arts & Media | 0 (0.0%) | 0 (0.0%) |
| Legal Services & Support | 0 (0.0%) | 0 (0.0%) |
| Education Instruction & Library | 0 (0.0%) | 0 (0.0%) |
| Arts, Media & Entertainment | 0 (0.0%) | 0 (0.0%) |
| Health Diagnosing & Treating | 0 (0.0%) | 0 (0.0%) |
| Health Technologists | 0 (0.0%) | 0 (0.0%) |
| Total (Category) | 0 (0.0%) | 0 (0.0%) |
| Total (Overall) | 103 (51.8%) | 96 (48.2%) |
Services Occupations
The most common Services occupations in La Vina are , and Healthcare Support (89 | 44.7%).
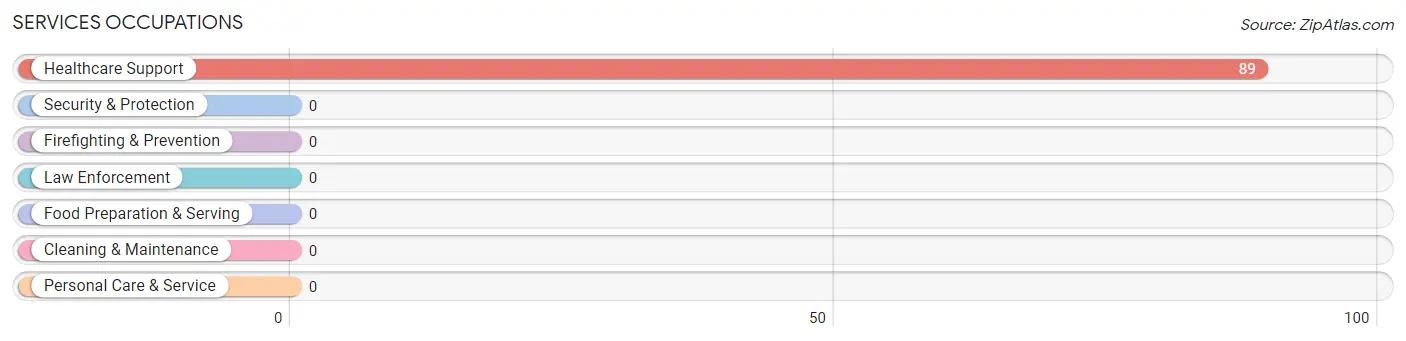
Services Occupations by Sex
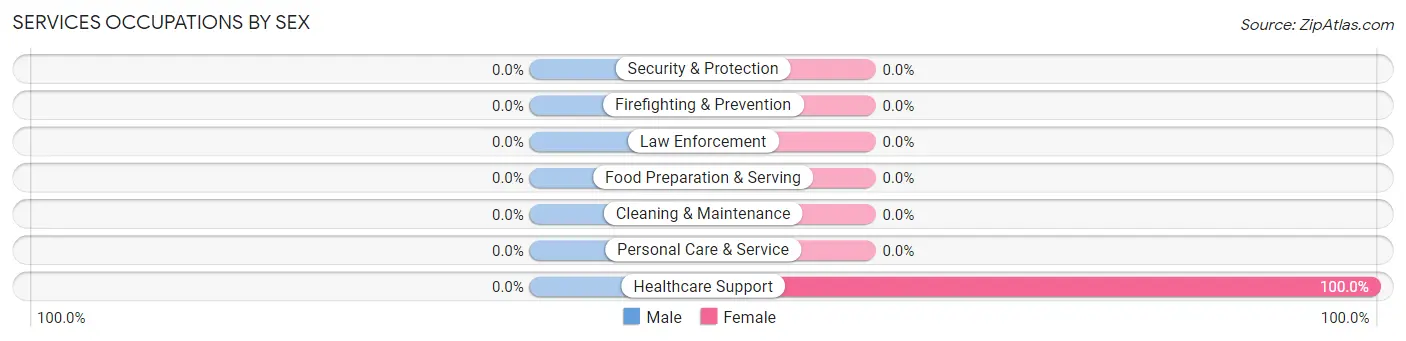
| Occupation | Male | Female |
| Healthcare Support | 0 (0.0%) | 89 (100.0%) |
| Security & Protection | 0 (0.0%) | 0 (0.0%) |
| Firefighting & Prevention | 0 (0.0%) | 0 (0.0%) |
| Law Enforcement | 0 (0.0%) | 0 (0.0%) |
| Food Preparation & Serving | 0 (0.0%) | 0 (0.0%) |
| Cleaning & Maintenance | 0 (0.0%) | 0 (0.0%) |
| Personal Care & Service | 0 (0.0%) | 0 (0.0%) |
| Total (Category) | 0 (0.0%) | 89 (100.0%) |
| Total (Overall) | 103 (51.8%) | 96 (48.2%) |
Sales and Office Occupations
The most common Sales and Office occupations in La Vina are , and Office & Administration (50 | 25.1%).
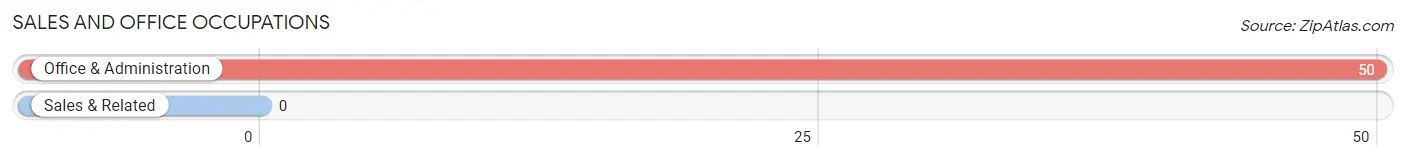
Sales and Office Occupations by Sex
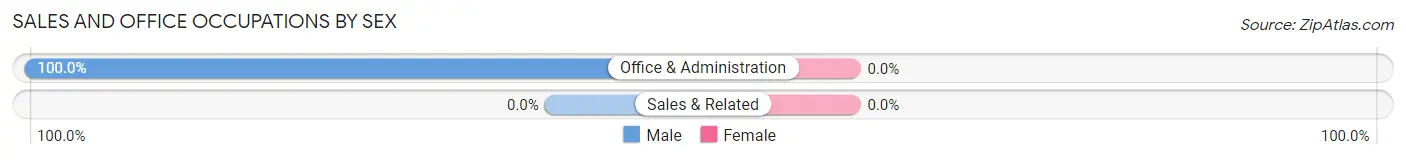
| Occupation | Male | Female |
| Sales & Related | 0 (0.0%) | 0 (0.0%) |
| Office & Administration | 50 (100.0%) | 0 (0.0%) |
| Total (Category) | 50 (100.0%) | 0 (0.0%) |
| Total (Overall) | 103 (51.8%) | 96 (48.2%) |
Natural Resources, Construction and Maintenance Occupations
The most common Natural Resources, Construction and Maintenance occupations in La Vina are Construction & Extraction (38 | 19.1%), and Farming, Fishing & Forestry (22 | 11.1%).
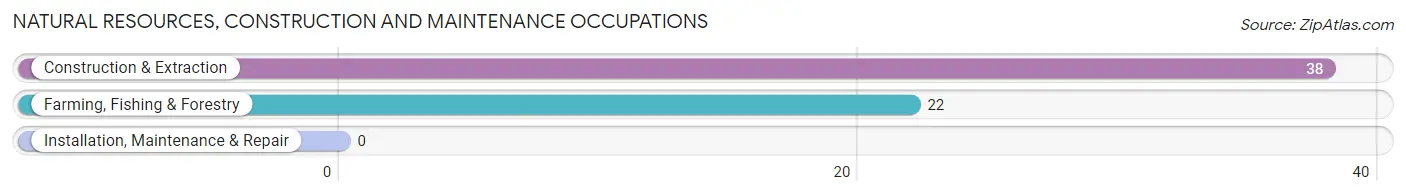
Natural Resources, Construction and Maintenance Occupations by Sex
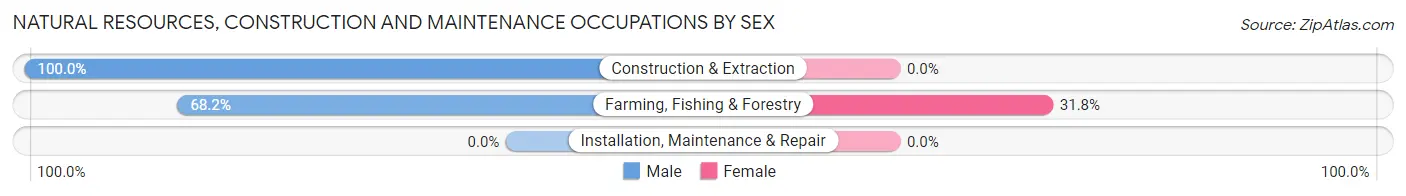
| Occupation | Male | Female |
| Farming, Fishing & Forestry | 15 (68.2%) | 7 (31.8%) |
| Construction & Extraction | 38 (100.0%) | 0 (0.0%) |
| Installation, Maintenance & Repair | 0 (0.0%) | 0 (0.0%) |
| Total (Category) | 53 (88.3%) | 7 (11.7%) |
| Total (Overall) | 103 (51.8%) | 96 (48.2%) |
Production, Transportation and Moving Occupations
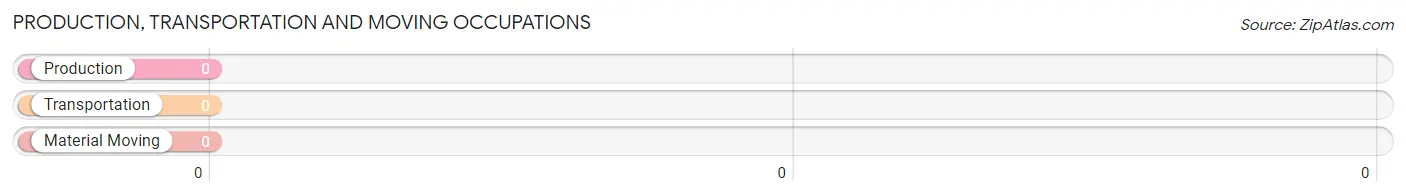
Production, Transportation and Moving Occupations by Sex
| Occupation | Male | Female |
| Production | 0 (0.0%) | 0 (0.0%) |
| Transportation | 0 (0.0%) | 0 (0.0%) |
| Material Moving | 0 (0.0%) | 0 (0.0%) |
| Total (Category) | 0 (0.0%) | 0 (0.0%) |
| Total (Overall) | 103 (51.8%) | 96 (48.2%) |
Employment Industries by Sex in La Vina
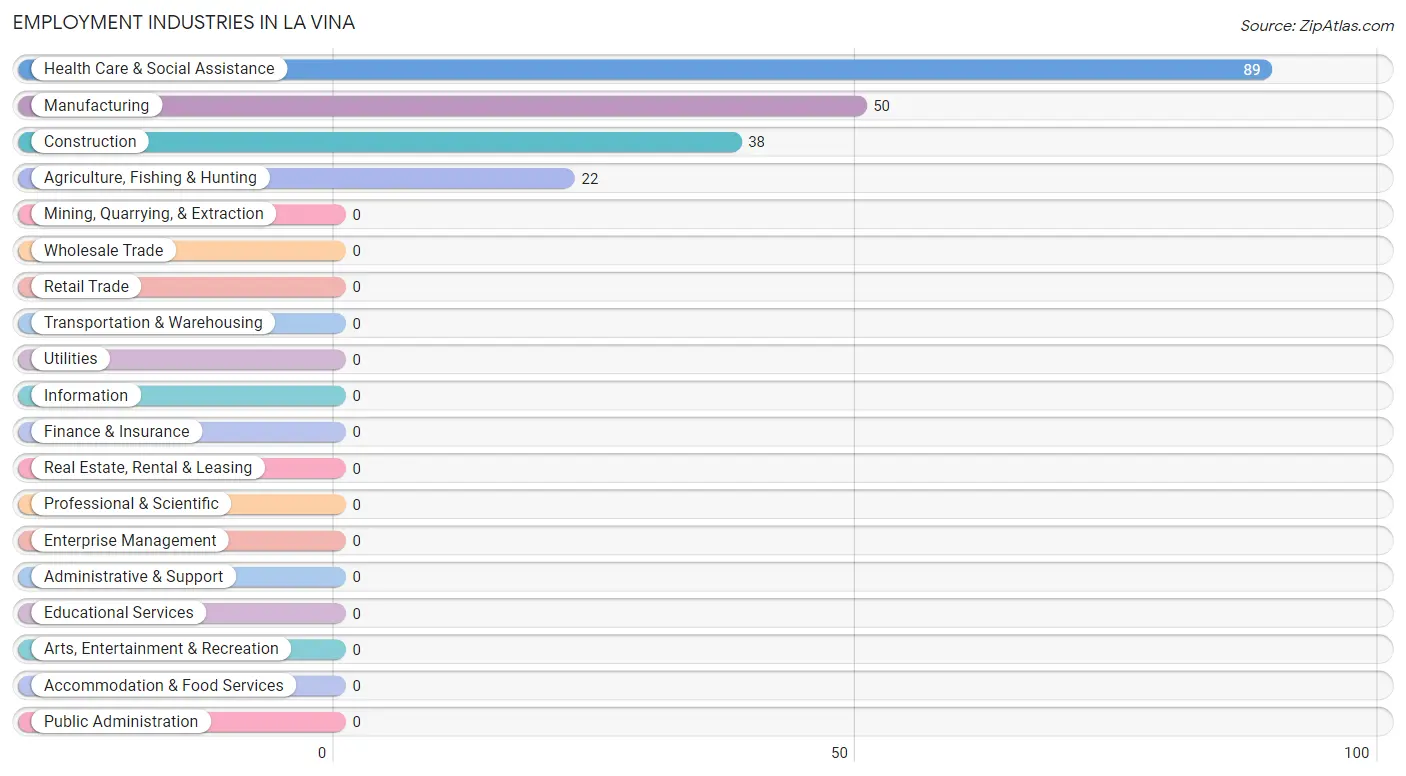
Employment Industries in La Vina
The major employment industries in La Vina include Health Care & Social Assistance (89 | 44.7%), Manufacturing (50 | 25.1%), Construction (38 | 19.1%), and Agriculture, Fishing & Hunting (22 | 11.1%).
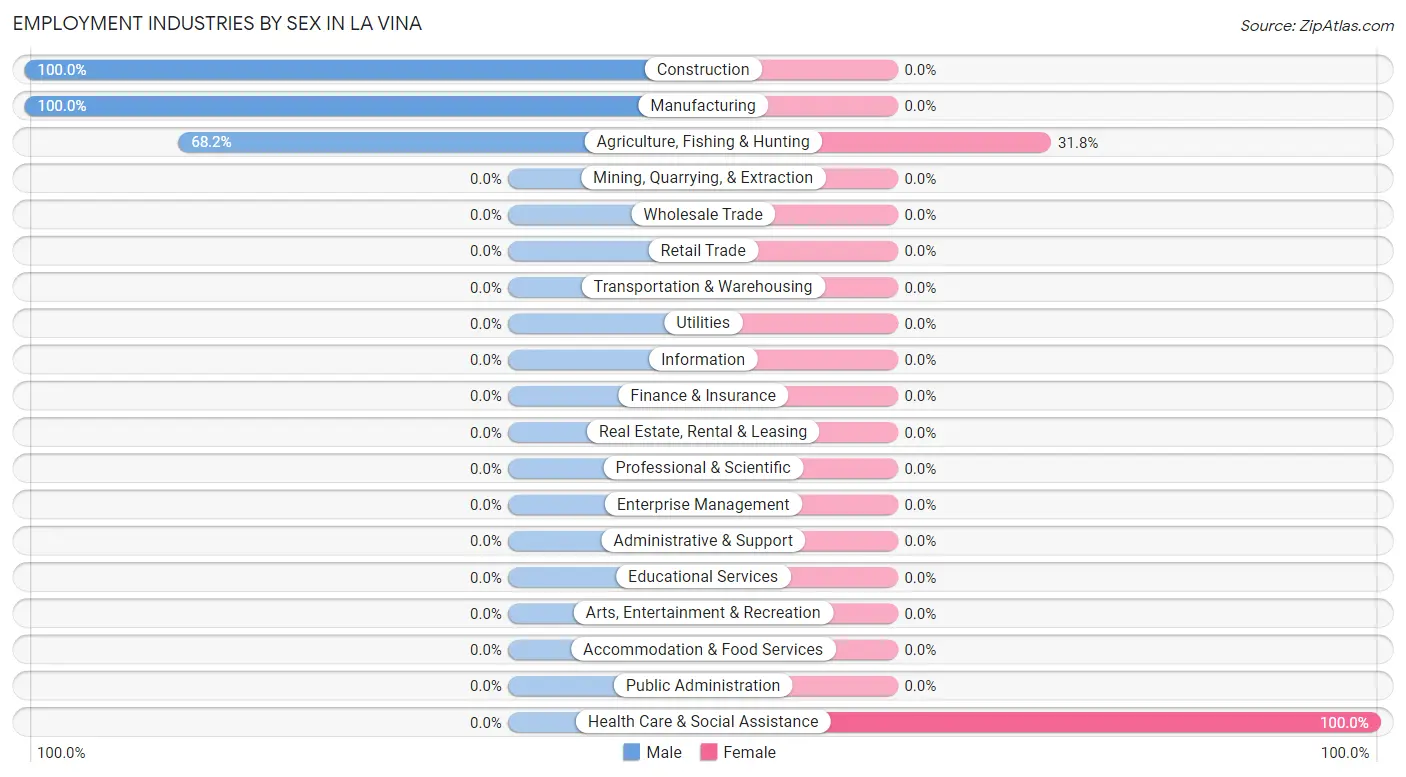
Employment Industries by Sex in La Vina
The La Vina industries that see more men than women are Construction (100.0%), Manufacturing (100.0%), and Agriculture, Fishing & Hunting (68.2%), whereas the industries that tend to have a higher number of women are Health Care & Social Assistance (100.0%), and Agriculture, Fishing & Hunting (31.8%).
| Industry | Male | Female |
| Agriculture, Fishing & Hunting | 15 (68.2%) | 7 (31.8%) |
| Mining, Quarrying, & Extraction | 0 (0.0%) | 0 (0.0%) |
| Construction | 38 (100.0%) | 0 (0.0%) |
| Manufacturing | 50 (100.0%) | 0 (0.0%) |
| Wholesale Trade | 0 (0.0%) | 0 (0.0%) |
| Retail Trade | 0 (0.0%) | 0 (0.0%) |
| Transportation & Warehousing | 0 (0.0%) | 0 (0.0%) |
| Utilities | 0 (0.0%) | 0 (0.0%) |
| Information | 0 (0.0%) | 0 (0.0%) |
| Finance & Insurance | 0 (0.0%) | 0 (0.0%) |
| Real Estate, Rental & Leasing | 0 (0.0%) | 0 (0.0%) |
| Professional & Scientific | 0 (0.0%) | 0 (0.0%) |
| Enterprise Management | 0 (0.0%) | 0 (0.0%) |
| Administrative & Support | 0 (0.0%) | 0 (0.0%) |
| Educational Services | 0 (0.0%) | 0 (0.0%) |
| Health Care & Social Assistance | 0 (0.0%) | 89 (100.0%) |
| Arts, Entertainment & Recreation | 0 (0.0%) | 0 (0.0%) |
| Accommodation & Food Services | 0 (0.0%) | 0 (0.0%) |
| Public Administration | 0 (0.0%) | 0 (0.0%) |
| Total | 103 (51.8%) | 96 (48.2%) |
Education in La Vina
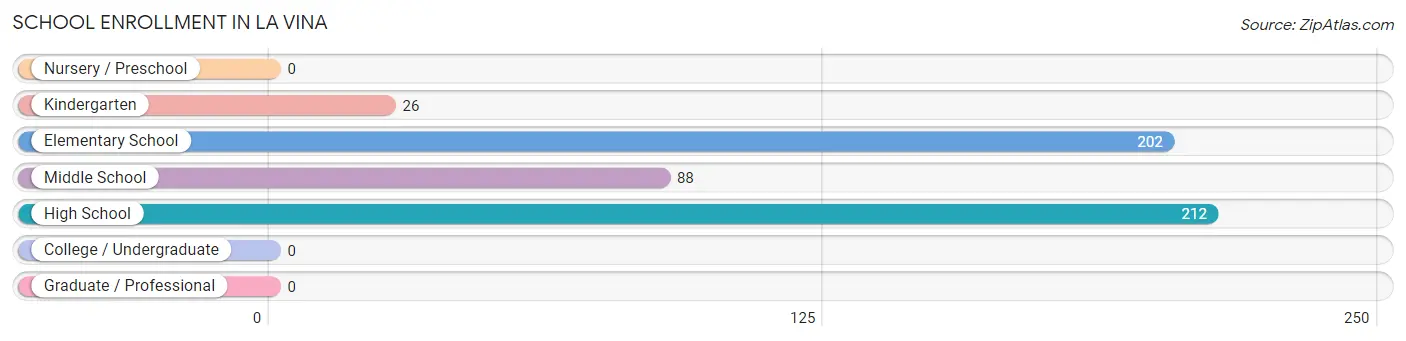
School Enrollment in La Vina
The most common levels of schooling among the 528 students in La Vina are high school (212 | 40.2%), elementary school (202 | 38.3%), and middle school (88 | 16.7%).
| School Level | # Students | % Students |
| Nursery / Preschool | 0 | 0.0% |
| Kindergarten | 26 | 4.9% |
| Elementary School | 202 | 38.3% |
| Middle School | 88 | 16.7% |
| High School | 212 | 40.2% |
| College / Undergraduate | 0 | 0.0% |
| Graduate / Professional | 0 | 0.0% |
| Total | 528 | 100.0% |
School Enrollment by Age by Funding Source in La Vina
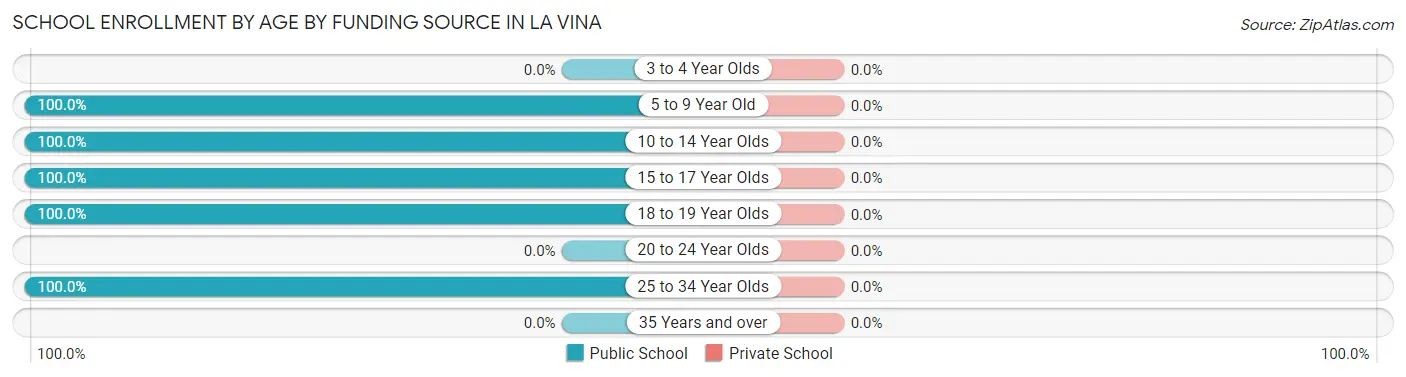
| Age Bracket | Public School | Private School |
| 3 to 4 Year Olds | 0 (0.0%) | 0 (0.0%) |
| 5 to 9 Year Old | 228 (100.0%) | 0 (0.0%) |
| 10 to 14 Year Olds | 116 (100.0%) | 0 (0.0%) |
| 15 to 17 Year Olds | 92 (100.0%) | 0 (0.0%) |
| 18 to 19 Year Olds | 3 (100.0%) | 0 (0.0%) |
| 20 to 24 Year Olds | 0 (0.0%) | 0 (0.0%) |
| 25 to 34 Year Olds | 89 (100.0%) | 0 (0.0%) |
| 35 Years and over | 0 (0.0%) | 0 (0.0%) |
| Total | 528 (100.0%) | 0 (0.0%) |
Educational Attainment by Field of Study in La Vina
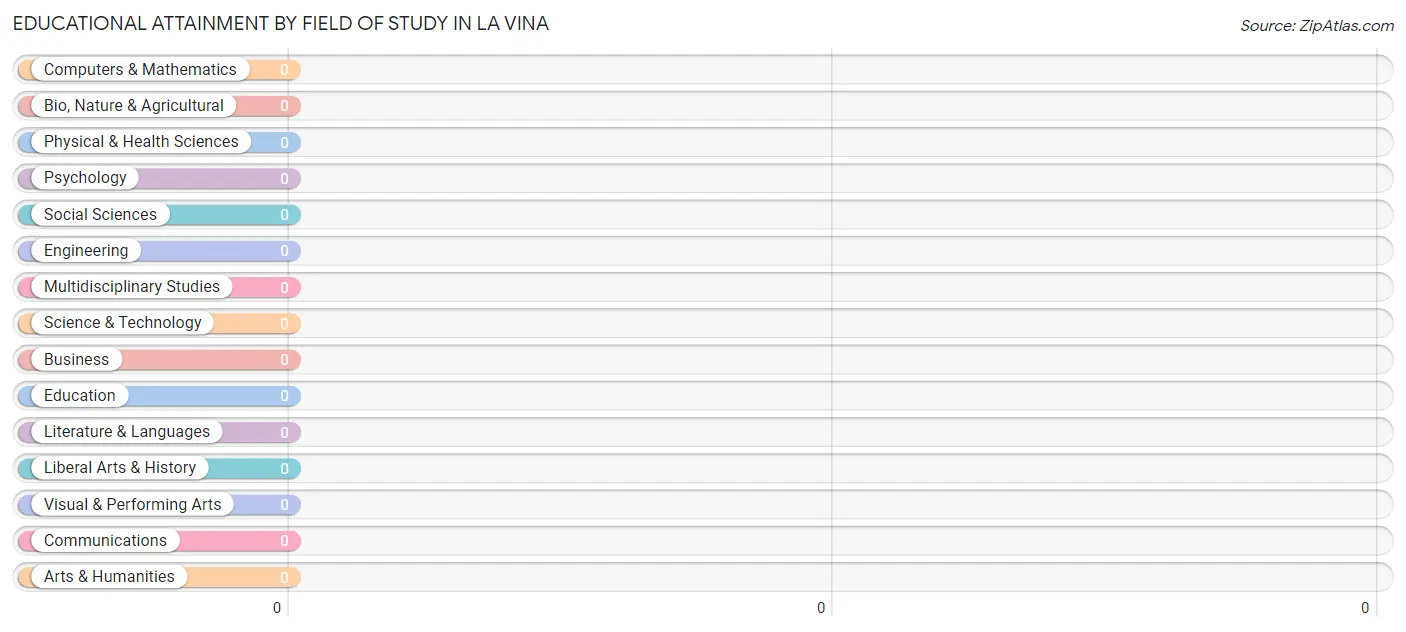
| Field of Study | # Graduates | % Graduates |
| Computers & Mathematics | 0 | 0.0% |
| Bio, Nature & Agricultural | 0 | 0.0% |
| Physical & Health Sciences | 0 | 0.0% |
| Psychology | 0 | 0.0% |
| Social Sciences | 0 | 0.0% |
| Engineering | 0 | 0.0% |
| Multidisciplinary Studies | 0 | 0.0% |
| Science & Technology | 0 | 0.0% |
| Business | 0 | 0.0% |
| Education | 0 | 0.0% |
| Literature & Languages | 0 | 0.0% |
| Liberal Arts & History | 0 | 0.0% |
| Visual & Performing Arts | 0 | 0.0% |
| Communications | 0 | 0.0% |
| Arts & Humanities | 0 | 0.0% |
| Total | 0 | 0.0% |
Transportation & Commute in La Vina
Vehicle Availability by Sex in La Vina
The most prevalent vehicle ownership categories in La Vina are males with 5 or more vehicles (50, accounting for 86.2%) and females with 5 or more vehicles (0, making up 52.1%).
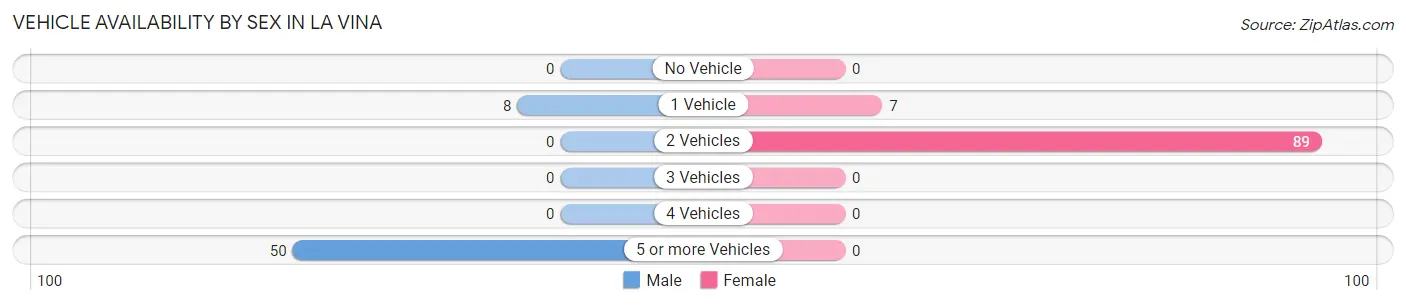
| Vehicles Available | Male | Female |
| No Vehicle | 0 (0.0%) | 0 (0.0%) |
| 1 Vehicle | 8 (13.8%) | 7 (7.3%) |
| 2 Vehicles | 0 (0.0%) | 89 (92.7%) |
| 3 Vehicles | 0 (0.0%) | 0 (0.0%) |
| 4 Vehicles | 0 (0.0%) | 0 (0.0%) |
| 5 or more Vehicles | 50 (86.2%) | 0 (0.0%) |
| Total | 58 (100.0%) | 96 (100.0%) |
Commute Time in La Vina
The most frequently occuring commute durations in La Vina are 30 to 34 minutes (139 commuters, 90.3%), 15 to 19 minutes (8 commuters, 5.2%), and 10 to 14 minutes (7 commuters, 4.5%).
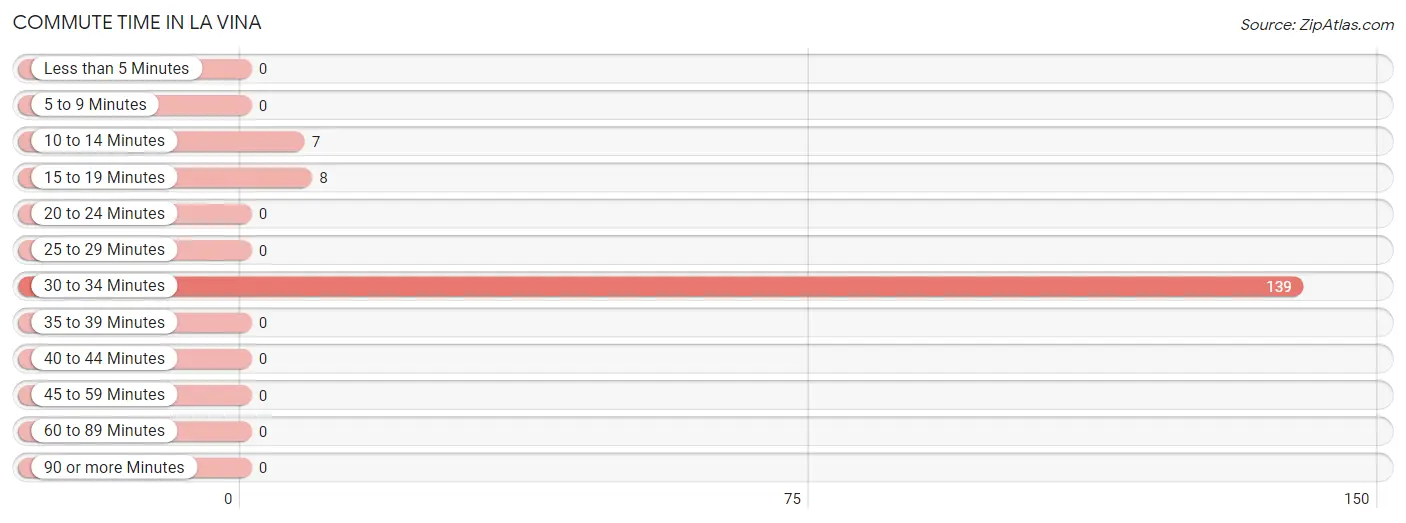
| Commute Time | # Commuters | % Commuters |
| Less than 5 Minutes | 0 | 0.0% |
| 5 to 9 Minutes | 0 | 0.0% |
| 10 to 14 Minutes | 7 | 4.5% |
| 15 to 19 Minutes | 8 | 5.2% |
| 20 to 24 Minutes | 0 | 0.0% |
| 25 to 29 Minutes | 0 | 0.0% |
| 30 to 34 Minutes | 139 | 90.3% |
| 35 to 39 Minutes | 0 | 0.0% |
| 40 to 44 Minutes | 0 | 0.0% |
| 45 to 59 Minutes | 0 | 0.0% |
| 60 to 89 Minutes | 0 | 0.0% |
| 90 or more Minutes | 0 | 0.0% |
Commute Time by Sex in La Vina
The most common commute times in La Vina are 30 to 34 minutes (50 commuters, 86.2%) for males and 30 to 34 minutes (89 commuters, 92.7%) for females.
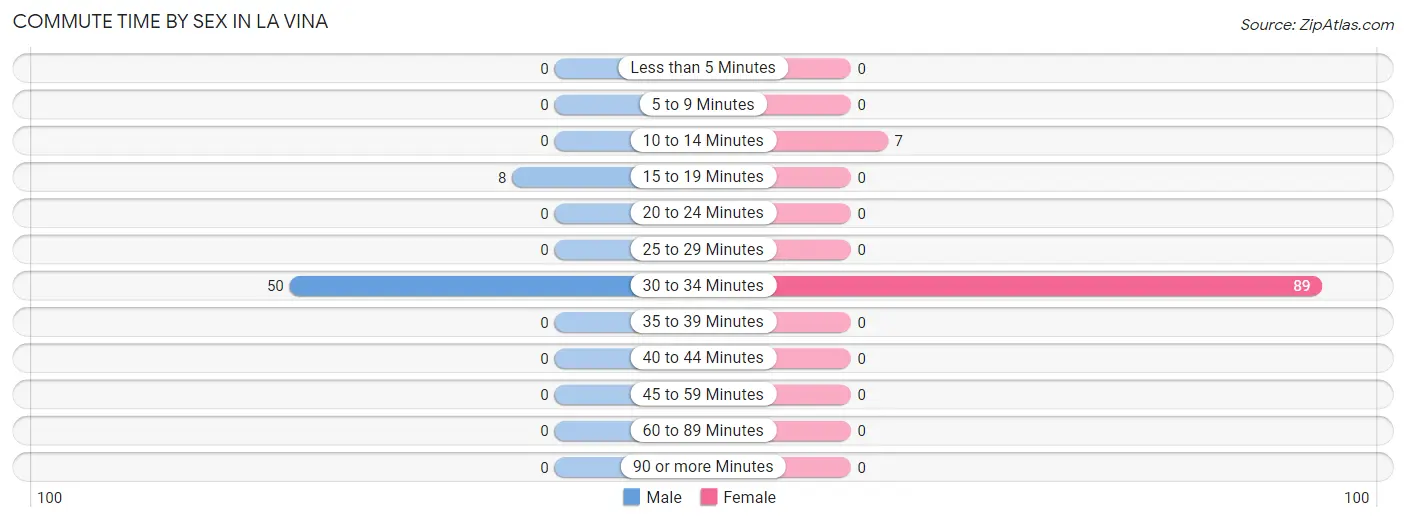
| Commute Time | Male | Female |
| Less than 5 Minutes | 0 (0.0%) | 0 (0.0%) |
| 5 to 9 Minutes | 0 (0.0%) | 0 (0.0%) |
| 10 to 14 Minutes | 0 (0.0%) | 7 (7.3%) |
| 15 to 19 Minutes | 8 (13.8%) | 0 (0.0%) |
| 20 to 24 Minutes | 0 (0.0%) | 0 (0.0%) |
| 25 to 29 Minutes | 0 (0.0%) | 0 (0.0%) |
| 30 to 34 Minutes | 50 (86.2%) | 89 (92.7%) |
| 35 to 39 Minutes | 0 (0.0%) | 0 (0.0%) |
| 40 to 44 Minutes | 0 (0.0%) | 0 (0.0%) |
| 45 to 59 Minutes | 0 (0.0%) | 0 (0.0%) |
| 60 to 89 Minutes | 0 (0.0%) | 0 (0.0%) |
| 90 or more Minutes | 0 (0.0%) | 0 (0.0%) |
Time of Departure to Work by Sex in La Vina
The most frequent times of departure to work in La Vina are 6:00 AM to 6:29 AM (50, 86.2%) for males and 12:00 PM to 3:59 PM (89, 92.7%) for females.
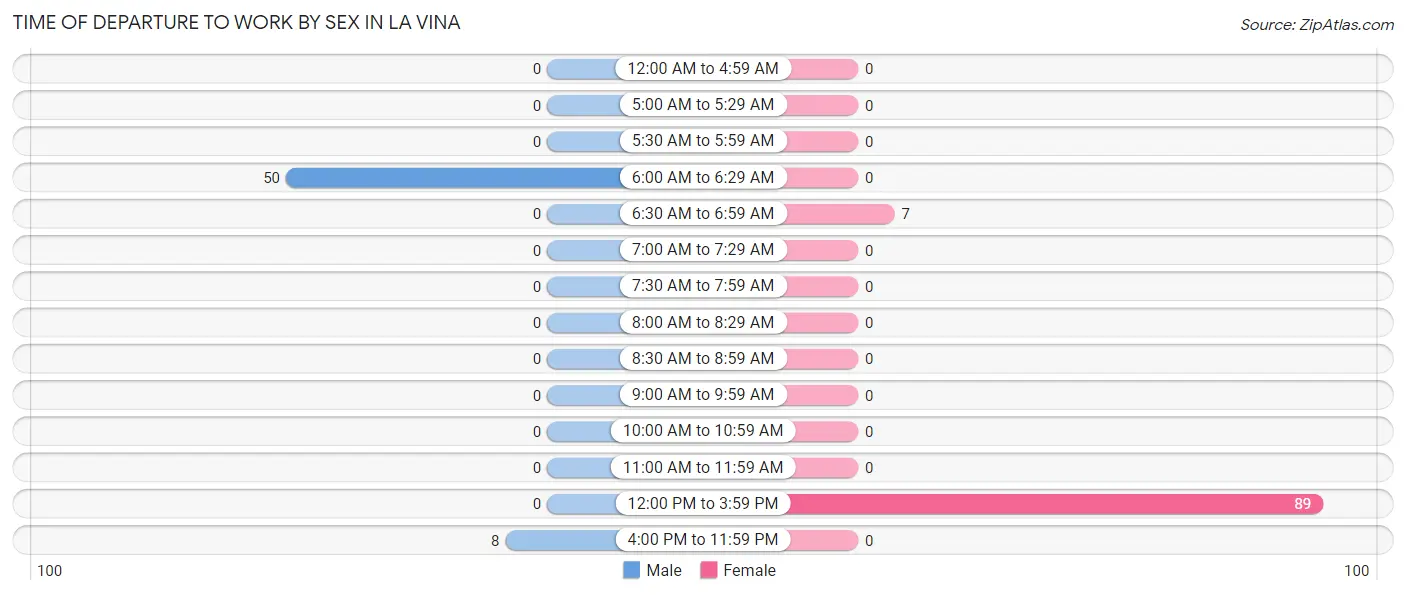
| Time of Departure | Male | Female |
| 12:00 AM to 4:59 AM | 0 (0.0%) | 0 (0.0%) |
| 5:00 AM to 5:29 AM | 0 (0.0%) | 0 (0.0%) |
| 5:30 AM to 5:59 AM | 0 (0.0%) | 0 (0.0%) |
| 6:00 AM to 6:29 AM | 50 (86.2%) | 0 (0.0%) |
| 6:30 AM to 6:59 AM | 0 (0.0%) | 7 (7.3%) |
| 7:00 AM to 7:29 AM | 0 (0.0%) | 0 (0.0%) |
| 7:30 AM to 7:59 AM | 0 (0.0%) | 0 (0.0%) |
| 8:00 AM to 8:29 AM | 0 (0.0%) | 0 (0.0%) |
| 8:30 AM to 8:59 AM | 0 (0.0%) | 0 (0.0%) |
| 9:00 AM to 9:59 AM | 0 (0.0%) | 0 (0.0%) |
| 10:00 AM to 10:59 AM | 0 (0.0%) | 0 (0.0%) |
| 11:00 AM to 11:59 AM | 0 (0.0%) | 0 (0.0%) |
| 12:00 PM to 3:59 PM | 0 (0.0%) | 89 (92.7%) |
| 4:00 PM to 11:59 PM | 8 (13.8%) | 0 (0.0%) |
| Total | 58 (100.0%) | 96 (100.0%) |
Housing Occupancy in La Vina
Occupancy by Ownership in La Vina
Of the total 157 dwellings in La Vina, owner-occupied units account for 68 (43.3%), while renter-occupied units make up 89 (56.7%).
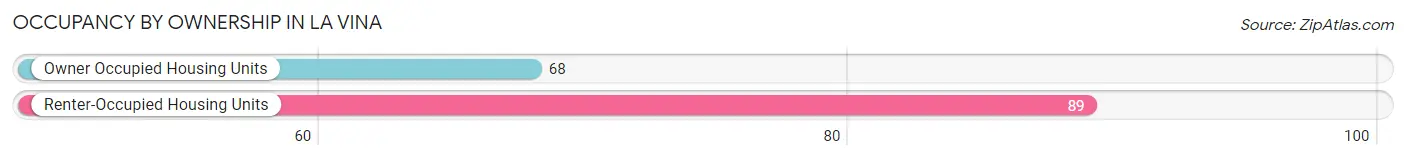
| Occupancy | # Housing Units | % Housing Units |
| Owner Occupied Housing Units | 68 | 43.3% |
| Renter-Occupied Housing Units | 89 | 56.7% |
| Total Occupied Housing Units | 157 | 100.0% |
Occupancy by Household Size in La Vina
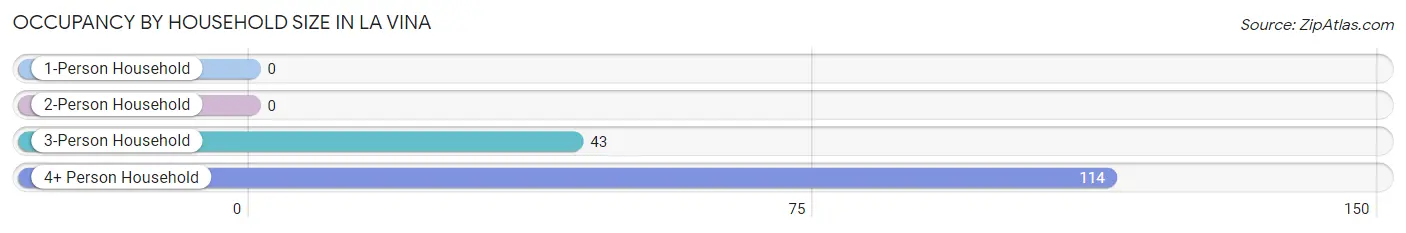
| Household Size | # Housing Units | % Housing Units |
| 1-Person Household | 0 | 0.0% |
| 2-Person Household | 0 | 0.0% |
| 3-Person Household | 43 | 27.4% |
| 4+ Person Household | 114 | 72.6% |
| Total Housing Units | 157 | 100.0% |
Occupancy by Ownership by Household Size in La Vina
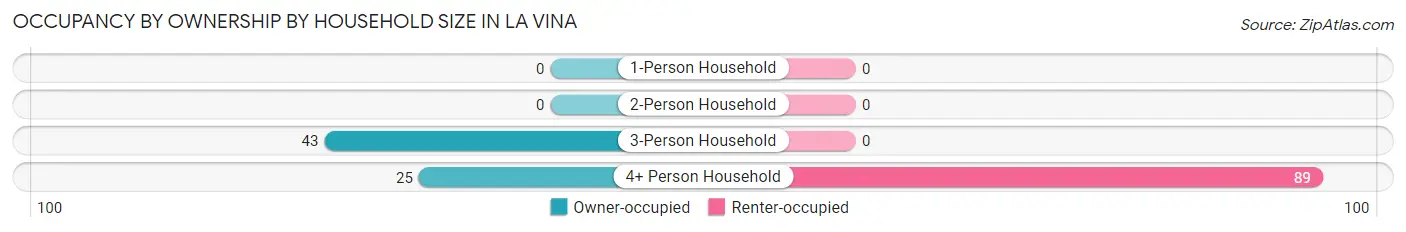
| Household Size | Owner-occupied | Renter-occupied |
| 1-Person Household | 0 (0.0%) | 0 (0.0%) |
| 2-Person Household | 0 (0.0%) | 0 (0.0%) |
| 3-Person Household | 43 (100.0%) | 0 (0.0%) |
| 4+ Person Household | 25 (21.9%) | 89 (78.1%) |
| Total Housing Units | 68 (43.3%) | 89 (56.7%) |
Occupancy by Educational Attainment in La Vina
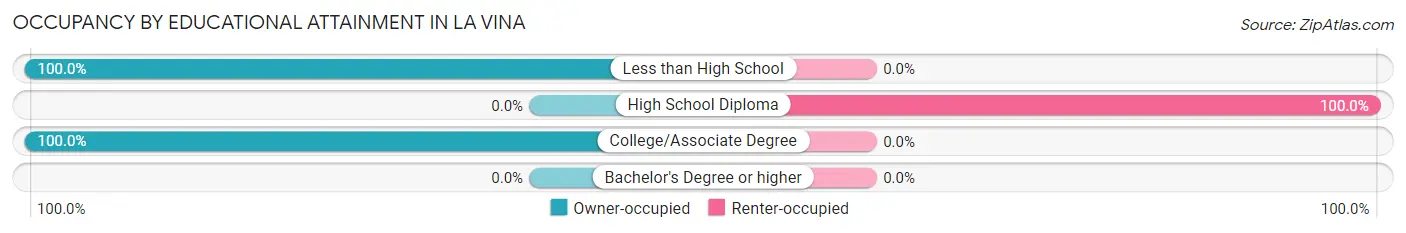
| Household Size | Owner-occupied | Renter-occupied |
| Less than High School | 43 (100.0%) | 0 (0.0%) |
| High School Diploma | 0 (0.0%) | 89 (100.0%) |
| College/Associate Degree | 25 (100.0%) | 0 (0.0%) |
| Bachelor's Degree or higher | 0 (0.0%) | 0 (0.0%) |
Occupancy by Age of Householder in La Vina
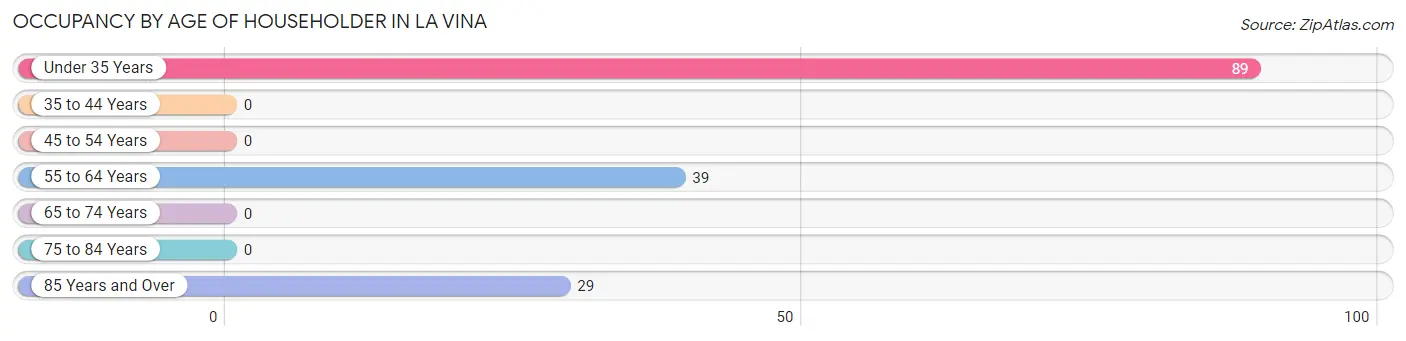
| Age Bracket | # Households | % Households |
| Under 35 Years | 89 | 56.7% |
| 35 to 44 Years | 0 | 0.0% |
| 45 to 54 Years | 0 | 0.0% |
| 55 to 64 Years | 39 | 24.8% |
| 65 to 74 Years | 0 | 0.0% |
| 75 to 84 Years | 0 | 0.0% |
| 85 Years and Over | 29 | 18.5% |
| Total | 157 | 100.0% |
Housing Finances in La Vina
Median Income by Occupancy in La Vina
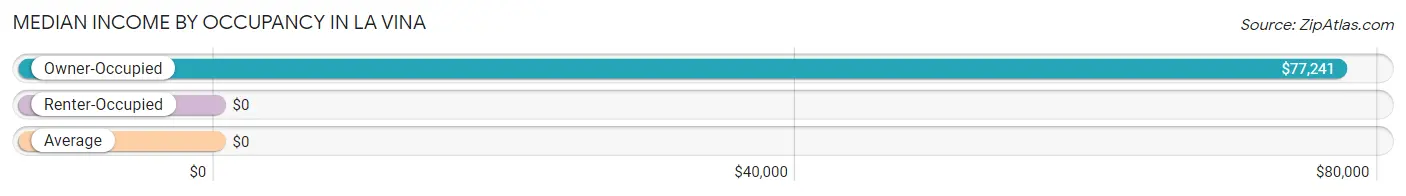
| Occupancy Type | # Households | Median Income |
| Owner-Occupied | 68 (43.3%) | $77,241 |
| Renter-Occupied | 89 (56.7%) | $0 |
| Average | 157 (100.0%) | $0 |
Occupancy by Householder Income Bracket in La Vina
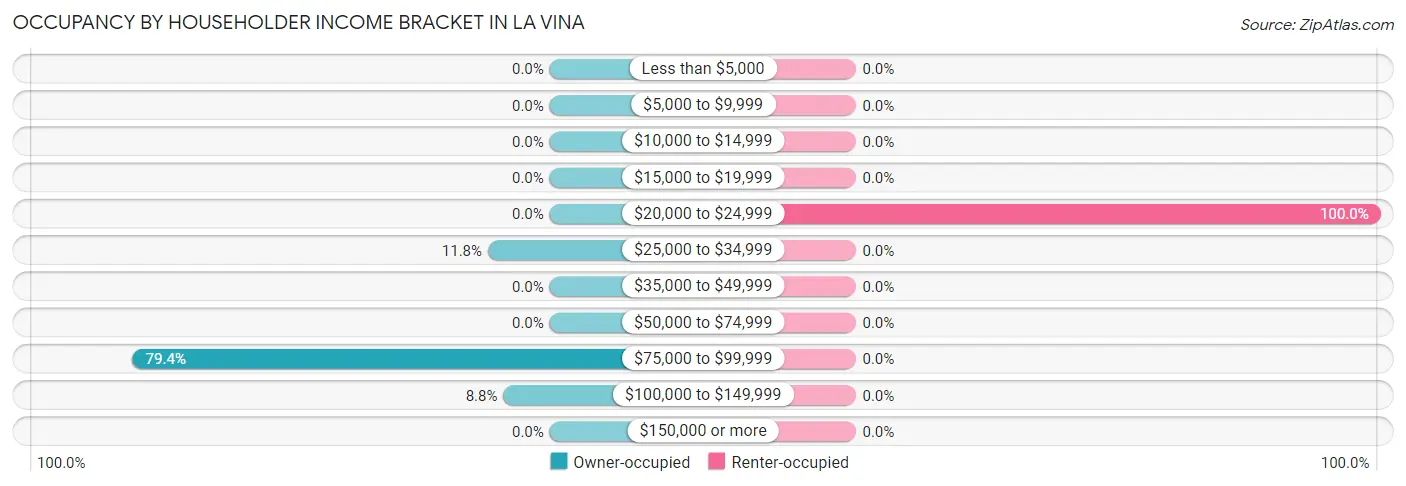
| Income Bracket | Owner-occupied | Renter-occupied |
| Less than $5,000 | 0 (0.0%) | 0 (0.0%) |
| $5,000 to $9,999 | 0 (0.0%) | 0 (0.0%) |
| $10,000 to $14,999 | 0 (0.0%) | 0 (0.0%) |
| $15,000 to $19,999 | 0 (0.0%) | 0 (0.0%) |
| $20,000 to $24,999 | 0 (0.0%) | 89 (100.0%) |
| $25,000 to $34,999 | 8 (11.8%) | 0 (0.0%) |
| $35,000 to $49,999 | 0 (0.0%) | 0 (0.0%) |
| $50,000 to $74,999 | 0 (0.0%) | 0 (0.0%) |
| $75,000 to $99,999 | 54 (79.4%) | 0 (0.0%) |
| $100,000 to $149,999 | 6 (8.8%) | 0 (0.0%) |
| $150,000 or more | 0 (0.0%) | 0 (0.0%) |
| Total | 68 (100.0%) | 89 (100.0%) |
Monthly Housing Cost Tiers in La Vina
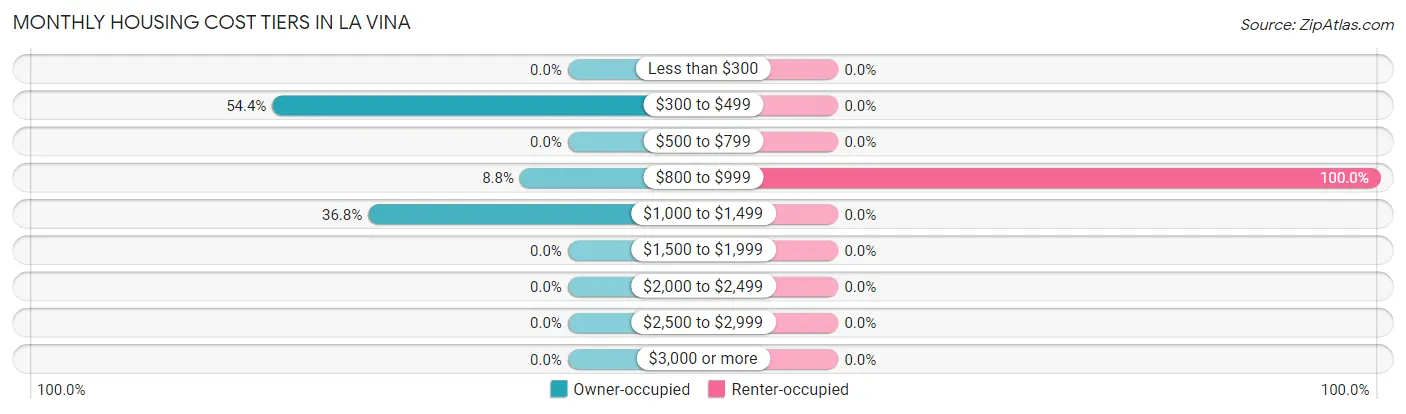
| Monthly Cost | Owner-occupied | Renter-occupied |
| Less than $300 | 0 (0.0%) | 0 (0.0%) |
| $300 to $499 | 37 (54.4%) | 0 (0.0%) |
| $500 to $799 | 0 (0.0%) | 0 (0.0%) |
| $800 to $999 | 6 (8.8%) | 89 (100.0%) |
| $1,000 to $1,499 | 25 (36.8%) | 0 (0.0%) |
| $1,500 to $1,999 | 0 (0.0%) | 0 (0.0%) |
| $2,000 to $2,499 | 0 (0.0%) | 0 (0.0%) |
| $2,500 to $2,999 | 0 (0.0%) | 0 (0.0%) |
| $3,000 or more | 0 (0.0%) | 0 (0.0%) |
| Total | 68 (100.0%) | 89 (100.0%) |
Physical Housing Characteristics in La Vina
Housing Structures in La Vina
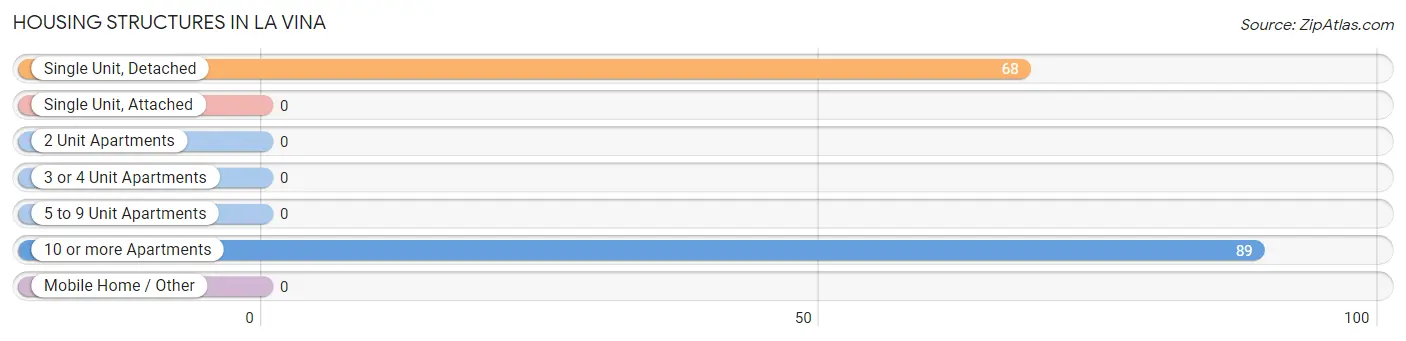
| Structure Type | # Housing Units | % Housing Units |
| Single Unit, Detached | 68 | 43.3% |
| Single Unit, Attached | 0 | 0.0% |
| 2 Unit Apartments | 0 | 0.0% |
| 3 or 4 Unit Apartments | 0 | 0.0% |
| 5 to 9 Unit Apartments | 0 | 0.0% |
| 10 or more Apartments | 89 | 56.7% |
| Mobile Home / Other | 0 | 0.0% |
| Total | 157 | 100.0% |
Housing Structures by Occupancy in La Vina
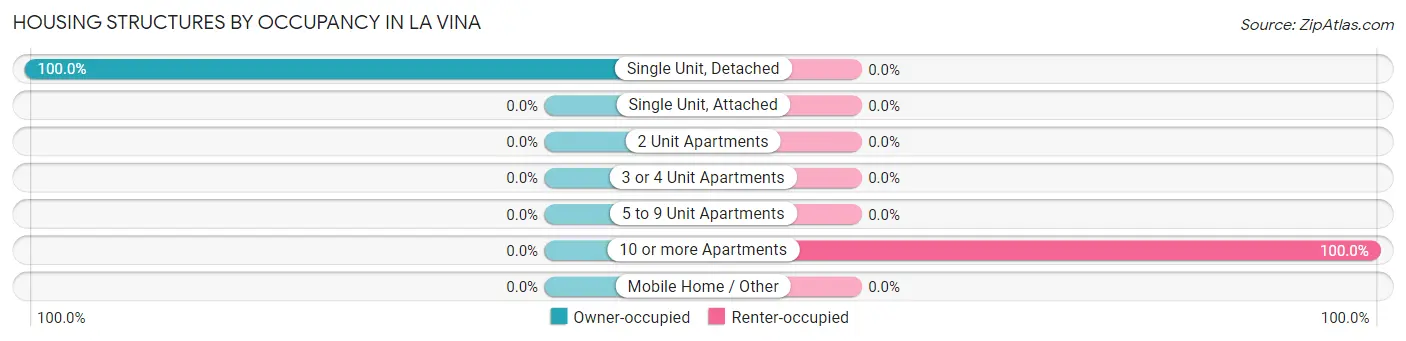
| Structure Type | Owner-occupied | Renter-occupied |
| Single Unit, Detached | 68 (100.0%) | 0 (0.0%) |
| Single Unit, Attached | 0 (0.0%) | 0 (0.0%) |
| 2 Unit Apartments | 0 (0.0%) | 0 (0.0%) |
| 3 or 4 Unit Apartments | 0 (0.0%) | 0 (0.0%) |
| 5 to 9 Unit Apartments | 0 (0.0%) | 0 (0.0%) |
| 10 or more Apartments | 0 (0.0%) | 89 (100.0%) |
| Mobile Home / Other | 0 (0.0%) | 0 (0.0%) |
| Total | 68 (43.3%) | 89 (56.7%) |
Housing Structures by Number of Rooms in La Vina
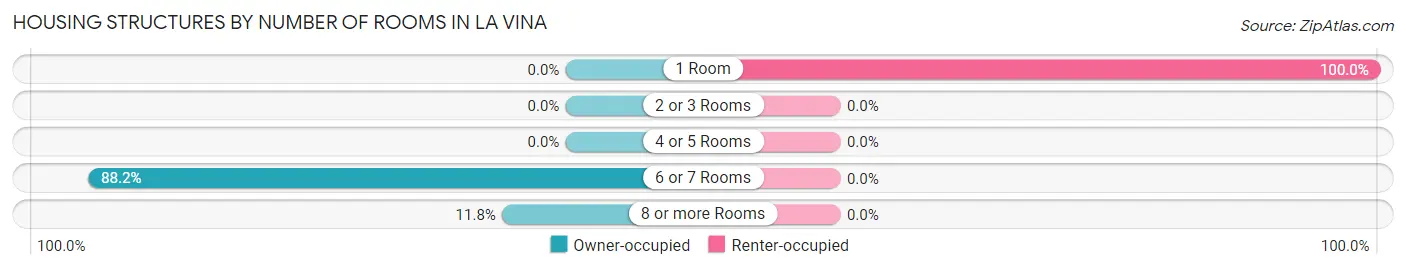
| Number of Rooms | Owner-occupied | Renter-occupied |
| 1 Room | 0 (0.0%) | 89 (100.0%) |
| 2 or 3 Rooms | 0 (0.0%) | 0 (0.0%) |
| 4 or 5 Rooms | 0 (0.0%) | 0 (0.0%) |
| 6 or 7 Rooms | 60 (88.2%) | 0 (0.0%) |
| 8 or more Rooms | 8 (11.8%) | 0 (0.0%) |
| Total | 68 (100.0%) | 89 (100.0%) |
Housing Structure by Heating Type in La Vina
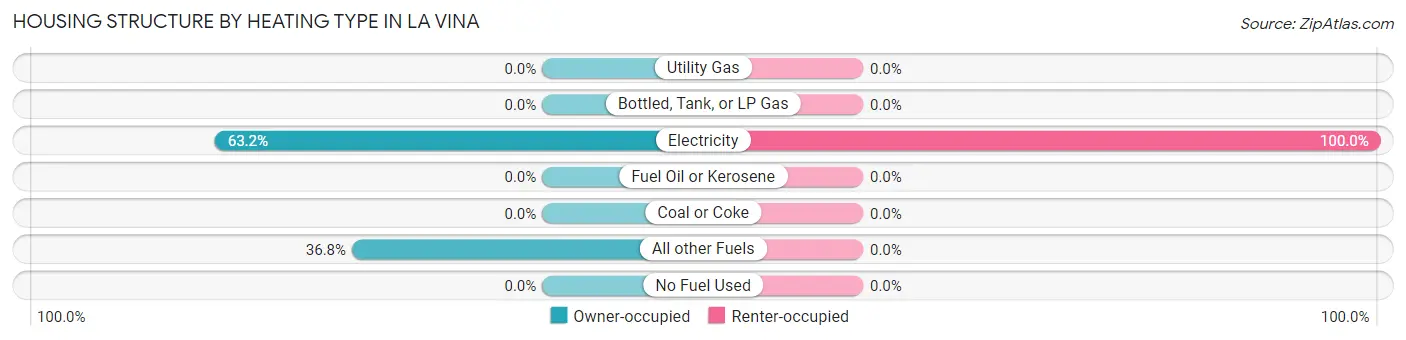
| Heating Type | Owner-occupied | Renter-occupied |
| Utility Gas | 0 (0.0%) | 0 (0.0%) |
| Bottled, Tank, or LP Gas | 0 (0.0%) | 0 (0.0%) |
| Electricity | 43 (63.2%) | 89 (100.0%) |
| Fuel Oil or Kerosene | 0 (0.0%) | 0 (0.0%) |
| Coal or Coke | 0 (0.0%) | 0 (0.0%) |
| All other Fuels | 25 (36.8%) | 0 (0.0%) |
| No Fuel Used | 0 (0.0%) | 0 (0.0%) |
| Total | 68 (100.0%) | 89 (100.0%) |
Household Vehicle Usage in La Vina
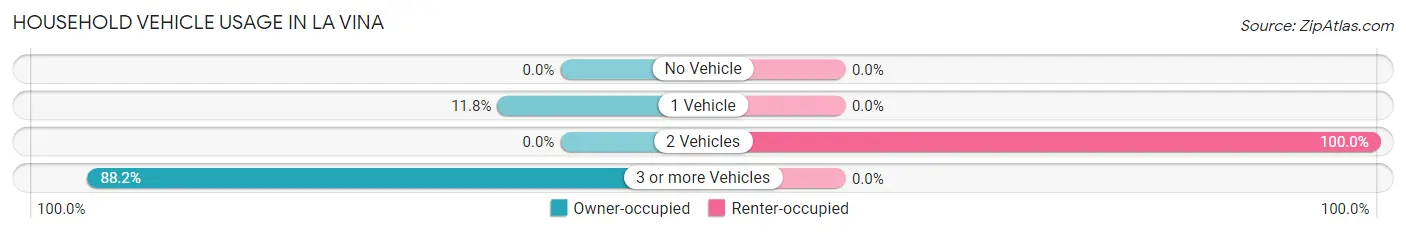
| Vehicles per Household | Owner-occupied | Renter-occupied |
| No Vehicle | 0 (0.0%) | 0 (0.0%) |
| 1 Vehicle | 8 (11.8%) | 0 (0.0%) |
| 2 Vehicles | 0 (0.0%) | 89 (100.0%) |
| 3 or more Vehicles | 60 (88.2%) | 0 (0.0%) |
| Total | 68 (100.0%) | 89 (100.0%) |
Real Estate & Mortgages in La Vina
Real Estate and Mortgage Overview in La Vina
| Characteristic | Without Mortgage | With Mortgage |
| Housing Units | 62 | 6 |
| Median Property Value | $221,300 | $0 |
| Median Household Income | $76,983 | $0 |
| Monthly Housing Costs | - | - |
| Real Estate Taxes | $1,081 | $0 |
Property Value by Mortgage Status in La Vina
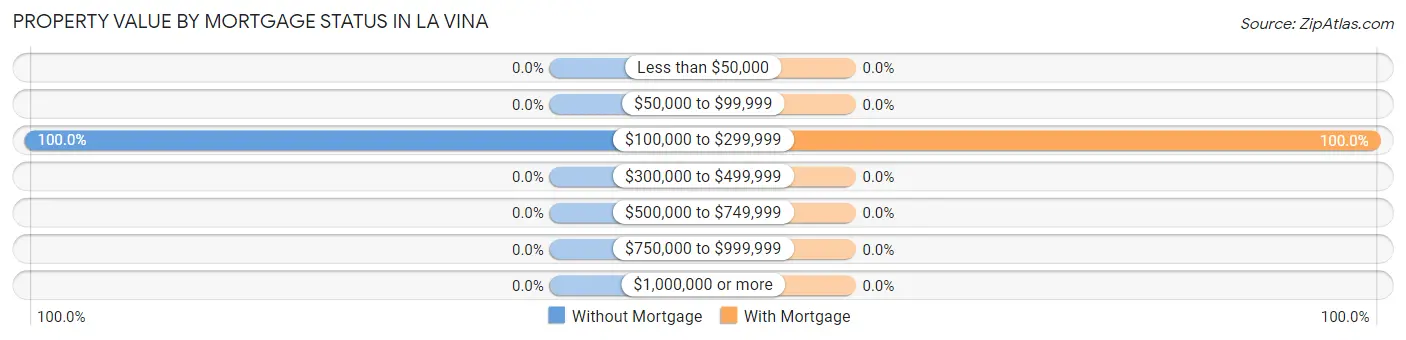
| Property Value | Without Mortgage | With Mortgage |
| Less than $50,000 | 0 (0.0%) | 0 (0.0%) |
| $50,000 to $99,999 | 0 (0.0%) | 0 (0.0%) |
| $100,000 to $299,999 | 62 (100.0%) | 6 (100.0%) |
| $300,000 to $499,999 | 0 (0.0%) | 0 (0.0%) |
| $500,000 to $749,999 | 0 (0.0%) | 0 (0.0%) |
| $750,000 to $999,999 | 0 (0.0%) | 0 (0.0%) |
| $1,000,000 or more | 0 (0.0%) | 0 (0.0%) |
| Total | 62 (100.0%) | 6 (100.0%) |
Household Income by Mortgage Status in La Vina
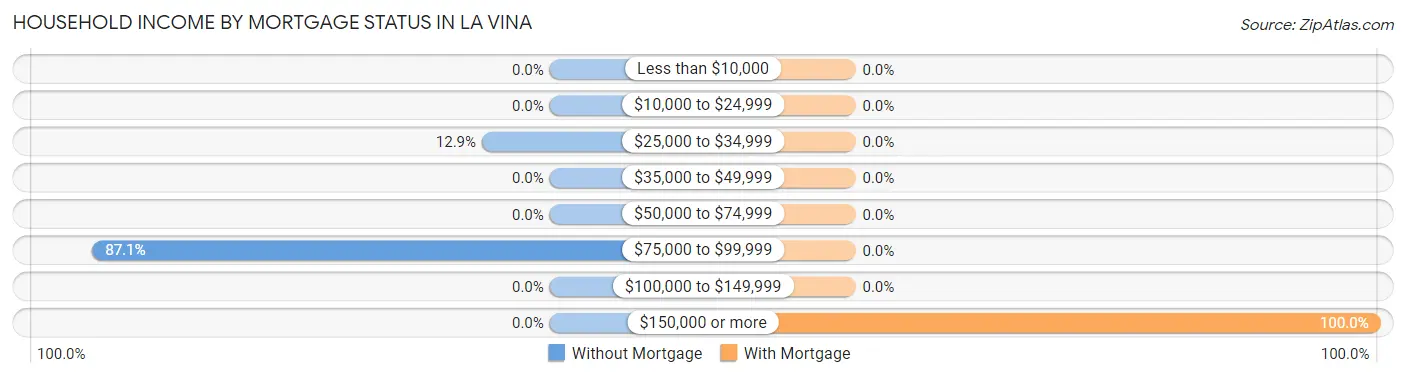
| Household Income | Without Mortgage | With Mortgage |
| Less than $10,000 | 0 (0.0%) | 0 (0.0%) |
| $10,000 to $24,999 | 0 (0.0%) | 0 (0.0%) |
| $25,000 to $34,999 | 8 (12.9%) | 0 (0.0%) |
| $35,000 to $49,999 | 0 (0.0%) | 0 (0.0%) |
| $50,000 to $74,999 | 0 (0.0%) | 0 (0.0%) |
| $75,000 to $99,999 | 54 (87.1%) | 0 (0.0%) |
| $100,000 to $149,999 | 0 (0.0%) | 0 (0.0%) |
| $150,000 or more | 0 (0.0%) | 6 (100.0%) |
| Total | 62 (100.0%) | 6 (100.0%) |
Property Value to Household Income Ratio in La Vina
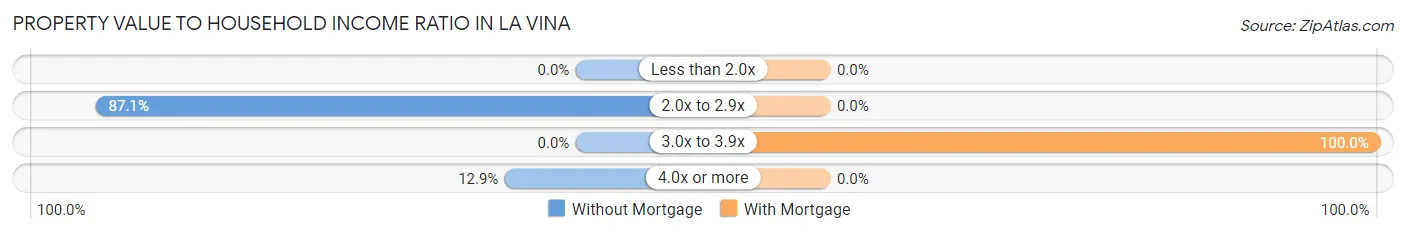
| Value-to-Income Ratio | Without Mortgage | With Mortgage |
| Less than 2.0x | 0 (0.0%) | 0 (0.0%) |
| 2.0x to 2.9x | 54 (87.1%) | 0 (0.0%) |
| 3.0x to 3.9x | 0 (0.0%) | 6 (100.0%) |
| 4.0x or more | 8 (12.9%) | 0 (0.0%) |
| Total | 62 (100.0%) | 6 (100.0%) |
Real Estate Taxes by Mortgage Status in La Vina
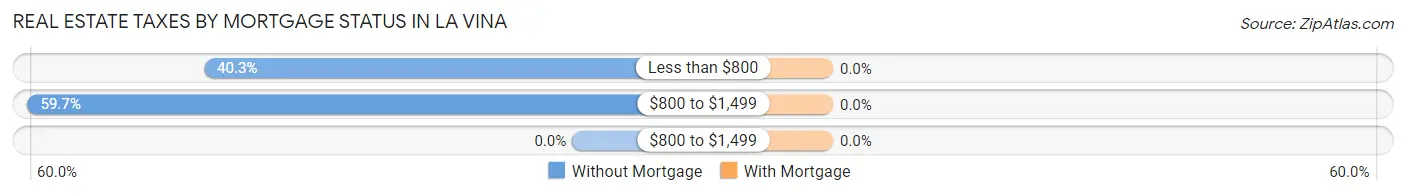
| Property Taxes | Without Mortgage | With Mortgage |
| Less than $800 | 25 (40.3%) | 0 (0.0%) |
| $800 to $1,499 | 37 (59.7%) | 0 (0.0%) |
| $800 to $1,499 | 0 (0.0%) | 0 (0.0%) |
| Total | 62 (100.0%) | 6 (100.0%) |
Health & Disability in La Vina
Health Insurance Coverage by Age in La Vina
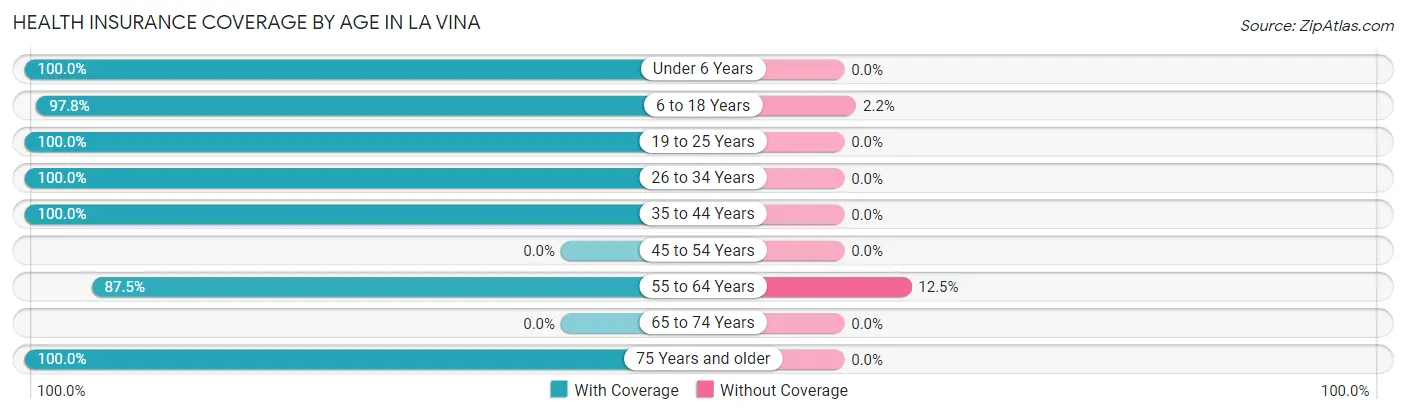
| Age Bracket | With Coverage | Without Coverage |
| Under 6 Years | 135 (100.0%) | 0 (0.0%) |
| 6 to 18 Years | 401 (97.8%) | 9 (2.2%) |
| 19 to 25 Years | 3 (100.0%) | 0 (0.0%) |
| 26 to 34 Years | 127 (100.0%) | 0 (0.0%) |
| 35 to 44 Years | 88 (100.0%) | 0 (0.0%) |
| 45 to 54 Years | 0 (0.0%) | 0 (0.0%) |
| 55 to 64 Years | 105 (87.5%) | 15 (12.5%) |
| 65 to 74 Years | 0 (0.0%) | 0 (0.0%) |
| 75 Years and older | 29 (100.0%) | 0 (0.0%) |
| Total | 888 (97.4%) | 24 (2.6%) |
Health Insurance Coverage by Citizenship Status in La Vina
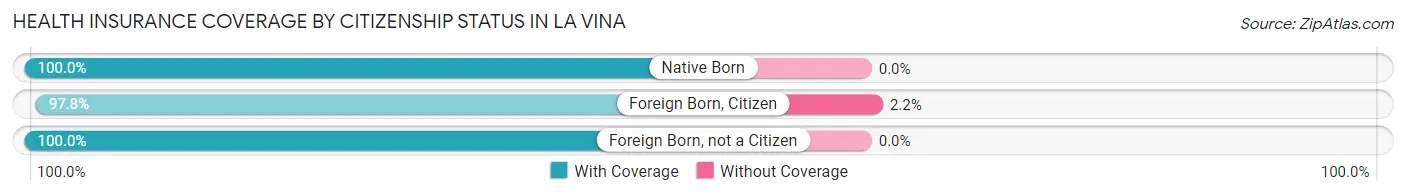
| Citizenship Status | With Coverage | Without Coverage |
| Native Born | 135 (100.0%) | 0 (0.0%) |
| Foreign Born, Citizen | 401 (97.8%) | 9 (2.2%) |
| Foreign Born, not a Citizen | 3 (100.0%) | 0 (0.0%) |
Health Insurance Coverage by Household Income in La Vina
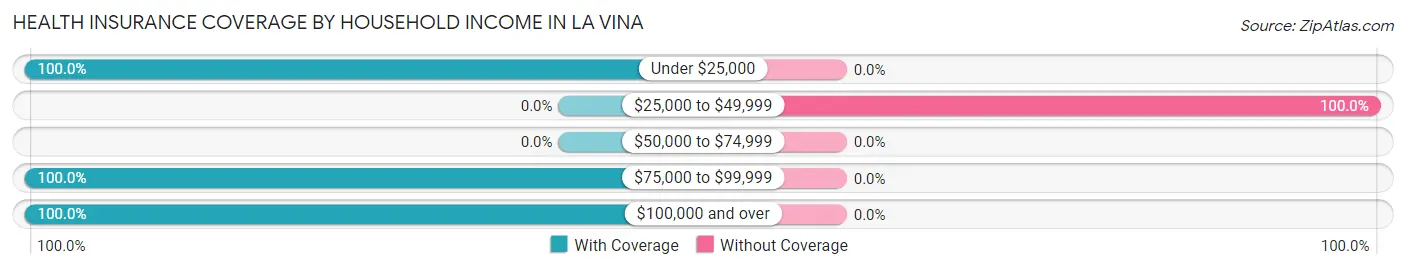
| Household Income | With Coverage | Without Coverage |
| Under $25,000 | 521 (100.0%) | 0 (0.0%) |
| $25,000 to $49,999 | 0 (0.0%) | 24 (100.0%) |
| $50,000 to $74,999 | 0 (0.0%) | 0 (0.0%) |
| $75,000 to $99,999 | 351 (100.0%) | 0 (0.0%) |
| $100,000 and over | 16 (100.0%) | 0 (0.0%) |
Public vs Private Health Insurance Coverage by Age in La Vina
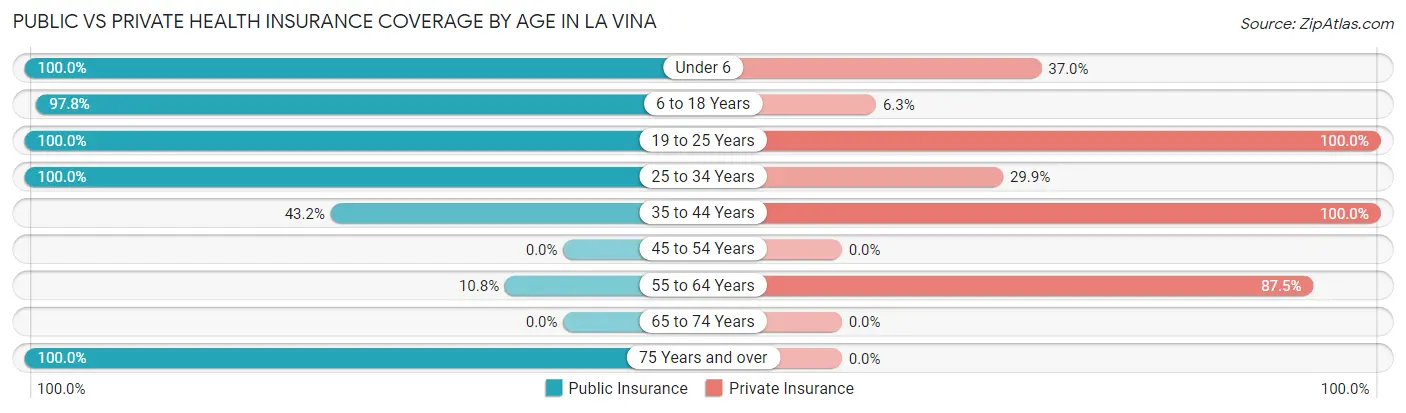
| Age Bracket | Public Insurance | Private Insurance |
| Under 6 | 135 (100.0%) | 50 (37.0%) |
| 6 to 18 Years | 401 (97.8%) | 26 (6.3%) |
| 19 to 25 Years | 3 (100.0%) | 3 (100.0%) |
| 25 to 34 Years | 127 (100.0%) | 38 (29.9%) |
| 35 to 44 Years | 38 (43.2%) | 88 (100.0%) |
| 45 to 54 Years | 0 (0.0%) | 0 (0.0%) |
| 55 to 64 Years | 13 (10.8%) | 105 (87.5%) |
| 65 to 74 Years | 0 (0.0%) | 0 (0.0%) |
| 75 Years and over | 29 (100.0%) | 0 (0.0%) |
| Total | 746 (81.8%) | 310 (34.0%) |
Disability Status by Sex by Age in La Vina
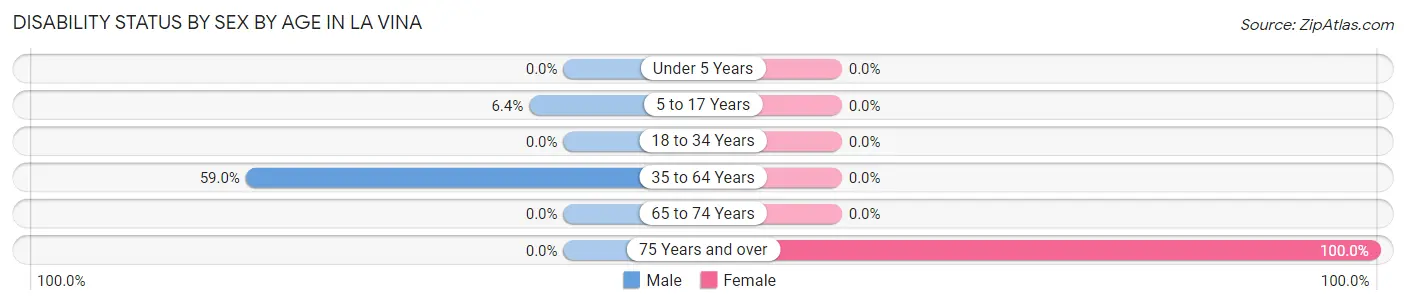
| Age Bracket | Male | Female |
| Under 5 Years | 0 (0.0%) | 0 (0.0%) |
| 5 to 17 Years | 26 (6.4%) | 0 (0.0%) |
| 18 to 34 Years | 0 (0.0%) | 0 (0.0%) |
| 35 to 64 Years | 102 (59.0%) | 0 (0.0%) |
| 65 to 74 Years | 0 (0.0%) | 0 (0.0%) |
| 75 Years and over | 0 (0.0%) | 29 (100.0%) |
Disability Class by Sex by Age in La Vina
Disability Class: Hearing Difficulty
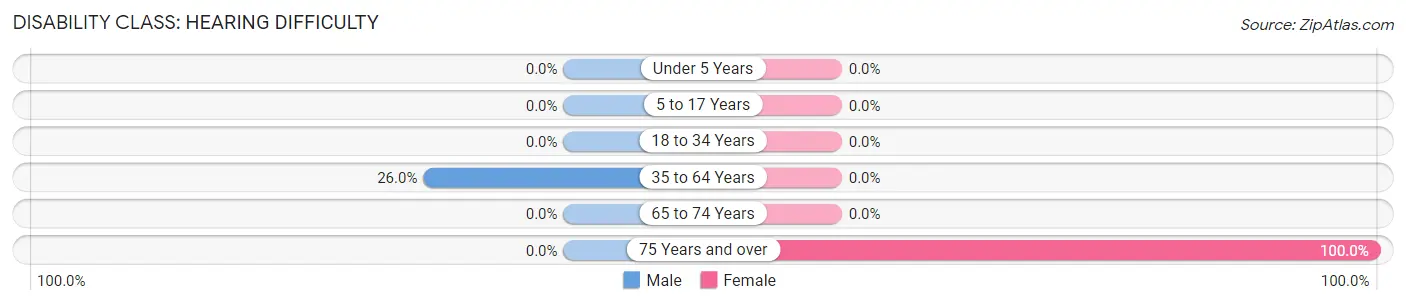
| Age Bracket | Male | Female |
| Under 5 Years | 0 (0.0%) | 0 (0.0%) |
| 5 to 17 Years | 0 (0.0%) | 0 (0.0%) |
| 18 to 34 Years | 0 (0.0%) | 0 (0.0%) |
| 35 to 64 Years | 45 (26.0%) | 0 (0.0%) |
| 65 to 74 Years | 0 (0.0%) | 0 (0.0%) |
| 75 Years and over | 0 (0.0%) | 29 (100.0%) |
Disability Class: Vision Difficulty
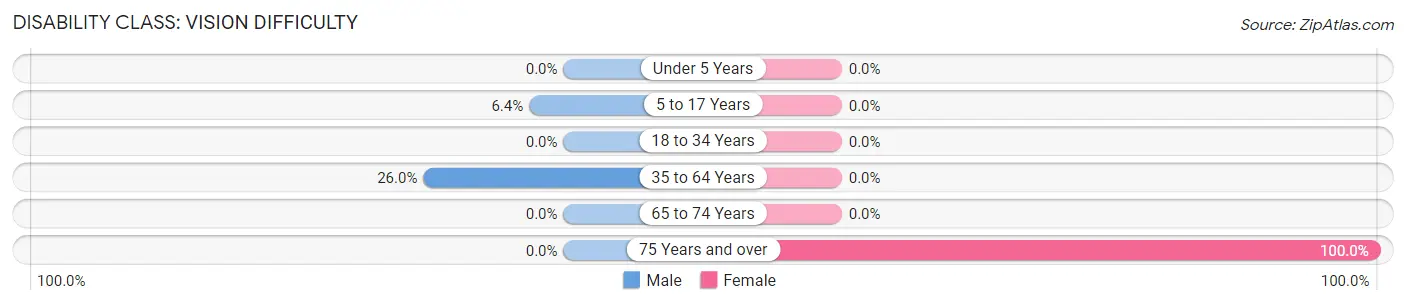
| Age Bracket | Male | Female |
| Under 5 Years | 0 (0.0%) | 0 (0.0%) |
| 5 to 17 Years | 26 (6.4%) | 0 (0.0%) |
| 18 to 34 Years | 0 (0.0%) | 0 (0.0%) |
| 35 to 64 Years | 45 (26.0%) | 0 (0.0%) |
| 65 to 74 Years | 0 (0.0%) | 0 (0.0%) |
| 75 Years and over | 0 (0.0%) | 29 (100.0%) |
Disability Class: Cognitive Difficulty
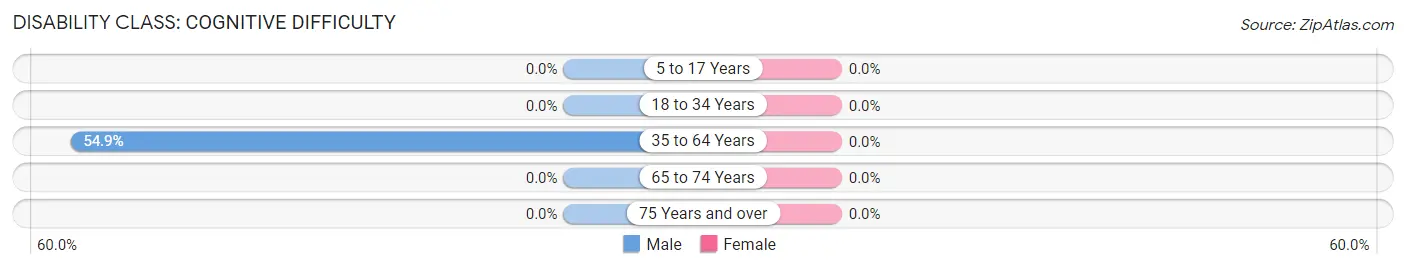
| Age Bracket | Male | Female |
| 5 to 17 Years | 0 (0.0%) | 0 (0.0%) |
| 18 to 34 Years | 0 (0.0%) | 0 (0.0%) |
| 35 to 64 Years | 95 (54.9%) | 0 (0.0%) |
| 65 to 74 Years | 0 (0.0%) | 0 (0.0%) |
| 75 Years and over | 0 (0.0%) | 0 (0.0%) |
Disability Class: Ambulatory Difficulty
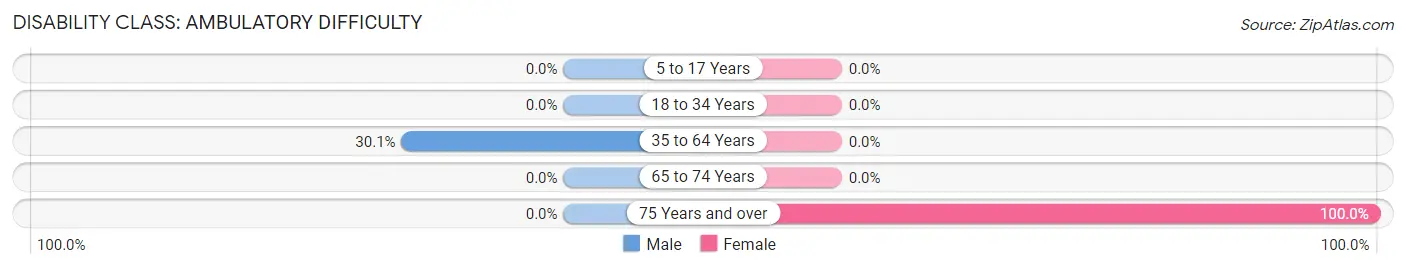
| Age Bracket | Male | Female |
| 5 to 17 Years | 0 (0.0%) | 0 (0.0%) |
| 18 to 34 Years | 0 (0.0%) | 0 (0.0%) |
| 35 to 64 Years | 52 (30.1%) | 0 (0.0%) |
| 65 to 74 Years | 0 (0.0%) | 0 (0.0%) |
| 75 Years and over | 0 (0.0%) | 29 (100.0%) |
Disability Class: Self-Care Difficulty
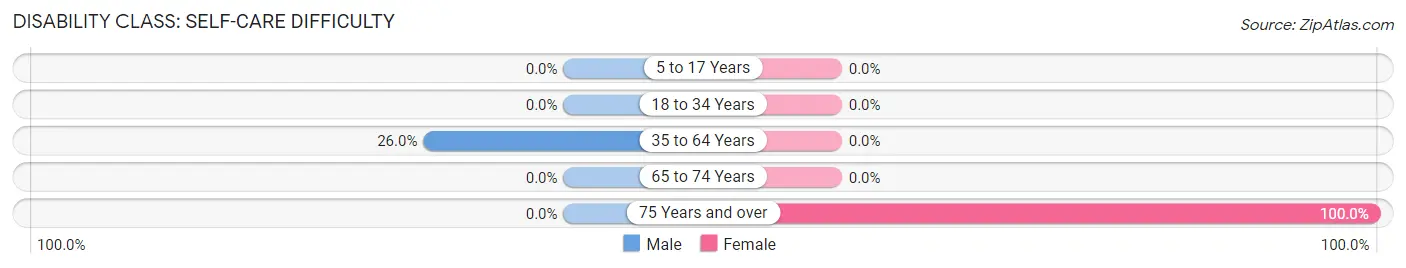
| Age Bracket | Male | Female |
| 5 to 17 Years | 0 (0.0%) | 0 (0.0%) |
| 18 to 34 Years | 0 (0.0%) | 0 (0.0%) |
| 35 to 64 Years | 45 (26.0%) | 0 (0.0%) |
| 65 to 74 Years | 0 (0.0%) | 0 (0.0%) |
| 75 Years and over | 0 (0.0%) | 29 (100.0%) |
Technology Access in La Vina
Computing Device Access in La Vina
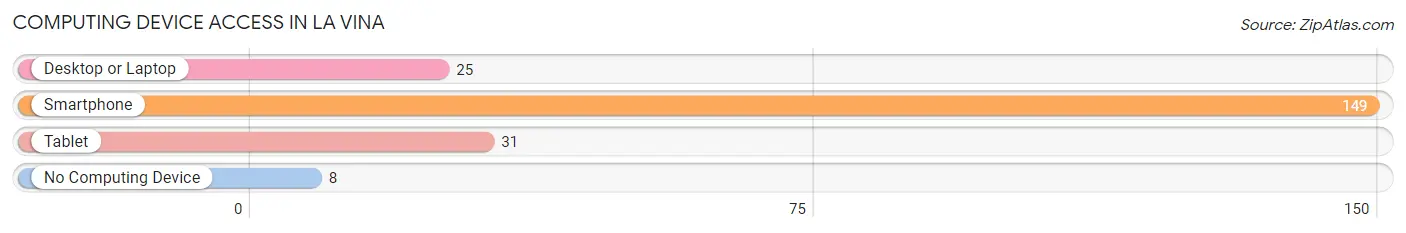
| Device Type | # Households | % Households |
| Desktop or Laptop | 25 | 15.9% |
| Smartphone | 149 | 94.9% |
| Tablet | 31 | 19.8% |
| No Computing Device | 8 | 5.1% |
| Total | 157 | 100.0% |
Internet Access in La Vina
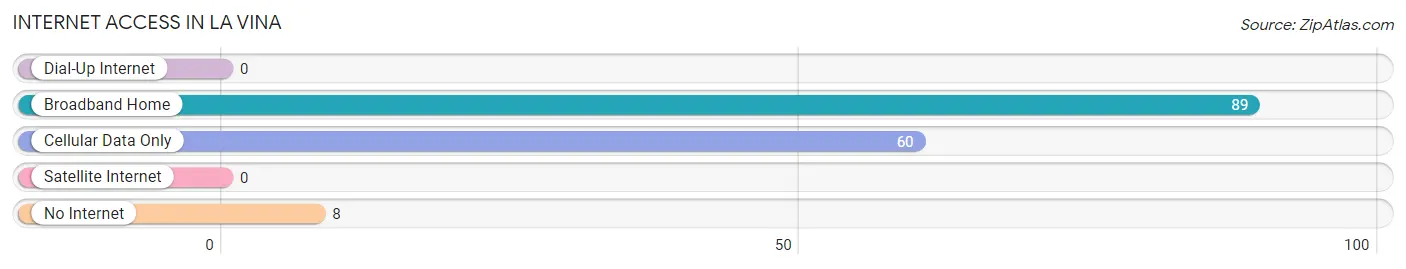
| Internet Type | # Households | % Households |
| Dial-Up Internet | 0 | 0.0% |
| Broadband Home | 89 | 56.7% |
| Cellular Data Only | 60 | 38.2% |
| Satellite Internet | 0 | 0.0% |
| No Internet | 8 | 5.1% |
| Total | 157 | 100.0% |
La Vina Summary
La Vina is a small unincorporated community located in the foothills of the San Gabriel Mountains in Los Angeles County, California. It is situated in the San Gabriel Valley, approximately 25 miles east of downtown Los Angeles. La Vina is a rural community with a population of approximately 1,000 people.
History
The area now known as La Vina was originally inhabited by the Tongva people, who were the original inhabitants of the Los Angeles Basin. The Tongva people were hunter-gatherers who lived in small villages and subsisted on the abundant natural resources of the area. The first Europeans to settle in the area were Spanish missionaries, who established the Mission San Gabriel Arcangel in 1771. The mission was the first of 21 missions established in California by the Spanish.
In 1845, the Mexican government granted the land that is now La Vina to Don Jose Maria Covarrubias. The land was used for cattle ranching and farming. In 1876, the land was purchased by the La Vina Land and Water Company, which developed the area into a small agricultural community. The company built a hotel, a general store, and a post office.
Geography
La Vina is located in the foothills of the San Gabriel Mountains in Los Angeles County, California. It is situated in the San Gabriel Valley, approximately 25 miles east of downtown Los Angeles. The community is bordered by the cities of Azusa to the north, Glendora to the east, and San Dimas to the south. The community is located at an elevation of 1,400 feet above sea level.
The climate in La Vina is mild and temperate, with warm summers and cool winters. The average annual temperature is 68°F, with an average high of 85°F in the summer and an average low of 50°F in the winter. The average annual precipitation is 17 inches, with most of the rain falling in the winter months.
Economy
The economy of La Vina is largely based on agriculture. The area is home to several small farms that produce a variety of fruits and vegetables, including oranges, lemons, avocados, and tomatoes. The area is also home to several nurseries that specialize in growing ornamental plants and flowers.
In addition to agriculture, La Vina is home to several small businesses, including a gas station, a grocery store, a hardware store, and a restaurant. The community is also home to several small manufacturing companies that produce a variety of products, including furniture, clothing, and electronics.
Demographics
As of the 2010 census, the population of La Vina was 1,000 people. The racial makeup of the community was 75.3% White, 0.7% African American, 0.3% Native American, 0.7% Asian, 0.1% Pacific Islander, and 22.0% from other races. The median household income was $45,000, and the median age was 37 years. The majority of the population (90.3%) spoke English as their primary language.
Common Questions
What is Per Capita Income in La Vina?
Per Capita income in La Vina is $9,918.
What is Income or Wage Gap in La Vina?
Income or Wage Gap in La Vina is 47.4%.
Women in La Vina earn 52.6 cents for every dollar earned by a man.
What is Inequality or Gini Index in La Vina?
Inequality or Gini Index in La Vina is 0.35.
What is the Total Population of La Vina?
Total Population of La Vina is 912.
What is the Total Male Population of La Vina?
Total Male Population of La Vina is 693.
What is the Total Female Population of La Vina?
Total Female Population of La Vina is 219.
What is the Ratio of Males per 100 Females in La Vina?
There are 316.44 Males per 100 Females in La Vina.
What is the Ratio of Females per 100 Males in La Vina?
There are 31.60 Females per 100 Males in La Vina.
What is the Median Population Age in La Vina?
Median Population Age in La Vina is 17.0 Years.
What is the Average Family Size in La Vina
Average Family Size in La Vina is 5.8 People.
What is the Average Household Size in La Vina
Average Household Size in La Vina is 5.8 People.
How Large is the Labor Force in La Vina?
There are 278 People in the Labor Forcein in La Vina.
What is the Percentage of People in the Labor Force in La Vina?
60.6% of People are in the Labor Force in La Vina.
What is the Unemployment Rate in La Vina?
Unemployment Rate in La Vina is 28.4%.