Cities with the Highest Unemployment Rate Amomg Youth Under the Age of 25 in Texas
RELATED REPORTS & OPTIONS
Highest Unemployment | Youth < 25
Texas
Compare Cities
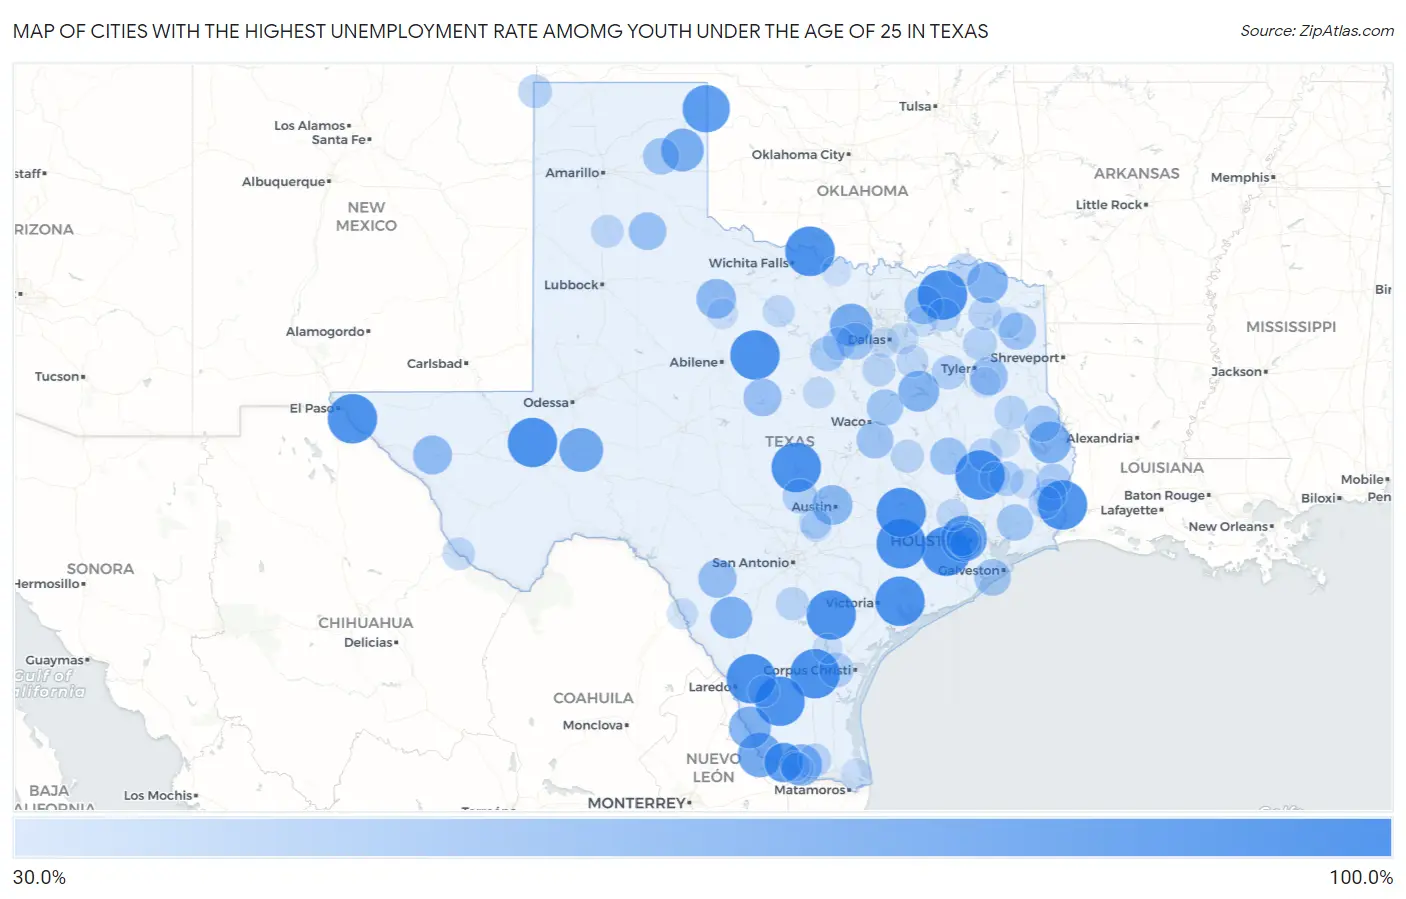
Map of Cities with the Highest Unemployment Rate Amomg Youth Under the Age of 25 in Texas
0.0%
100.0%
Cities with the Highest Unemployment Rate Amomg Youth Under the Age of 25 in Texas
| City | Youth Unemployment | vs State | vs National | |
| 1. | Clint | 100.0% | 10.8%(+89.2)#1 | 10.9%(+89.1)#2 |
| 2. | Deweyville | 100.0% | 10.8%(+89.2)#2 | 10.9%(+89.1)#11 |
| 3. | Pecan Gap | 100.0% | 10.8%(+89.2)#3 | 10.9%(+89.1)#24 |
| 4. | Cumings | 100.0% | 10.8%(+89.2)#4 | 10.9%(+89.1)#45 |
| 5. | Alice Acres | 100.0% | 10.8%(+89.2)#5 | 10.9%(+89.1)#64 |
| 6. | Point Blank | 100.0% | 10.8%(+89.2)#6 | 10.9%(+89.1)#74 |
| 7. | Pettus | 100.0% | 10.8%(+89.2)#7 | 10.9%(+89.1)#90 |
| 8. | Buchanan Lake Village | 100.0% | 10.8%(+89.2)#8 | 10.9%(+89.1)#99 |
| 9. | Vanderbilt | 100.0% | 10.8%(+89.2)#9 | 10.9%(+89.1)#102 |
| 10. | Glidden | 100.0% | 10.8%(+89.2)#10 | 10.9%(+89.1)#110 |
| 11. | Rock Island | 100.0% | 10.8%(+89.2)#11 | 10.9%(+89.1)#120 |
| 12. | Byers | 100.0% | 10.8%(+89.2)#12 | 10.9%(+89.1)#142 |
| 13. | Moran | 100.0% | 10.8%(+89.2)#13 | 10.9%(+89.1)#210 |
| 14. | Kopperl | 100.0% | 10.8%(+89.2)#14 | 10.9%(+89.1)#262 |
| 15. | Coyanosa | 100.0% | 10.8%(+89.2)#15 | 10.9%(+89.1)#282 |
| 16. | South Fork Estates | 100.0% | 10.8%(+89.2)#16 | 10.9%(+89.1)#303 |
| 17. | Los Veteranos I | 100.0% | 10.8%(+89.2)#17 | 10.9%(+89.1)#312 |
| 18. | Burton | 99.9% | 10.8%(+89.1)#18 | 10.9%(+89.0)#354 |
| 19. | Higgins | 92.5% | 10.8%(+81.7)#19 | 10.9%(+81.6)#395 |
| 20. | Hilshire Village | 88.9% | 10.8%(+78.1)#20 | 10.9%(+78.0)#407 |
| 21. | Fronton | 82.8% | 10.8%(+72.0)#21 | 10.9%(+71.9)#440 |
| 22. | Mccamey | 81.0% | 10.8%(+70.2)#22 | 10.9%(+70.1)#455 |
| 23. | Pecan Acres | 77.1% | 10.8%(+66.3)#23 | 10.9%(+66.2)#485 |
| 24. | Mobeetie | 76.9% | 10.8%(+66.1)#24 | 10.9%(+66.0)#488 |
| 25. | Siesta Shores | 74.6% | 10.8%(+63.8)#25 | 10.9%(+63.7)#526 |
| 26. | Big Wells | 73.8% | 10.8%(+63.0)#26 | 10.9%(+62.9)#534 |
| 27. | Pineland | 73.6% | 10.8%(+62.8)#27 | 10.9%(+62.7)#537 |
| 28. | West Sharyland | 73.0% | 10.8%(+62.2)#28 | 10.9%(+62.1)#543 |
| 29. | Eureka | 71.3% | 10.8%(+60.5)#29 | 10.9%(+60.4)#570 |
| 30. | Clarksville | 70.6% | 10.8%(+59.8)#30 | 10.9%(+59.7)#577 |
| 31. | West Lake Hills | 67.9% | 10.8%(+57.1)#31 | 10.9%(+57.0)#616 |
| 32. | West Alto Bonito | 67.6% | 10.8%(+56.8)#32 | 10.9%(+56.7)#619 |
| 33. | O Brien | 66.6% | 10.8%(+55.8)#33 | 10.9%(+55.7)#651 |
| 34. | Van Horn | 64.4% | 10.8%(+53.6)#34 | 10.9%(+53.5)#680 |
| 35. | Valle Vista | 63.9% | 10.8%(+53.1)#35 | 10.9%(+53.0)#688 |
| 36. | Santo | 62.9% | 10.8%(+52.1)#36 | 10.9%(+52.0)#713 |
| 37. | Celeste | 62.2% | 10.8%(+51.4)#37 | 10.9%(+51.3)#726 |
| 38. | Uvalde Estates | 61.8% | 10.8%(+51.0)#38 | 10.9%(+50.9)#731 |
| 39. | Thunderbird Bay | 60.8% | 10.8%(+50.0)#39 | 10.9%(+49.9)#753 |
| 40. | Arp | 60.7% | 10.8%(+49.9)#40 | 10.9%(+49.8)#755 |
| 41. | Quitaque | 59.9% | 10.8%(+49.1)#41 | 10.9%(+49.0)#785 |
| 42. | Midway | 58.8% | 10.8%(+48.0)#42 | 10.9%(+47.9)#808 |
| 43. | Avinger | 58.2% | 10.8%(+47.4)#43 | 10.9%(+47.3)#822 |
| 44. | Chilton | 57.7% | 10.8%(+46.9)#44 | 10.9%(+46.8)#831 |
| 45. | Westover Hills | 57.2% | 10.8%(+46.4)#45 | 10.9%(+46.3)#846 |
| 46. | Jamaica Beach | 56.5% | 10.8%(+45.7)#46 | 10.9%(+45.6)#872 |
| 47. | Lefors | 56.2% | 10.8%(+45.4)#47 | 10.9%(+45.3)#881 |
| 48. | Hunters Creek Village | 56.0% | 10.8%(+45.2)#48 | 10.9%(+45.1)#884 |
| 49. | Devers | 55.5% | 10.8%(+44.7)#49 | 10.9%(+44.6)#904 |
| 50. | Mount Calm | 55.5% | 10.8%(+44.7)#50 | 10.9%(+44.6)#905 |
| 51. | San Augustine | 55.2% | 10.8%(+44.4)#51 | 10.9%(+44.3)#919 |
| 52. | Horseshoe Bend | 51.6% | 10.8%(+40.8)#52 | 10.9%(+40.7)#1,042 |
| 53. | Kirbyville | 51.4% | 10.8%(+40.6)#53 | 10.9%(+40.5)#1,045 |
| 54. | Spring Gardens | 50.8% | 10.8%(+40.0)#54 | 10.9%(+39.9)#1,060 |
| 55. | Indian Springs | 50.1% | 10.8%(+39.3)#55 | 10.9%(+39.2)#1,079 |
| 56. | Round Mountain | 50.0% | 10.8%(+39.2)#56 | 10.9%(+39.1)#1,144 |
| 57. | Murchison | 48.0% | 10.8%(+37.2)#57 | 10.9%(+37.1)#1,241 |
| 58. | Holly Lake Ranch | 46.6% | 10.8%(+35.8)#58 | 10.9%(+35.7)#1,275 |
| 59. | Texline | 46.6% | 10.8%(+35.8)#59 | 10.9%(+35.7)#1,281 |
| 60. | Redfield | 46.6% | 10.8%(+35.8)#60 | 10.9%(+35.7)#1,285 |
| 61. | Groveton | 46.1% | 10.8%(+35.3)#61 | 10.9%(+35.2)#1,303 |
| 62. | Christine | 45.4% | 10.8%(+34.6)#62 | 10.9%(+34.5)#1,346 |
| 63. | Maypearl | 45.1% | 10.8%(+34.3)#63 | 10.9%(+34.2)#1,357 |
| 64. | Franklin | 45.0% | 10.8%(+34.2)#64 | 10.9%(+34.1)#1,361 |
| 65. | Miller S Cove | 44.8% | 10.8%(+34.0)#65 | 10.9%(+33.9)#1,378 |
| 66. | Doolittle | 44.6% | 10.8%(+33.8)#66 | 10.9%(+33.7)#1,382 |
| 67. | Buna | 44.5% | 10.8%(+33.7)#67 | 10.9%(+33.6)#1,384 |
| 68. | Cumby | 44.4% | 10.8%(+33.6)#68 | 10.9%(+33.5)#1,393 |
| 69. | Annetta North | 44.4% | 10.8%(+33.6)#69 | 10.9%(+33.5)#1,395 |
| 70. | Powderly | 43.7% | 10.8%(+32.9)#70 | 10.9%(+32.8)#1,432 |
| 71. | Kress | 43.7% | 10.8%(+32.9)#71 | 10.9%(+32.8)#1,436 |
| 72. | Evadale | 43.4% | 10.8%(+32.6)#72 | 10.9%(+32.5)#1,462 |
| 73. | Presidio | 43.2% | 10.8%(+32.4)#73 | 10.9%(+32.3)#1,478 |
| 74. | Abram | 43.1% | 10.8%(+32.3)#74 | 10.9%(+32.2)#1,483 |
| 75. | Southside Place | 43.0% | 10.8%(+32.2)#75 | 10.9%(+32.1)#1,488 |
| 76. | Woodcreek | 42.5% | 10.8%(+31.7)#76 | 10.9%(+31.6)#1,534 |
| 77. | Cottonwood | 42.1% | 10.8%(+31.3)#77 | 10.9%(+31.2)#1,556 |
| 78. | Piney Point Village | 41.8% | 10.8%(+31.0)#78 | 10.9%(+30.9)#1,575 |
| 79. | Newcastle | 41.6% | 10.8%(+30.8)#79 | 10.9%(+30.7)#1,589 |
| 80. | Stagecoach | 41.6% | 10.8%(+30.8)#80 | 10.9%(+30.7)#1,591 |
| 81. | Hico | 41.0% | 10.8%(+30.2)#81 | 10.9%(+30.1)#1,643 |
| 82. | Mirando City | 40.0% | 10.8%(+29.2)#82 | 10.9%(+29.1)#1,699 |
| 83. | Sunnyvale | 39.7% | 10.8%(+28.9)#83 | 10.9%(+28.8)#1,739 |
| 84. | Wimberley | 38.9% | 10.8%(+28.1)#84 | 10.9%(+28.0)#1,789 |
| 85. | Livingston | 38.4% | 10.8%(+27.6)#85 | 10.9%(+27.5)#1,813 |
| 86. | Daingerfield | 38.3% | 10.8%(+27.5)#86 | 10.9%(+27.4)#1,825 |
| 87. | Caddo Mills | 38.3% | 10.8%(+27.5)#87 | 10.9%(+27.4)#1,826 |
| 88. | Rosita | 38.1% | 10.8%(+27.3)#88 | 10.9%(+27.2)#1,841 |
| 89. | Troup | 37.7% | 10.8%(+26.9)#89 | 10.9%(+26.8)#1,870 |
| 90. | Mcleod | 37.5% | 10.8%(+26.7)#90 | 10.9%(+26.6)#1,893 |
| 91. | Haskell | 37.3% | 10.8%(+26.5)#91 | 10.9%(+26.4)#1,917 |
| 92. | Flat | 37.2% | 10.8%(+26.4)#92 | 10.9%(+26.3)#1,928 |
| 93. | Cockrell Hill | 36.9% | 10.8%(+26.1)#93 | 10.9%(+26.0)#1,941 |
| 94. | Bayview | 36.7% | 10.8%(+25.9)#94 | 10.9%(+25.8)#1,959 |
| 95. | Oak Ridge Town Cooke County | 36.3% | 10.8%(+25.5)#95 | 10.9%(+25.4)#1,992 |
| 96. | La Joya | 36.2% | 10.8%(+25.4)#96 | 10.9%(+25.3)#1,999 |
| 97. | Warren | 36.1% | 10.8%(+25.3)#97 | 10.9%(+25.2)#2,006 |
| 98. | Lake City | 36.0% | 10.8%(+25.2)#98 | 10.9%(+25.1)#2,016 |
| 99. | Nocona | 35.4% | 10.8%(+24.6)#99 | 10.9%(+24.5)#2,066 |
| 100. | Burke | 35.2% | 10.8%(+24.4)#100 | 10.9%(+24.3)#2,092 |
Common Questions
What are the Top 10 Cities with the Highest Unemployment Rate Amomg Youth Under the Age of 25 in Texas?
Top 10 Cities with the Highest Unemployment Rate Amomg Youth Under the Age of 25 in Texas are:
#1
100.0%
#2
100.0%
#3
100.0%
#4
100.0%
#5
100.0%
#6
100.0%
#7
100.0%
#8
100.0%
#9
100.0%
#10
100.0%
What city has the Highest Unemployment Rate Amomg Youth Under the Age of 25 in Texas?
Clint has the Highest Unemployment Rate Amomg Youth Under the Age of 25 in Texas with 100.0%.
What is the Unemployment Rate Amomg Youth Under the Age of 25 in the State of Texas?
Unemployment Rate Amomg Youth Under the Age of 25 in Texas is 10.8%.
What is the Unemployment Rate Amomg Youth Under the Age of 25 in the United States?
Unemployment Rate Amomg Youth Under the Age of 25 in the United States is 10.9%.